Abstract
Background:
North-Western and Western provinces of Zambia were reclassified as low-risk areas for yellow fever (YF). However, the current potential for YF transmission in these areas is unclear.
Aims:
To determine the current potential risk of YF infection.
Setting and Design:
A cross sectional study was conducted in North-Western and Western provinces of Zambia.
Materials and Methods:
Samples were tested for both YF virus-specific IgG and IgM antibodies by the ELISA and YF virus confirmation was done using Plaque Reduction Neutralization Test. The samples were also tested for IgG and IgM antibodies against other flaviviruses.
Results:
Out of the 3625 respondents who participated in the survey, 46.7% were males and 9.4% were aged less than 5 years. Overall, 58.1% of the participants slept under an impregnated insecticide-treated net and 20.6% reported indoor residual spraying of insecticides. A total of 616 (17.0%) samples were presumptive YF positive. The prevalence for YF was 0.3% for long-term infection and 0.2% for recent YF infection. None of the YF confirmed cases had received YF vaccine. Prevalence rates for other flaviviruses were 149 (4.1%) for Dengue, 370 (10.2%) for West Nile and 217 (6.0%) for Zika.
Conclusion:
There is evidence of past and recent infection of YF in both provinces. Hence, they are at a low risk for YF infection. Yellow fever vaccination should be included in the EPI program in the two provinces and strengthen surveillance with laboratory confirmation.
Keywords: Prevalence, Western and North-Western provinces, yellow fever, Zambia
INTRODUCTION
Yellow fever (YF) is a viral hemorrhagic fever transmitted by mosquitoes carrying the YF virus.-[1] It affects an estimated 200,000 people globally and causes about 30,000 deaths annually. Case fatality rates in severe cases can exceed 50%. Estimates by WHO indicate that the true number of cases is close to 250 times the reported cases[2] because mild cases can go undetected as the signs and symptoms of YF are similar to those of viral hepatitis, malaria, leptospirosis, typhus, Ebola and other viral hemorrhagic fevers.
In a 10 country yellow-fever protection test survey conducted in Central and East Africa between 1937 and 1943, it was demonstrated that YF had occurred in Zambia, then Northern Rhodesia.[3] Robinson[4] reported that over 7% of more than 3000 blood samples from the population of the Balovale district in Kaonde-Lunda province now called North-Western province yielded positive results in protection tests. Many locations in the western part of Zambia in the Zambesi River basin were surveyed again in 1951-53; neutralizing antibodies were detected with a sero-prevalence up to 18%.[5] Western province, then Barotse Province and Balovale were included in the African endemic YF area. Zambia's potential for YF transmission is unclear. In 2010, North-Western and Western provinces of Zambia were designated as YF low-risk regions by a WHO Yellow Fever Technical Working Group[6] despite the fact that YF sero-prevalence studies were conducted six decades ago. In order to provide a more up-to-date sero-survey data, including results from tests for multiple flaviviruses, that will assist the WHO Yellow Fever Technical Working Group to confirm or refute the classification for Zambia, a study was conducted to determine the potential risk of YF infection in Western and North-Western provinces of Zambia.
MATERIALS AND METHODS
Study site
The study was conducted in Western and North-Western provinces of Zambia. Western province with a population of 902,974 borders with Angola and had seven districts which were divided into 1902 SEAs.[7] It is the driest area of Zambia and located at 1119 m above sea level and latitude -15.0 and longitude 24.0. The province has mean minimum and maximum temperatures of 8.7° C and 34.2° C in June and October, respectively, and an annual rainfall of 740 mm.[8,9] Western province has two main agro-ecological zones: Major valleys as zone I and Kalahari sand plateau and Zambezi flood plains as zone II. Crop and livestock production as well as fishing were the main economic activities in the province.
North-Western province located at 1354 m above sea level, latitude −13.0 and longitude 25.0 has a population of 727,044 and borders with Angola on the western side and Democratic Republic of Congo on the northern side with population movement along the borders. It had six districts that were divided into 1178 Standard Enumeration Areas (SEAs). The province receives the highest rainfall, with annual rainfall of 1320 mm. The mean minimum temperature in June and mean maximum temperature in October is 6.8° C and 30.6° C, respectively.[7,10,11] North-Western province is located in Agro-ecological zone III which is the part of the Central African plateau. The area is suitable for cultivating rice, cassava, pineapples and bananas.[12]
Study population
This assessment was carried out among individuals aged 9 months or older. Any individual aged 9 months or older and who was a member of a sampled household and resident in the study site for at least seven days was eligible to participate in the survey. Individuals who received YF vaccination in the last 10 years to the survey were also eligible to participate in the survey.
Any person, who was either less than 9 months of age, or any person regardless of age, who resided in the study site for a period of less than seven days prior to the survey was excluded from the study. Determining the sero-prevalence in children under the age of 9 months raises the risk of false positive results as children under this age may still carry maternal antibodies from immunized or exposed mothers. We did not collect samples from non-human primates.
Sample size and sampling
The sample size calculation was based on the assumption that the sero-prevalence was 7% based on the study conducted by Robinson.[4]
In estimating the sample size for persons aged 5 years or older, the following parameters were considered: A prevalence of 7%, desired precision or confidence interval (d) of ±3%, a design effect (DE) of 2 and an 80% response rate.
We aimed to recruit 700 male and 700 female participants in each province. Assuming an average of four persons aged 5 years or older in each household, a total of 12 households in each of the 30 cluster was to be recruited in the survey. The total number of persons aged 5 years or older that would be recruited from each province was 1400.
The sero-prevalence of children aged less than 5 years was about half that for older children, and in estimating the sample size for persons aged below 5 years, the following parameters were considered: A prevalence of 3.5%, desired precision or confidence interval (d) of ±3.4%, and a design effect (DE) of 2 and an 80% response rate. A total of 406 children aged below 5 years would be recruited for the survey.
The sample was drawn using a two-stage cluster sampling technique using probability proportional to size. A list of the standard enumeration areas (SEAs) in each province constituted the sampling frame. The line lists of the SEAs were provided by the Zambian Government's Central Statistics Office (CSO). The sampling was designed to achieve fairly good estimates at the provincial level of analysis, and not representing the subdivisions of the province.
Laboratory analysis
Each study participant was assigned a study number and the corresponding blood sample was labeled with the same study number. The study number was linked to the laboratory result and the questionnaire.
Three to 5 ml of blood was collected from each participant by venepuncture and collected in an EDTA tube. The samples were transported to a field laboratory on ice, where plasma was separated into a labeled cryovial. At the close of the field work, the samples were transported to the University Teaching Hospital Virology Laboratory (UTHVL) for testing.
Each plasma sample was tested for both YF virus-specific IgG and IgM antibodies by the ELISA method described in the ‘WHO Manual For The Monitoring Of Yellow Fever Virus Infection’[1] at the UTHVL. All YF virus IgG-positive and IgM-positive specimens were referred to the Institute Pasteur in Dakar, Senegal which serves as the WHO-AFRO Regional Reference Laboratory for Yellow Fever. In Dakar, the specimens were subjected to repeat YF virus-specific IgG and IgM ELISA testing in order to reconfirm the primary results. They were also assessed for IgG and IgM antibodies against other flaviviruses known to cause hemorrhagic fever-like disease including dengue, Zika and West Nile viruses that are also known to elicit cross-reactive antibodies.
All samples giving a YF virus-specific antibody-positive result either in Lusaka or Dakar were tested for IgG and IgM for other flaviviruses including dengue, West Nile virus and Zika virus to rule out cross-reactivity. All positive YF samples were analyzed for YF virus neutralizing antibodies by Plaque Reduction Neutralization Testing (PRNT) using standard methods.[13] Those found to be positive through the PRNT were confirmed to be seropositive for YF IgM or IgG.
Interpretation of laboratory results
All IgM- and IgG-positive results in the Elisa testing were deemed presumptive positive.
Participants with Plaque reduction neutralization test (PRNT) titers ≥1:10 were considered as being YF seropositive, while those having PRNT titers ≥1:20 were considered to have sero-protective levels of antibodies against YFV either through natural infection or through vaccination.
Data management and analysis
Data were entered in an Epi-Info data entry screen that had consistency and range checks embedded in it. Laboratory results and field survey data were merged using a unique identifier. Further editing was conducted by running frequencies during the analysis stage. Epi data files were exported to SPSS for data analysis. The chi-square test was used to determine associations between qualitative factors. The cut-off point for statistical significance was set at the 5% level.
Ethical considerations
Ethical clearance was sought from the Tropical Diseases Research Centre Research Ethics Committee in Ndola, Zambia, and ethical standards were adhered to throughout this study. Informed consent was sought from study participants. Guardians provided assent for the participation of the persons under the consenting age. They were asked to read or have read to them, understand and sign/thumbprint an informed consent form. Responsible adults in the household were identified to give proxy consent on behalf of minors.
RESULTS
A total of 3625 respondents participated in the survey. Figure 1 show the distribution of households where the respondents were recruited from.
Figure 1.
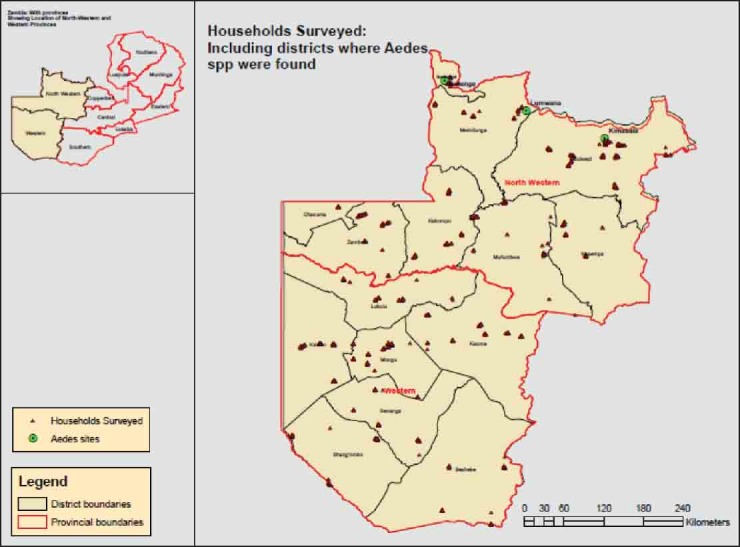
Distribution of households where participants were recruited
Sample description
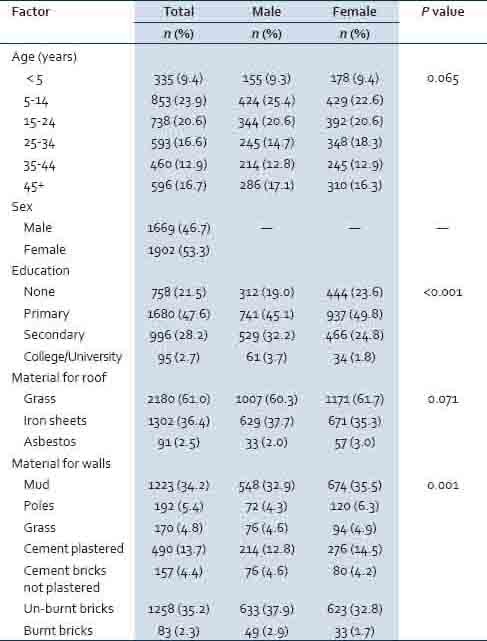
Table 1 shows the distributions of socioeconomic factors by province. Altogether 46.7% of the respondents were males and 9.4% were aged less than 5 years. Significantly more males than females had attained higher levels of education (P < 0.001). In terms of materials used for roofs 61.0% had roofs made of grass. Significantly more females than males had walls of their houses made of mud, poles, grass or plastered with cement (P = 0.001).
Table 1.
Distributions of socio-economic factors between provinces
Proportions of respondents reporting past medical history were similar between sexes, except that a significantly (P = 0.001) higher proportion of females (33.7%) than males (28.3%) reported having had fever in the previous 2 weeks to the survey [Table 2]. Overall 3.4% of the respondents reported having had jaundice in the previous 2 weeks to the survey, and 1.7% of the respondents reported bleeding from the nose, gums or gastro-intestinal track.
Table 2.
Past medical history by province
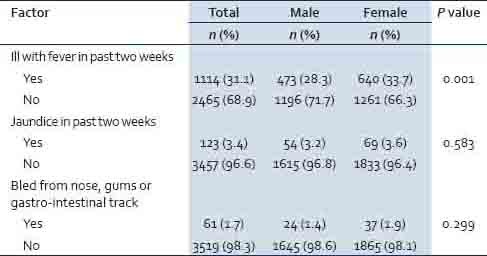
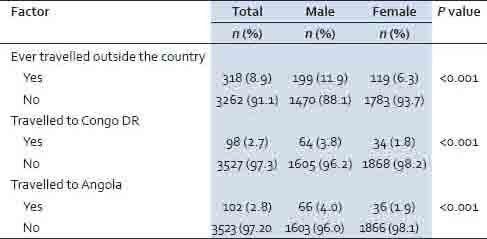
Table 3 shows history of travel, with significantly more males (11.9%) than females (6.3%) reporting having done so in a lifetime (P < 0.001), with 3.8% of males and 1.8% of females having travelled to Congo DR (P < 0.001); and 4.0% of males and 1.9% of females having travelled to Angola (P < 0.001).
Table 3.
History of travel from the provinces to outside the country
Overall, 1.1% of the respondents (0.1% confirmed by card and 1.0% card not seen) had received YF vaccination [Table 4].
Table 4.
History of vaccination against yellow fever by province

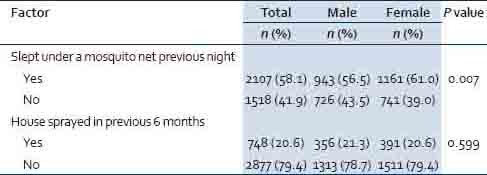
Significantly more females (61.0%) than males (56.5%) slept under a mosquito net the previous night. Overall, 20.6% of respondents reported their houses were sprayed in the previous 6 months to the survey [Table 5].
Table 5.
Prevention practices against mosquitoes in provinces
YF virus IgG-positive cases by socio-demographic characteristics
The prevalence of IgG for YF (also confirmed YF positive by PRNT) was 0.3% and was similar between sexes (0.5% of males and 0.2% of females; P = 0.248) as shown in Table 6. All the positive respondents were adults aged between 20 and 77 years with a mean (SD) age of 51 (18.8) years. Eight of the 12 positive respondents were males. In terms of their education status, 3 of the respondents had never been to school, 6 had attained primary level of education and 3 had attained secondary level of education. About a third of the respondents were farmers (34.0%).
Table 6.
YFV long-term infection by province

History of YF vaccination and travel outside the country by YF virus IgG seropositive cases
All the 12 respondents whose samples were positive for YF virus IgG and confirmed by PRNT had never received vaccination against YF. One positive respondent had previously travelled to Angola and another one to South Africa. The remaining 10 positive respondents had never travelled outside the country.
Medical history of YF virus IgG seropositive cases
Out of the 12 YF virus IgG-positive and PRNT confirmed cases, four had history of fever in the previous 2 weeks to the survey, one had jaundice in the previous 2 weeks to the survey and none reported history of bleeding in nose, gums or gastro-intestinal track.
Use of mosquito prevention methods among the YF virus IgG seropositive cases
Six of the 12 YF virus IgG-positive cases reported sleeping under an ITN and 3 reported that indoor residual house spraying was conducted.
YF virus IgM seropositive cases confirmed by PRNT
A total of six participants (three males and three females) were cases of recent YF infection, giving an overall prevalence of recent YF infection of 0.2% with no sex difference (0.2% of males and 0.1% of females; P = 0.427) as shown in Table 7. The age ranged from 37 to 71 years with a mean (SD) age of 59 (18.0) years. Of the six confirmed cases, three had never been to school, one had attained primary level of education and two had attained secondary level of education. Three cases had travelled outside the country: One to South Africa and two to DR Congo. One case had fever and there were no cases of jaundice or bleeding from the nose, gums or gastro-intestinal track. All the six confirmed cases of recent YFV infection had never been vaccinated again YF virus.
Table 7.
YFV recent infection by province

DISCUSSION
YF virus was confirmed in both North-western and Western provinces with an overall prevalence of 0.3% (0.2% in North-western and 0.4% in Western provinces). All the cases of YF were adults aged 20 years or older. The YF virus was currently circulating.
The observed prevalence in the current study is far less than what was observed in 1943 of 7%in the then Balovale area that includes the present Western and North-western province[4] and 18% in 1951-1953,[5] indicating 95.7% or 98.3% decline in sero-prevalence, respectively. The difference in the rates may partly be due to differences in method of laboratory analysis of samples collected, the stages of the epidemic and due to malaria vector control efforts. Because recent infections were observed in the current study, the two provinces may be in the early stages of the YF epidemic. It is not clear at what stage of the epidemic the Balovale area was.
While in the current study all cases of YF were of persons aged between 20 and 77 years, cases in a study conducted in Senegal 2002 cases were aged 3 to 38 years and no case was aged 40 years or older.[14] Children are more affected than adults because adults acquire natural immunity in a YF endemic area. The difference in the age distribution of the cases between the studies may partly be explained by the fact that YF was endemic in Senegal and potentially epidemic in the current study.
Previous studies have documented the presence of Aedes aegypti (L), Ae. simpsoni (Theo.) and Ae. luteocephalus (Newst.) and Ae. Africanus.[4] The control of these mosquitoes in Zambia include indoor residual spraying (IRS) and use of insecticide treated Nets (ITNs). The coverages of IRS as well of ITNs have increased nationwide. For example, the coverage of at least one ITN or recent IRS has increased from 43%in 2006 to 74% in 2012.[15] High coverage rates may reduce human-vector contacts, and hence reduce the risk to viral infection. However, the coverage rate for IRS of 27.6% in North-western province and 14.3% in Western province; and that for ITNs of 56.9% in North-western province and 61.1% in Western province were lower than the national figures.
Strengths and Limitations
The strength of the study lies in its large sample size. The samples were drawn using a two-stage cluster sampling technique using probability proportional to size and, hence, the samples are representative of the provinces. Although recall bias may have been introduced in our study, we are not able to determine its magnitude and direction. However, we believed that bias was minimum and that our findings may not have been significantly affected.
CONCLUSION
There is evidence of past and recent infection of YF in both provinces. Furthermore, the provinces border with areas where YF is endemic or transitional. Based on the classification of risk of transmission of YF virus by Jentes et al.,[16] the two provinces are at a low risk for YF infection. YF vaccination should be included in the EPI program in the two provinces. There is a need to strengthen the integrated disease surveillance and response (IDSR) in both provinces, given that diseases such as YF and other flaviviruses (Dengue, West Nile and Zika) were not reported. Periodic follow-up risk assessment may be useful to document the risk in future complemented by strong surveillance.
ACKNOWLEDGMENT
We acknowledge the laboratory support received from the Virology Laboratory at University Teaching Hospital in Lusaka, Zambia and from the Institute de Pasteur in Dakar, Senegal. We are grateful to the interviewers for their dedicated work to successfully complete the survey. The survey could not have been successful without the cooperation of the participants. The survey was funded by the Ministry of Health [Zambia] and the World Health Organization. The support was of the form of payment of field allowances, procurement of laboratory reagents and transport.
Footnotes
Source of Support: Ministry of Health, Lusaka, Zambia; World Health Organization, AFRO Region.
Conflict of Interest: None declared.
REFERENCES
- 1.Tomori O. Yellow fever: The recurring plague. Crit Rev Clin Lab Sci. 2004;41:391–427. doi: 10.1080/10408360490497474. [DOI] [PubMed] [Google Scholar]
- 2.Monath TP, Nystrom RR. Detection of yellow fever virus in serum by enzyme immunoassay. Am J Trop Med Hyg. 1984;33:151–7. doi: 10.4269/ajtmh.1984.33.151. [DOI] [PubMed] [Google Scholar]
- 3.Mahaffy AF, Smithburn KC, Hughes TP. The distribution of immunity in yellow fever in Central and East Africa. Trans R Soc Trop Med Hyg. 1946;40:57–82. doi: 10.1016/0035-9203(46)90062-4. [DOI] [PubMed] [Google Scholar]
- 4.Robinson GG. A note on mosquitoes and yellow fever in Northern Rhodesia. East Afr Med J. 1950;27:284–8. [PubMed] [Google Scholar]
- 5.Bonnel PH, Deutschman Z. La fievre jaune en Afrique au cours des annees recentes. Bull World Health Organ. 1954;11:325–89. [PMC free article] [PubMed] [Google Scholar]
- 6.Barnett ED. Yellow fever: Epidemiology and prevention. Clin Infect Dis. 2007;44:850–6. doi: 10.1086/511869. [DOI] [PubMed] [Google Scholar]
- 7.Central Statistical Office. 2010 census of population and housing. National analytical report. CSO. 2012 [Google Scholar]
- 8.Aregheore EM. Country pasture/forage resource profiles: Zambia. [Last accessed on 2014 May 19]. Available from: http://www.fao.org/ag/agp/AGPC/doc/Counprof/zambia/zambia.htm#_Toc131995467 .
- 9.Western province, Zambia. [Last accessed on 2014 May 19]. Available from: http://1worldmap.com/Zambia/Western-Province .
- 10.North-Western province; Zambia. [Last accessed on 2014 May 19]. Available from: http://1worldmap.com/Zambia/North-Western-Province .
- 11.Zambia: Climate. [Last accessed on 2014 May 19]. Available from: http://www.zambiatourism.com/aboutzambia/climate .
- 12.Country profile-Zambia. New Agriculturist. [Last accessed on 2014 May 19]. Available from: http://www.new-ag.info/en/country/profile.php?a=2621 .
- 13.WHO. WHO Manual for the monitoring of yellow fever virus infection WHO/IVB/04.08. Geneva: WHO; 2004. [Google Scholar]
- 14.Diallo M, Dia I, Ba Y, Sarr FD, Ly AB, Faye J, et al. Yellow Fever Outbreak in central part of Senegal 2002: Epidemiological Findings. J Public Health Epidemiol. 2013;5:291–6. [Google Scholar]
- 15.MOH, CSO, PATH, MACEPA, CDC, WHO. Zambia National Malaria Indicator Survey (MIS) Lusaka: Ministry of Health; 2012. [Google Scholar]
- 16.Jentes ES, Poumerol G, Gershman MD, Hill DR, Lemarchand J, Lewis RF, et al. The revised global yellow fever risk map and recommendations for vaccination, 2010: Consensus of the Informal WHO Working Group on Geographic Risk for Yellow Fever. Lancet Infect Dis. 2011;11:622–32. doi: 10.1016/S1473-3099(11)70147-5. [DOI] [PubMed] [Google Scholar]


