Abstract
Alteration of the number of copies of Double Minutes (DMs) with oncogenic EGFR mutations in response to tyrosine kinase inhibitors (TKIs) is a novel adaptive mechanism of glioblastoma. Here we provide evidence that such mutations in DMs, called here Amplification-Linked Extrachromosomal Mutations (ALEMs), originate extrachromosomally and could therefore be completely eliminated from the cancer cells. By exome sequencing of 7 glioblastoma patients we reveal ALEMs in EGFR, PDGFRA and other genes. These mutations together with DMs are lost by cancer cells in culture. We confirm the extrachromosomal origin of such mutations by showing that wild type and mutated DMs may coexist in the same tumor. Analysis of 4198 tumors suggests the presence of ALEMs across different tumor types with the highest prevalence in glioblastomas and low grade gliomas. The extrachromosomal nature of ALEMs explains the observed drastic changes in the amounts of mutated oncogenes (like EGFR or PDGFRA) in glioblastoma in response to environmental changes.
Introduction
Human cancers are characterized by the presence of genomic instability1,2. One form of genomic instability which makes tumors susceptible to acquiring point mutations is often referred to as the mutator phenotype 3,4,5. It is expected that the probability of acquisition of gain-of-function mutations in oncogenes is considerably lower than the probability of acquisition of loss-of-function mutations in tumor suppressor genes, because the first occur in a few critical sites, while the second occur anywhere in the coding sequence of the gene. Despite that, oncogenes harbor about 80% of driver mutations 6. This could be partially explained by frequent genomic focal amplification (FA) of some oncogenes (i.e. RTKs like EGFR, PDGFRA) 7,8 which may increase the probability of acquisition of gain-of-function mutations 9-14.
Several sources of evidence suggest that regions of genomic rearrangements including focal amplifications in cancer may be associated with high mutation loads. In germline, the DNA mutation loads depend on the number of replication cycles 15,16, and genomic rearrangements frequently coexist with the concomitant mutations17. Notably, the Break-Induced Replication Repair (BIR) pathway18,19 was recently suggested to be responsible for frequent genomic duplications in human cancers 20.
Double minutes (DM) and homogeneously staining regions (HSR) are the cytogenetic hallmarks of genomic FAs in cancer 21. DMs are extrachromosomal circular DNA molecules without centromere and are found in the nucleus or in the cytoplasm enveloped by a nuclear like membrane (micronuclei) allowing the transcription and DNA replication 22. The absence of centromere in DMs results in a random segregation between daughter cells through “hitchhiking” 23. DMs were found in many tumor types including glioblastomas (GBM) 13,24, low grade gliomas (LGG), ovary 25, breast 26, lung 27, colon 28,29 and neuroblastoma 25,30. The probable mechanism of DM formation involves non-homologous end joining (NHEJ) 31-33 which is active in different tumors, especially in those with defective homologous recombination (HR) 34. Therefore the mutation load in DMs is expected to be higher than that in chromosomal DNA because the repair of DNA damage by NHEJ results in acquisition of point mutations and small indels and the DNA damage repair mechanism is less efficient in the micronuclei compared to the nucleus 29,35. It is also expected that the mutational load in the regions amplified as DMs may be considerably higher than in chromosomal non-amplified DNA as this kind of amplification may reach 100s of copies per cell or more 36.
In this work we describe a novel class of mutations in cancer, Amplification-Linked Extrachromosomal Mutations (ALEMs) which occur in Double Minutes. ALEMs are detected in GBMs because they disappear from tumor cells during cell culture. While ALEMs are most prevalent in GBMs and low grade gliomas they also exist in other tumor types. Based on these findings, we propose a novel mechanism of acquisition of gain-of-function extrachromosomal mutations mediated by focal amplifications which may underlie acquisition of resistance to therapies.
Results
Amplification-Linked Mutations
We investigated the genetic heterogeneity of glioblastoma (GBM) by exome-sequencing of primary tumor fragments and derived gliomaspheres from seven patients. GBMs were selected for the study because these tumors are characterized by frequent Focal Amplifications (FAs) in their genomes (>50% of the cases) predominantly in the form of Double Minutes (DMs) 37. We took advantage of the fact that the cultured GBM spheres in certain conditions can lose DMs 38,39, in order to monitor the fate of point mutations within Focal Amplifications.
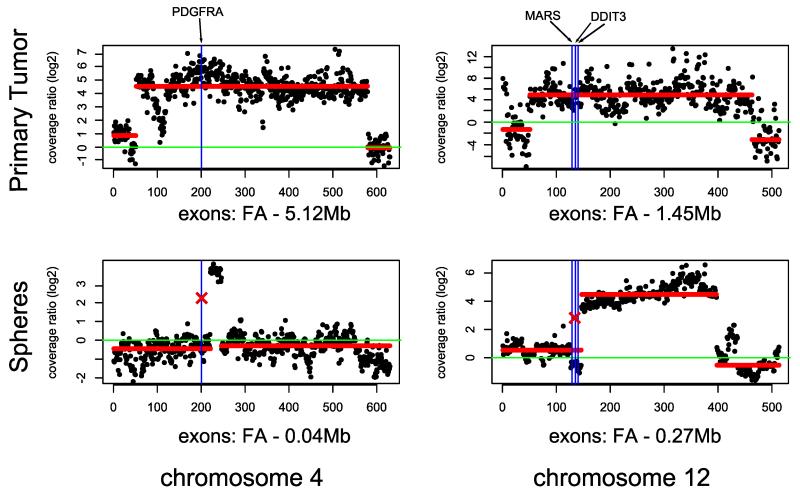
We observed 8 mutations present within FAs in the primary tumors, and remarkably, all of them were lost in the gliomaspheres after several passages (Table 1). Neither LOH nor chromosomal abnormalities have been detected in the corresponding regions in gliomaspheres. Notably, one individual had four mutations associated with FAs in the primary tumor which were lost in the spheres (GBM IV-34) (Figure 1). One of these mutations, PDGFRA N659K (COSM22415), was within a 5.1Mb amplification (chr4:52.86-57.98Mb) while the other three: MARS p.G888E, DDIT3 p.P11S and DDIT3 p.S31L were within an amplification of 1.5Mb on chromosome 12 (chr12:57.86-59.31Mb). The fraction of reads supporting these mutations was close to 100% in the primary tumor sample (86%, 97%, 99% and 100% respectively). Additionally we performed FISH analysis of the interphase nuclei of the GBM IV-34 primary tumor cells and gliomaspheres. The number and localizations of the PDGFRA signals in the primary GBM cells as well as their loss in the cell culture strongly suggests that this Focal Amplification is present in a form of Double Minutes (Supplementary Figure 1a and 1b).
Table 1. Mutations lost in the spheres and focal amplifications.
| ID | Gene (mut) | Spheres (% reads) | Tumor (% reads) | Overlap to amplification in tumor | Amplification in spheres | Passages of spheres |
|---|---|---|---|---|---|---|
| GBM IV-34 | DDIT3 (p.P11S) | 0 | 99 | yes | No | 6 |
| GBM IV-34 | MARS (p.G888E) | 0 | 97 | yes | No | 6 |
| GBM IV-34 | DDIT3 (p.S31L) | 0 | 100 | yes | No | 6 |
| GBM IV-34 | PDGFRA (p.N659K) | 0 | 86 | yes | No | 6 |
| SK01600 ** | EGFR (p.C326S) | 0 | 36 | yes | No | 0 |
| GBM IV-19 | EGFR (p.A289V) | 57 (0*) | 77 | yes | Yes (No*) | 0(3*) |
| GBM IV-39 | EGFR (p.S227Y) | 88 (0*) | 98 | yes | Yes (No*) | 0 (4*) |
Later passages have lost the EGFR mutations and amplifications as revealed through Sanger sequencing and FISH.
The sample was reanalyzed from Yost et al., 201340
Figure 1. Two examples of Focal Amplifications in primary GBM IV-34 in the tumor tissues which are lost in the gliomaspheres.
Y axis- normalized log2 ratios of the sequence coverages between the tumor and the normal samples. X axis – equidistantly plotted exons. Green line – diploid state in the tumor. Blue vertical lines depict positions of the mutations. Crosses represent the loss of mutations in gliomaspheres. Red horizontal lines represent HMM prediction of the regions of amplifications. Focal Amplifications are estimated taking into account the fraction of tumor cells in the tumor samples.
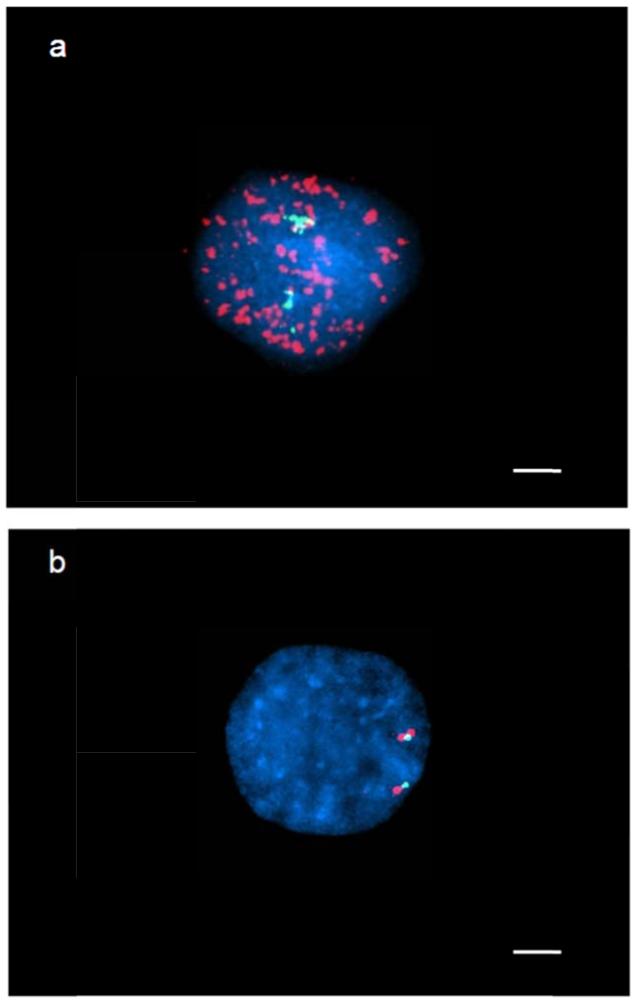
Similar observations were made comparing variants in primary tumors vs. spheres from patients GBM IV-19 and GBM IV-39. In both tumors the EGFR (p.A289V and p.S227Y) mutations and focal amplifications were present in the primary tissues and gliomaspheres at passage 0, however they were completely lost at later passages (Table 1). The Double Minutes amplifications containing the EGFR locus in the primary tumors and their loss in gliomaspheres in both GBM IV-19 and GBM IV-39 were confirmed by FISH analyses (Figure 2, Supplementary Figure 1c and 1d).
Figure 2. FISH analysis for the detection of EGFR amplification in GBM IV-19 cells.
a. FISH in primary tumor cells demonstrates euploid chromosome 7 (green signal) and multiple copies of EGFR scattered all over the nucleus (red signal). b. Cultured tumor cells shows euploid chromosome 7 in green and not amplified EGFR (red signal). Scale bar = 5μm.
Additionally we performed metaphase FISH analysis on a GBM cell line (GBM6 kindly provided by Prof. Paul S. Mischel) characterized by strong amplification of the EGFR gene. This cell line is of particular interest as amplified EGFR copies harbor the in-frame deletion of exons 2 to 7 coding for the extracellular ligand (EGFRvIII)9.
FISH was performed with probes targeting EGFR and the centromere of chromosome 7. EGFR was present in multiple extrachromosomal copies >100. After culturing with erlotinib in the media, we have repeated the FISH with the same conditions and, in agreement with our previous observations, all extrachromosomal copies have disappeared. Only the chromosomal EGFR was detectable.
We have also analyzed the data of one patient with GBM reported in the literature 40 where both the primary tumor tissue and spheres were sequenced. The EGFR p.C326S (COSM1600351) mutation was within the focally amplified region and was identified in 36% of reads of the primary tumor but was lost in the spheres.
Mutations of extrachromosomal origin
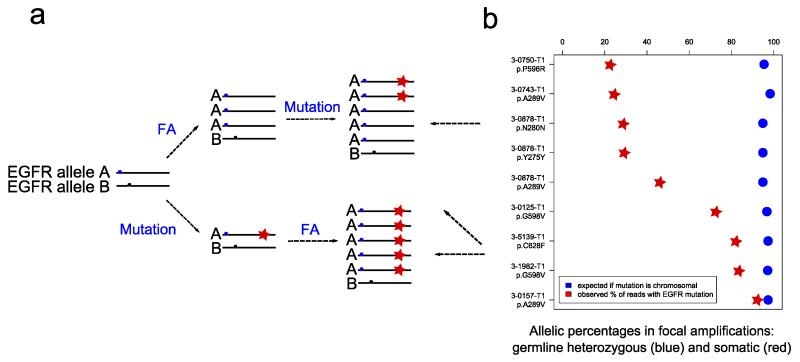
These results raise the question of the origin of the mutations associated with FAs that are present in the primary GBMs and disappear in neurospheres. If mutations associated to FAs are of chromosomal origin and therefore cannot be lost without causing an LOH then their absence in the spheres could be explained by the expansion of a different clone without such mutations (Figure 3a lower panel). On the other hand if mutations occur after the formation of DMs and therefore are of extrachromosomal origin, their absence in the spheres could be explained by the loss of DMs from the tumor cells (Figure 3a upper panel). In this case in one cell wild type DM copies must for some time coexist with DM mutated copies.
Figure 3. Somatic mutations in EGFR occur after focal amplifications in GBM.
a. Models of extrachromosomal mutations (in Double Minutes) (upper panel) and chromosomal mutation followed by amplification (lower panel). b. Allelic percentages of heterozygous germline variants and somatic mutations in EGFR focal amplifications. Heterozygous germline variants of allele A and B (blue and black circles); Somatic mutations (red stars). GBM tumors were reanalyzed from TCGA consortium.
In order to validate this hypothesis we reanalyzed the DNA sequencing data from GBM primary tumors from the TCGA study10 with FAs and point mutations in EGFR, focusing on samples where EGFR mutations were present in less than 90% of reads (Figure 3b). The allelic ratio of germline heterozygous variants in the tumors was used to estimate the extent of FAs. Cases with suspicion of more than one focal amplification of the EGFR locus were excluded (Supplementary Figure 2). In the 7 remaining TCGA GBM tumors we detected 9 EGFR mutations showing a level of amplification of more than 36 copies per cell. The allelic ratio in these FAs was close to 1 indicating that almost all sequence reads (=>95%) originate from the amplified copies. In addition, 4 out of 9 somatic point mutations in EGFR were present in less than 50% of reads, indicating that a fraction of DM molecules did not contain the mutation (Figure 3a upper panel). Therefore, these data confirm the existence of GBM tumors in which the mutated and wild type DM copies coexist and therefore support the scenario where the DMs are first formed and the mutation subsequently occurred in one of the DM copies. Thereafter both populations of DM molecules coexist until the DMs carrying the mutation are lost or fixed. We named this new class of mutations as Amplification-Linked Extrachromosomal Mutations (ALEMs).
Prevalence of ALEMs in different tumor types
In order to investigate the prevalence of co-localization of focal amplifications and mutations in various tumor types, we investigated 4198 tumors from 17 tumor types from the TCGA collection, for which both exome sequencing and CNV analyses were performed (Supplementary Table 1).
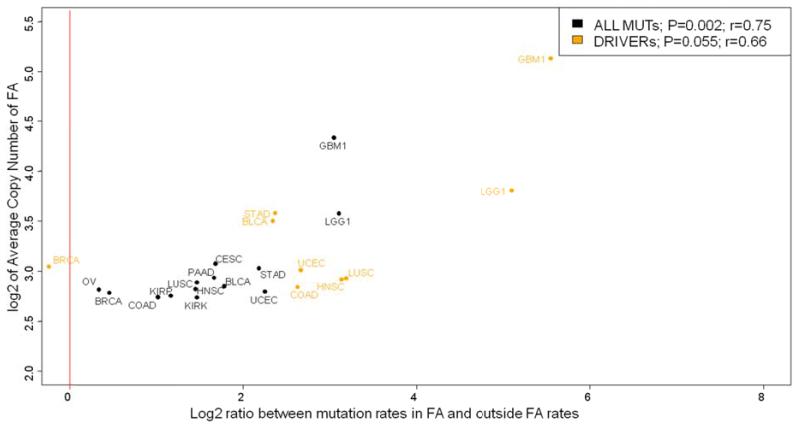
The Focal Amplifications (FAs) matching the characteristics of DMs and HSR 31 (more than 4 copies and length < 6 Mb) were included in the study as described in the methods. In total we have identified 1129 somatic mutations across all tumor types which map within regions of FAs and comprise 0.58% of all studied mutations. We found a positive correlation between mutation rates and extent of FAs across all tumor types (P=0.002, R=0.75). In each tumor type the mutation rates within FAs were higher than outside, with an average increase of 3.67 fold ± 2.68. The most important increase of mutation rates within FAs were observed in brain tumors: low grade gliomas (LGG; 9 fold) and glioblastomas (GBM; 8 fold) (Figure 4). These tumor types are characterized by frequent FAs in the form of DMs. Since DMs are isolated circular DNA molecules, we hypothesized that a competition between DM copies bearing different somatic mutations may result in positive selection for copies with the strongest oncogenic driver mutation.
Figure 4. Correlation of increase of mutation rates in FAs with the FA copy number.
Statistical significance was assessed with ANOVA. X axis – log2 of the ratio between mutations rates inside FAs and outside. Y axis – log2 of the average copy number in FAs. Each data point represents the tumor type. Black – all mutations (N=14). Orange – mutations in oncogenes (N=9). Red line represents equal mutations rates inside and outside of FAs.
To test this hypothesis, we generated a data set of mutations enriched in oncogenic driver mutations in 54 documented oncogenes6.
Remarkably 27% of all “oncogenic” driver mutations were located within FAs. The probability of fixation of “oncogenic” driver mutations in FAs as compared to the total number of mutations increased in almost all tumor types with the most pronounced effect in LGG (4 fold) and GBM (6 fold). A similar result was obtained in a different dataset enriched in putative driver mutations where only mutations with at least 3 occurrences in the COSMIC v67 database (Supplementary Figure 3) were included. Interestingly, when a similar analysis was performed with only passenger mutations, many of these were also localized with FAs in all tumor types, however with a smaller enrichment compared to what was observed with putative driver mutations (Supplementary Figure 3).
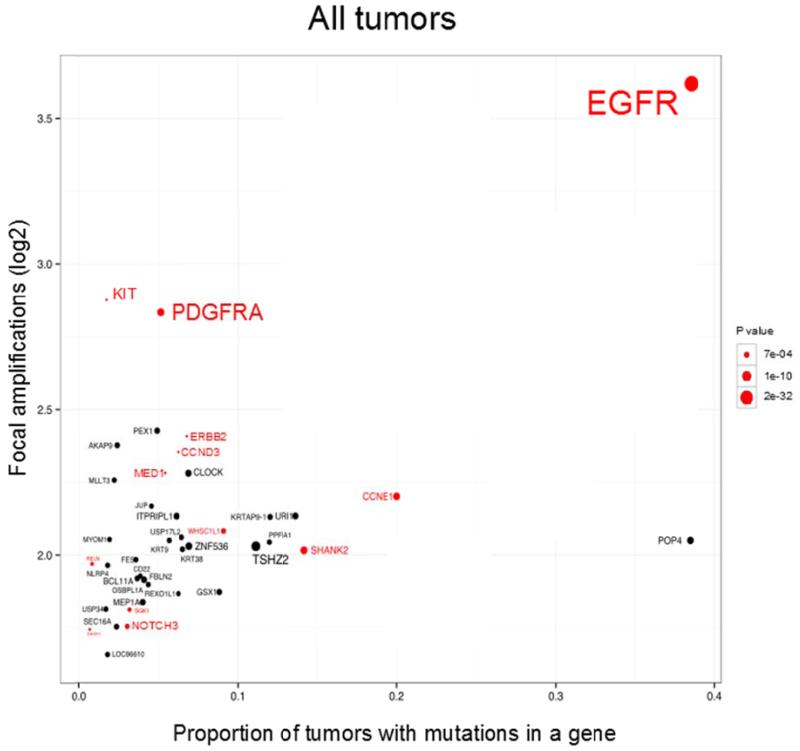
Next we investigated which genes exhibit non-random co-localization of mutations with focal amplifications. When all tumors were analyzed, 212 genes revealed a significant enrichment of mutations in focally amplified regions (p <0.05). This list of genes included RTK such as EGFR, PDGFRA, ERBB2, KIT; other receptors associated to cancer such as NOTCH3, EPHA6, and other oncogenes including CCNE1, BCL11A, WHSC1L1 and CDK8 (Supplementary Data 1).
We reasoned that genes mapping near known drivers found in focal amplifications, may also display increased mutation rate. We observed this effect in MED1 which is located 0.25Mb from ERBB2; and in SHANK2 and PPFIA1 genes near CCND1 (0.84Mb and 0.65Mb, respectively) which is known to be amplified in a form of DMs 27,39,41-45. These closely located genes on the chromosome are likely to be co-amplified in the same FA (Figure 5).
Figure 5. Co-localizations of mutations and amplifications on gene-by-gene basis across 17 tumor types and N=4198 tumor samples.
X-axis - proportion of mutations in Focal Amplifications, Y-axis - log2 of the average copy number in FAs. The area in circle is inversely proportional to the log2 of the log2 of the P value (Fisher test). All oncogenes are selected in red. All oncogenes are presented if they have at least one mutation in FAs and a P value less than 0.15, the other genes are presented if they have at least 2 mutations in FAs and P value less than 0.01.
In order to reveal tumor specific oncogenes that exhibit the pattern of co-localization of mutations within focal amplifications we repeated the gene-by-gene analyses independently per each tumor type. The strongest enrichment of mutations in FAs was observed in EGFR in GBM, low grade glioma, head and neck squamous cell carcinoma, lung and uterine cancer. PDGFRA mutations were enriched in FAs in GBM, low grade glioma and lung cancer; and KIT mutations in lung cancer. Similar co-localizations were observed for NOTCH3 mutations in ovarian and breast cancers; CCNE1 mutations in uterine cancer; BCL11A mutations in lung cancer and WHSC1L1 mutations in head and neck squamous cell carcinoma and lung cancer (Supplementary Figure 4).
The fraction of putative driver mutations that occurred in FAs was increased for all tested oncogenes. The most remarkable effect was observed in EGFR where the percentage of mutations in FA in all tumors increased from 39% (all mutations) to 65% (putative driver mutations) followed by PDGFRA (from 17 to 50% in LGG) and ERBB2 (from 7 to 11% in all tumors). These results taken together suggest a positive selection for DM clones carrying oncogenic driver mutations.
Discussion
In this work we demonstrate the existence of a non-random association of focal amplifications and likely driver mutations in tumors. In addition we propose a mechanism for acquisition of gain-of-function driver mutations in oncogenes mediated by the higher mutation load observed in DMs.
In several independent cases from this study and from Yost et al.40, both amplifications and mutations present in the primary GBM tumors were lost during cell culturing suggesting their extrachromosomal origin. DM origin of such mutations was confirmed by revealing the GBM tumors where wild type and mutated DM copies coexist (Figure 3a upper panel).
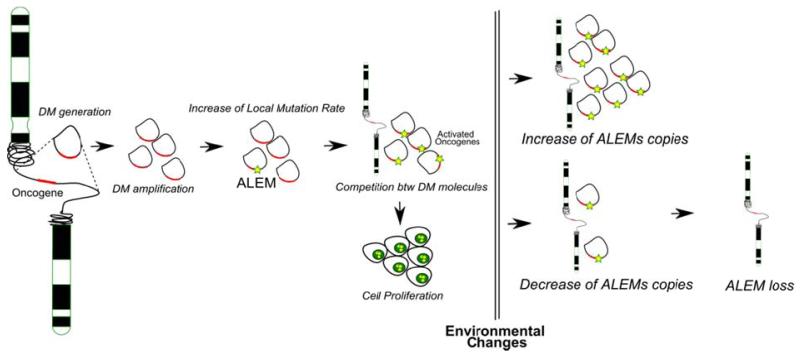
We hypothesize that this phenomenon is taking place in several steps. The process begins with the generation of the DM molecules, which may happen in an almost random fashion across the genome. When the increased number of copies of a gene provides a proliferative advantage to the tumor cell, this event has a probability of being expanded in the tumor. The amplified DNA region is prone to acquisition of an increased number of variants due to a higher number of DNA copies (similar mutation rates with corresponding locus of genomic DNA) or a higher rates of acquisition of variants (higher mutation rates than in the corresponding locus of genomic DNA) or a combination of both. Subsequently, DMs with the oncogenic variants may be subjected to selection based on the random distribution of DMs among daughter cells. After cell division the cell with the highest number of DMs harboring the driver mutation will have a proliferative advantage. The endpoint of this process is the presence of a high number of DMs per cell, where almost all copies have the driver ALEMs (Amplification-Linked Extrachromosomal Mutations) (Figure 6).
Figure 6. Model of generation and function of Amplification-Linked Extrachromosomal Mutations (ALEMs).
After random generation of the DM molecules, the amplified DNA region is prone to acquisition of an ALEM due to a higher number of DNA copies. The cell with the highest number of DMs harboring the ALEM will have a proliferative advantage. In response to environmental stress the cells may accordingly change the amount of DMs (see text for details).
An important consequence of this model is that, in the case of changes of environmental conditions, the number of DMs could be modulated and even reduced to zero resulting in the complete loss of ALEMs. The same mechanism would not be possible if these amplifications were in a form of HSR. Indeed the selection and competition between copies of amplified DNA with different genetic background is only possible between spatially isolated molecules, such as in the case of DMs. Moreover strong gain-of-function mutations in HSR amplifications would be detectable only if they have occurred at the early steps of amplification and were found in a high proportion of copies. Another consequence of this model observed in this study is the enrichment of passenger mutations in FAs which can be explained by the “hitchhiking” effect.
By studying a large number of tumors from publicly available data (TCGA consortium) we have detected co-localization of mutations with amplifications in tumors known to harbor DMs such as GBM, LGG and LUSC13,24,27. Interestingly, genes highly affected by ALEMs were members of RTK family, such as EGFR, PDGFRA and ERBB2. We also noted that driver ALEMs were 26 fold more frequent in GBM and 13 fold in LGG than passenger ALEMs. These two facts confirm the expected positive selection for driver mutations in DMs.
Remarkably, our model explains the observations made by Nathanson et al., 20149, where the extrachromosomal EGFRvIII mutation disappeared in response to Tyrosine-Kinase Inhibitors (TKIs).
ALEMs may make tumor cells fast-adaptable to environmental changes including those induced by anticancer treatments. For example, we speculate that this mechanism may be utilized to acquire resistance to vemurafenib treatment in the BRAF V600E positive tumors46. According to our model amplification of EGFR which is not a strong oncogenic event per se47-50 may increase the mutation load and enhance the probability of acquisition of the driver mutations in EGFR.
In conclusion, we provide evidence to support a novel type of cancer variants, the Amplification-Linked Extrachromosomal Mutations. They result from a mutagenic process which is based on the increased mutational load of DMs that include proliferation-promoting genes such as tyrosine-kinases receptors leading to an increased adaptive potential of the tumor cells.
Methods
Processing of tumors and gliomasphere cultures
In patient samples, tumor resections were obtained after surgery at the University Hospital of Geneva. After approval of the ethics committee of the Geneva University Hospitals (HUG) informed written consent was obtained for all subjects. Primary tumor samples were cut in pieces and fresh frozen until analysis. Human biopsies were chopped mechanistically and digested with papain and DNase to generate a cell suspension. Gliomaspheres were thereof generated as previously described 51. Briefly, media (DMEM-F12, B27 2%) and growth factors (EGF and bFGF at 10 ng/ml) were renewed once every 5 days. Peripheral blood was obtained at the time of surgery. Peripheral blood mononuclear cells were isolated over a Ficoll gradient and frozen in liquid nitrogen in 10% DMSO until analysis.
DNA extraction and exome sequencing
The overall methodology was as previously described52-54. Briefly, DNA was extracted from the two distant fragments of frozen tissues, neurosphere cultures (spheres) and PBL using the QIAamp DNA Mini Kit (Qiagen) for 7 patients with glioblastoma. When little material was available (<0.5ug), Whole Genome Amplification (WGA) was performed using REPLI-g Mini Kit (Qiagen). Exome capture was conducted using the SureSelect Human Exon v3 50Mb (Agilent Technologies) reagents and sequencing was performed on Illumina HiSeq2000 instrument with paired-end 105 nt reads. Burrows–Wheeler Aligner (BWA) software55 was used to align the sequence reads to the human reference genome (NCBI build GRCh37/hg19). SAMtools56 was used to remove PCR duplicates and to call single-nucleotide variants (SNV). Detection of small insertions and deletions (smINDEL) was conducted with Pindel 0.2.2 software57. The average sequencing coverage was 155× per DNA sample (Supplementary Table 2). The search for somatic mutations was restricted to the regions covered at least 20-fold in both the normal and tumor samples.
Calling of SNVs
The initial list of SNVs was filtered against the common (>1%) germline polymorphisms present in the dbSNP137 and 1,000 genomes databases. SNVs present in the normal tissue sample from the same patient at a frequency of greater than 1% were also filtered out. In contrast to SNVs, smINDELs were called with lower accuracy and, therefore, we report only those smINDELs that were validated by Sanger sequencing. For both SNVs and smINDELs, we focused on the mutations that map to the protein coding sequences and to splice sites, as the untranslated exonic regions were less well covered by the commercially available exome capture reagents used in this study (Supplementary Data 2).
Calling of LOHs and Focal Amplifications
Two sources of information from exome sequencing were used to estimate the somatic copy number alterations (SCNAs): i) the fractions of reads with the heterozygous germline variants, and ii) the ratios of the coverages of the tumor sample and the corresponding normal DNA. An in-house hidden Markov models (HMM) based algorithm was used to predict the regions of focal amplifications (FAs) taking into account both sources of data. Focal amplifications were confirmed with qPCR (Supplementary Figure 5). Primers for qPCR are reported in the Supplementary Table 3.
FISH analysis
Genes amplifications were investigated by FISH analysis using the LSI EGFR Spectrum Orange/CEP7 Spectrum Green probe (Vysis, Abbott Laboratories, Illinois, USA) and the BAC probe RP11-231c18 directed against PDGFRA (chr4:55,127,335-55,259,498; hg19, spectrum green) and the control probe dj963K6 (4qter, spectrum red).
The FISH signals for each locus-specific FISH probe were assessed under an Zeiss Axioscop microscope (Zeiss,Germany) equipped with specific filters (DAPI/Green/Red). DAPI II (4,6-diamino-2-phenyindole-2-hydrochloride) was used for chromatin counterstaining.
TCGA data analysis
The tumors for which exome-sequencing and CNV data were publicly available in The Cancer Genome Atlas (TCGA)10 were analyzed in this study (Supplementary Table 1). When several kinds of SNV analyses were available for the same tumors, we selected those which covered the largest number of samples. We selected amplifications of more than 4fold and length less than 6 Mb31.
The Fisher exact test was applied for statistical assessment of nonrandom co-localization of focal amplifications and point mutations.
Supplementary Material
Acknowledgements
This study was supported by grants from the Swiss Cancer League (LSCC 2939-02-2012) and SER-Swiss Russia to SIN; SLCC2939-02-2012, Novartis14B065, “Dinu Lipatti” to SIN; ERA-NET to SEA and SIN; SNF 144082, ERC 249968, Foundation “ChildCare” to SEA and Foundation “Damm-Etienne” to IR; “Fondation Artères, Genève” and “Ligue genevoise contre le cancer” to PYD. The authors thank Prof. Paul Mischel for kindly providing the GBM6 cell line and Prof. Thanos Halazonetis for constructive discussion and comments on the manuscript.
Footnotes
Competing financial interests: The authors declare no conflict of interest
Accession Codes: Sequence data for exome-sequencing of primary tumor fragments, matched blood samples and derived gliomaspheres have been deposited in GenBank/EMBL/DDBJ under the accession code PRJNA263837.
References
- 1.Hanahan D, Weinberg RA. Hallmarks of cancer: the next generation. Cell. 2011;144:646–74. doi: 10.1016/j.cell.2011.02.013. [DOI] [PubMed] [Google Scholar]
- 2.Luo J, Solimini NL, Elledge SJ. Principles of cancer therapy: oncogene and non-oncogene addiction. Cell. 2009;136:823–37. doi: 10.1016/j.cell.2009.02.024. [DOI] [PMC free article] [PubMed] [Google Scholar]
- 3.Loeb LA, Springgate CF, Battula N. Errors in DNA replication as a basis of malignant changes. Cancer Res. 1974;34:2311–21. [PubMed] [Google Scholar]
- 4.Loeb LA, Bielas JH, Beckman RA. Cancers exhibit a mutator phenotype: clinical implications. Cancer Res. 2008;68:3551–7. doi: 10.1158/0008-5472.CAN-07-5835. discussion 3557. [DOI] [PubMed] [Google Scholar]
- 5.Loeb LA. Human cancers express mutator phenotypes: origin, consequences and targeting. Nat Rev Cancer. 2011;11:450–7. doi: 10.1038/nrc3063. [DOI] [PMC free article] [PubMed] [Google Scholar]
- 6.Vogelstein B, et al. Cancer genome landscapes. Science. 2013;339:1546–58. doi: 10.1126/science.1235122. [DOI] [PMC free article] [PubMed] [Google Scholar]
- 7.Cancer Genome Atlas, N Comprehensive molecular characterization of human colon and rectal cancer. Nature. 2012;487:330–7. doi: 10.1038/nature11252. [DOI] [PMC free article] [PubMed] [Google Scholar]
- 8.Cancer Genome Atlas, N Comprehensive molecular portraits of human breast tumours. Nature. 2012;490:61–70. doi: 10.1038/nature11412. [DOI] [PMC free article] [PubMed] [Google Scholar]
- 9.Nathanson DA, et al. Targeted therapy resistance mediated by dynamic regulation of extrachromosomal mutant EGFR DNA. Science. 2014;343:72–6. doi: 10.1126/science.1241328. [DOI] [PMC free article] [PubMed] [Google Scholar]
- 10.Brennan CW, et al. The somatic genomic landscape of glioblastoma. Cell. 2013;155:462–77. doi: 10.1016/j.cell.2013.09.034. [DOI] [PMC free article] [PubMed] [Google Scholar]
- 11.Sanborn JZ, et al. Double minute chromosomes in glioblastoma multiforme are revealed by precise reconstruction of oncogenic amplicons. Cancer Res. 2013;73:6036–45. doi: 10.1158/0008-5472.CAN-13-0186. [DOI] [PMC free article] [PubMed] [Google Scholar]
- 12.Snuderl M, et al. Mosaic amplification of multiple receptor tyrosine kinase genes in glioblastoma. Cancer Cell. 2011;20:810–7. doi: 10.1016/j.ccr.2011.11.005. [DOI] [PubMed] [Google Scholar]
- 13.Cancer Genome Atlas, N Comprehensive genomic characterization defines human glioblastoma genes and core pathways. Nature. 2008;455:1061–8. doi: 10.1038/nature07385. [DOI] [PMC free article] [PubMed] [Google Scholar]
- 14.Ercan D, et al. Amplification of EGFR T790M causes resistance to an irreversible EGFR inhibitor. Oncogene. 2010;29:2346–56. doi: 10.1038/onc.2009.526. [DOI] [PMC free article] [PubMed] [Google Scholar]
- 15.Kong A, et al. Rate of de novo mutations and the importance of father’s age to disease risk. Nature. 2012;488:471–5. doi: 10.1038/nature11396. [DOI] [PMC free article] [PubMed] [Google Scholar]
- 16.Nikolaev SI, et al. Life-history traits drive the evolutionary rates of mammalian coding and noncoding genomic elements. Proc Natl Acad Sci U S A. 2007;104:20443–8. doi: 10.1073/pnas.0705658104. [DOI] [PMC free article] [PubMed] [Google Scholar]
- 17.Carvalho CM, et al. Replicative mechanisms for CNV formation are error prone. Nat Genet. 2013;45:1319–26. doi: 10.1038/ng.2768. [DOI] [PMC free article] [PubMed] [Google Scholar]
- 18.Deem A, et al. Break-induced replication is highly inaccurate. PLoS Biol. 2011;9:e1000594. doi: 10.1371/journal.pbio.1000594. [DOI] [PMC free article] [PubMed] [Google Scholar]
- 19.Malkova A, Haber JE. Mutations arising during repair of chromosome breaks. Annu Rev Genet. 2012;46:455–73. doi: 10.1146/annurev-genet-110711-155547. [DOI] [PubMed] [Google Scholar]
- 20.Costantino L, et al. Break-Induced Replication Repair of Damaged Forks Induces Genomic Duplications in Human Cells. Science. 2013 doi: 10.1126/science.1243211. [DOI] [PMC free article] [PubMed] [Google Scholar]
- 21.Storlazzi CT, et al. Gene amplification as double minutes or homogeneously staining regions in solid tumors: origin and structure. Genome Res. 2010;20:1198–206. doi: 10.1101/gr.106252.110. [DOI] [PMC free article] [PubMed] [Google Scholar]
- 22.Shimizu N. Molecular mechanisms of the origin of micronuclei from extrachromosomal elements. Mutagenesis. 2011;26:119–23. doi: 10.1093/mutage/geq053. [DOI] [PubMed] [Google Scholar]
- 23.Botchan M. Hitchhiking without covalent integration. Cell. 2004;117:280–1. doi: 10.1016/s0092-8674(04)00410-6. [DOI] [PubMed] [Google Scholar]
- 24.Canute GW, et al. The hydroxyurea-induced loss of double-minute chromosomes containing amplified epidermal growth factor receptor genes reduces the tumorigenicity and growth of human glioblastoma multiforme. Neurosurgery. 1998;42:609–16. doi: 10.1097/00006123-199803000-00031. [DOI] [PubMed] [Google Scholar]
- 25.Lundberg G, et al. Binomial mitotic segregation of MYCN-carrying double minutes in neuroblastoma illustrates the role of randomness in oncogene amplification. PLoS One. 2008;3:e3099. doi: 10.1371/journal.pone.0003099. [DOI] [PMC free article] [PubMed] [Google Scholar]
- 26.Lalic H, Volavsek C, Radosevic-Stasic B. Chromosomal instability and double minute chromosomes in a breast cancer patient. Acta Med Okayama. 2004;58:51–8. doi: 10.18926/AMO/32120. [DOI] [PubMed] [Google Scholar]
- 27.Nielsen JL, et al. Evidence of gene amplification in the form of double minute chromosomes is frequently observed in lung cancer. Cancer Genet Cytogenet. 1993;65:120–4. doi: 10.1016/0165-4608(93)90219-c. [DOI] [PubMed] [Google Scholar]
- 28.Von Hoff DD, et al. Elimination of extrachromosomally amplified MYC genes from human tumor cells reduces their tumorigenicity. Proc Natl Acad Sci U S A. 1992;89:8165–9. doi: 10.1073/pnas.89.17.8165. [DOI] [PMC free article] [PubMed] [Google Scholar]
- 29.Shimizu N, Misaka N, Utani K. Nonselective DNA damage induced by a replication inhibitor results in the selective elimination of extrachromosomal double minutes from human cancer cells. Genes Chromosomes Cancer. 2007;46:865–74. doi: 10.1002/gcc.20473. [DOI] [PubMed] [Google Scholar]
- 30.Ambros IM, et al. Neuroblastoma cells can actively eliminate supernumerary MYCN gene copies by micronucleus formation--sign of tumour cell revertance? Eur J Cancer. 1997;33:2043–9. doi: 10.1016/s0959-8049(97)00204-9. [DOI] [PubMed] [Google Scholar]
- 31.Vogt N, et al. Molecular structure of double-minute chromosomes bearing amplified copies of the epidermal growth factor receptor gene in gliomas. Proc Natl Acad Sci U S A. 2004;101:11368–73. doi: 10.1073/pnas.0402979101. [DOI] [PMC free article] [PubMed] [Google Scholar]
- 32.Lengauer C, Kinzler KW, Vogelstein B. Genetic instabilities in human cancers. Nature. 1998;396:643–9. doi: 10.1038/25292. [DOI] [PubMed] [Google Scholar]
- 33.Collis SJ, DeWeese TL, Jeggo PA, Parker AR. The life and death of DNA-PK. Oncogene. 2005;24:949–61. doi: 10.1038/sj.onc.1208332. [DOI] [PubMed] [Google Scholar]
- 34.Nik-Zainal S, et al. Mutational processes molding the genomes of 21 breast cancers. Cell. 2012;149:979–93. doi: 10.1016/j.cell.2012.04.024. [DOI] [PMC free article] [PubMed] [Google Scholar]
- 35.Yu L, et al. Gemcitabine eliminates double minute chromosomes from human ovarian cancer cells. PLoS One. 2013;8:e71988. doi: 10.1371/journal.pone.0071988. [DOI] [PMC free article] [PubMed] [Google Scholar]
- 36.Quinn LA, Moore GE, Morgan RT, Woods LK. Cell lines from human colon carcinoma with unusual cell products, double minutes, and homogeneously staining regions. Cancer Res. 1979;39:4914–24. [PubMed] [Google Scholar]
- 37.Bigner SH, Vogelstein B. Cytogenetics and molecular genetics of malignant gliomas and medulloblastoma. Brain Pathol. 1990;1:12–8. doi: 10.1111/j.1750-3639.1990.tb00633.x. [DOI] [PubMed] [Google Scholar]
- 38.Schulte A, et al. Glioblastoma stem-like cell lines with either maintenance or loss of high-level EGFR amplification, generated via modulation of ligand concentration. Clin Cancer Res. 2012;18:1901–13. doi: 10.1158/1078-0432.CCR-11-3084. [DOI] [PubMed] [Google Scholar]
- 39.Szerlip NJ, et al. Intratumoral heterogeneity of receptor tyrosine kinases EGFR and PDGFRA amplification in glioblastoma defines subpopulations with distinct growth factor response. Proc Natl Acad Sci U S A. 2012;109:3041–6. doi: 10.1073/pnas.1114033109. [DOI] [PMC free article] [PubMed] [Google Scholar]
- 40.Yost SE, et al. High-resolution mutational profiling suggests the genetic validity of glioblastoma patient-derived pre-clinical models. PLoS One. 2013;8:e56185. doi: 10.1371/journal.pone.0056185. [DOI] [PMC free article] [PubMed] [Google Scholar]
- 41.Bigner SH, Mark J, Bigner DD. Cytogenetics of human brain tumors. Cancer Genet Cytogenet. 1990;47:141–54. doi: 10.1016/0165-4608(90)90024-5. [DOI] [PubMed] [Google Scholar]
- 42.Fischer U, et al. A different view on DNA amplifications indicates frequent, highly complex, and stable amplicons on 12q13-21 in glioma. Mol Cancer Res. 2008;6:576–84. doi: 10.1158/1541-7786.MCR-07-0283. [DOI] [PubMed] [Google Scholar]
- 43.Phillips JJ, et al. PDGFRA amplification is common in pediatric and adult high-grade astrocytomas and identifies a poor prognostic group in IDH1 mutant glioblastoma. Brain Pathol. 2013;23:565–73. doi: 10.1111/bpa.12043. [DOI] [PMC free article] [PubMed] [Google Scholar]
- 44.Del Rey J, et al. Centrosome clustering and cyclin D1 gene amplification in double minutes are common events in chromosomal unstable bladder tumors. BMC Cancer. 2010;10:280. doi: 10.1186/1471-2407-10-280. [DOI] [PMC free article] [PubMed] [Google Scholar]
- 45.Gibaud A, et al. Extrachromosomal amplification mechanisms in a glioma with amplified sequences from multiple chromosome loci. Hum Mol Genet. 2010;19:1276–85. doi: 10.1093/hmg/ddq004. [DOI] [PubMed] [Google Scholar]
- 46.Su F, et al. Resistance to selective BRAF inhibition can be mediated by modest upstream pathway activation. Cancer Res. 2012;72:969–78. doi: 10.1158/0008-5472.CAN-11-1875. [DOI] [PubMed] [Google Scholar]
- 47.Holland EC, Hively WP, DePinho RA, Varmus HE. A constitutively active epidermal growth factor receptor cooperates with disruption of G1 cell-cycle arrest pathways to induce glioma-like lesions in mice. Genes Dev. 1998;12:3675–85. doi: 10.1101/gad.12.23.3675. [DOI] [PMC free article] [PubMed] [Google Scholar]
- 48.Weiss WA, et al. Genetic determinants of malignancy in a mouse model for oligodendroglioma. Cancer Res. 2003;63:1589–95. [PubMed] [Google Scholar]
- 49.Wei Q, et al. High-grade glioma formation results from postnatal pten loss or mutant epidermal growth factor receptor expression in a transgenic mouse glioma model. Cancer Res. 2006;66:7429–37. doi: 10.1158/0008-5472.CAN-06-0712. [DOI] [PubMed] [Google Scholar]
- 50.Corcoran RB, et al. EGFR-mediated re-activation of MAPK signaling contributes to insensitivity of BRAF mutant colorectal cancers to RAF inhibition with vemurafenib. Cancer Discov. 2012;2:227–35. doi: 10.1158/2159-8290.CD-11-0341. [DOI] [PMC free article] [PubMed] [Google Scholar]
- 51.Galli R, et al. Isolation and characterization of tumorigenic, stem-like neural precursors from human glioblastoma. Cancer Res. 2004;64:7011–21. doi: 10.1158/0008-5472.CAN-04-1364. [DOI] [PubMed] [Google Scholar]
- 52.Nikolaev SI, et al. A single-nucleotide substitution mutator phenotype revealed by exome sequencing of human colon adenomas. Cancer Res. 2012;72:6279–89. doi: 10.1158/0008-5472.CAN-12-3869. [DOI] [PubMed] [Google Scholar]
- 53.Nikolaev SI, et al. Exome sequencing identifies putative drivers of progression of transient myeloproliferative disorder to AMKL in infants with Down syndrome. Blood. 2013;122:554–61. doi: 10.1182/blood-2013-03-491936. [DOI] [PubMed] [Google Scholar]
- 54.Nikolaev SI, et al. Frequent cases of RAS-mutated Down syndrome acute lymphoblastic leukaemia lack JAK2 mutations. Nat Commun. 2014;5:4654. doi: 10.1038/ncomms5654. [DOI] [PMC free article] [PubMed] [Google Scholar]
- 55.Li H, Durbin R. Fast and accurate short read alignment with Burrows-Wheeler transform. Bioinformatics. 2009;25:1754–60. doi: 10.1093/bioinformatics/btp324. [DOI] [PMC free article] [PubMed] [Google Scholar]
- 56.Li H, et al. The Sequence Alignment/Map format and SAMtools. Bioinformatics. 2009;25:2078–9. doi: 10.1093/bioinformatics/btp352. [DOI] [PMC free article] [PubMed] [Google Scholar]
- 57.Ye K, Schulz MH, Long Q, Apweiler R, Ning Z. Pindel: a pattern growth approach to detect break points of large deletions and medium sized insertions from paired-end short reads. Bioinformatics. 2009;25:2865–71. doi: 10.1093/bioinformatics/btp394. [DOI] [PMC free article] [PubMed] [Google Scholar]
Associated Data
This section collects any data citations, data availability statements, or supplementary materials included in this article.


