Abstract
The ryanodine receptors (RyRs) are high-conductance intracellular Ca2+ channels that play a pivotal role in the excitation-contraction coupling of skeletal and cardiac muscles. RyRs are the largest known ion channels, with a homotetrameric organization and approximately 5000 residues in each protomer. Here we report the structure of the rabbit RyR1 in complex with its modulator FKBP12 at an overall resolution of 3.8 Å, determined by single-particle electron cryo-microscopy. Three previously uncharacterized domains, named Central, Handle, and Helical domains, display the armadillo repeat fold. These domains, together with the amino-terminal domain, constitute a network of superhelical scaffold for binding and propagation of conformational changes. The channel domain exhibits the voltage-gated ion channel superfamily fold with distinct features. A negative charge-enriched hairpin loop connecting S5 and the pore helix is positioned above the entrance to the selectivity filter vestibule. The four elongated S6 segments form a right-handed helical bundle that closes the pore at the cytoplasmic border of the membrane. Allosteric regulation of the pore by the cytoplasmic domains is mediated through extensive interactions between the Central domains and the channel domain. These structural features explain high ion conductance by RyRs and the long-range allosteric regulation of channel activities.
RyRs are responsible for rapid release of Ca2+ ions from sarcoplasmic/endoplasmic reticulum (SR/ER) into cytoplasm, a key event that triggers muscle contraction1-3. Three mammalian isoforms, RyR1, RyR2, and RyR3, share about 70 percent sequence identity. RyR1 and RyR2 are primarily expressed in skeletal and cardiac muscles, respectively, and RyR3 was originally found in the brain4,5. RyRs also share considerable sequence similarity with the IP3 receptor, another major SR/ER Ca2+ channel6,7. As the largest known ion channel, RyR has a molecular mass of over 2.2 million Daltons and consists of four identical protomers, each containing over 5000 residues that are folded into a cytoplasmic region and a transmembrane region4,8. Four identical transmembrane segments (TMs) enclose a central ion-conducting pore, whereas the cytoplasmic region senses interactions with diverse ligands ranging from ions, exemplified by Ca2+ and Mg2+, to proteins such as voltage-gated Ca2+ channel dihydropyridine receptor (DHPR, also known as Cav1.1). RyRs can therefore respond to a large number of stimuli with complex regulatory mechanisms9-11.
Ca2+ ions represent a primary regulator of RyRs10,12,13. The probability plot of channel opening versus Ca2+ concentration is bell-shaped14,15. In cardiocytes, voltage-gated opening of Cav1.2 causes influx of Ca2+ ions, which subsequently activates RyR2. In skeletal myocytes, action potential-induced conformational changes of Cav1.1 are physically coupled to channel opening of RyR1. In essence, Cav1.1 serves as the voltage sensor for RyR116,17. A variety of other chemicals and proteins modulate RyRs through independent or synergistic mechanisms. Among these modulators, the immunophilins FKBP12 and FKBP12.6 preferentially bind RyR1 and RyR2, respectively, and stabilize their closed states18. Because RyRs play an essential role in muscle contraction, their functional mutations are associated with a number of debilitating diseases. Aberrant function of RyR1 contributes to malignant hyperthermia and central core disease, whereas mutations in RyR2 may lead to heart disorders. Altogether, more than 500 disease-derived mutations have been mapped to the primary sequences of RyRs with several hotspots11.
Electron microscopy (EM) has been applied to structural studies of RyRs19-23. In fact, RyRs were initially identified in the EM negative staining images of the myocyte, which revealed the presence of “feet” between the T-tubule and SR24. Among the published cryo-EM structures, the highest overall resolution achieved for RyR1 is approximately 10 Å, revealing a mushroom-shaped architecture and a transmembrane domain thought to resemble the structure of the Kv2.1 channel23. In addition, crystal structures of the amino-terminal fragments and a phosophorylation hotspot domain of RyRs have been reported11.
Employing direct electron detection and advanced image processing algorithms for cryo-EM25-27, we have determined the structure of a closed-state RyR1 in complex with FKBP12 at an overall resolution of 3.8 Å. Near-atomic resolution is achieved at the channel domain (residues 4545-5037) and its adjoining domains in the cytoplasmic region, sufficient for de novo atomic model building. In total, 70% of the 2.2 million Dalton molecular mass of RyR1 was resolved.
Overall structure and domain assignment of RyR1
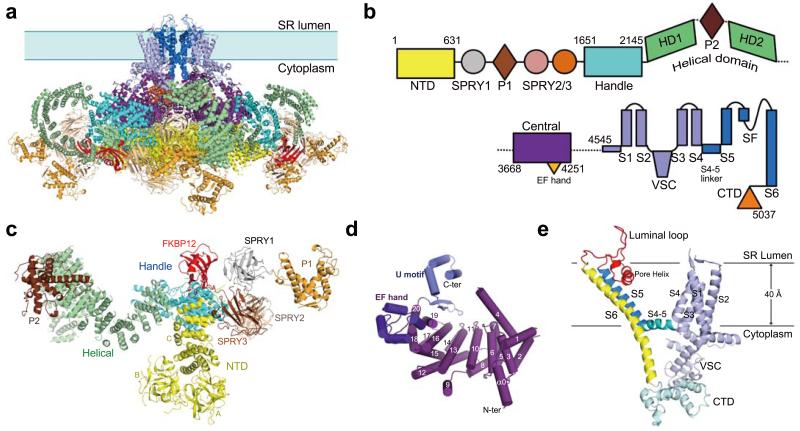
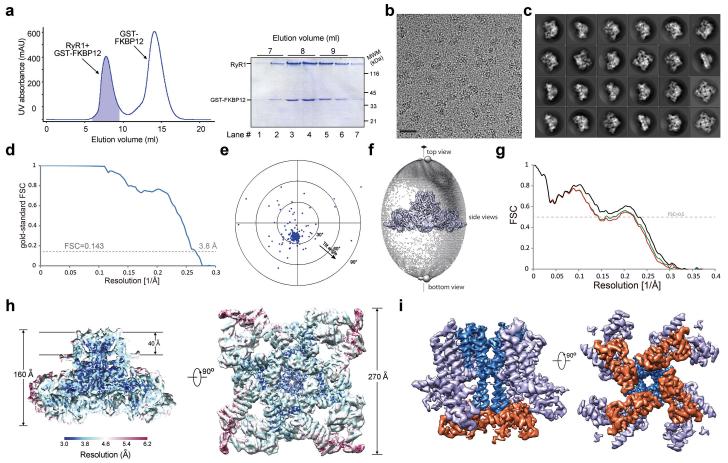
We used GST-FKBP12 as an affinity bait to purify RyR1 (residues 1-5037) from rabbit muscle and solved the structure by cryo-EM single-particle analysis (Extended Data Fig. 1). The tetrameric RyR1 has a pyramid appearance, with a square base of 270 Å by 270 Å and a height of 160 Å (Fig. 1a). Combining de novo model building and previous knowledge on isolated domains, the backbone of 3685 residues and more than 3100 specific side chains were assigned in each protomer (Extended Data Figs. 2-5, Supplementary Video 1).
Figure 1. Overall structure and domain organization of the rabbit RyR1.
a, Structure of the tetrameric RyR1 in complex with FKBP12. In all side views, the structure is presented with the SR luminal side on the top. b, A schematic illustration of domain organization in one RyR1 protomer. The annotation for domain abbreviations and detailed boundaries are reported in Extended Data Fig. 2c. c, Spatial arrangement of the cytoplasmic domains preceding the Central domain within one RyR1 protomer. Shown here is a cytoplasmic view. d, Structure of the Central domain. The Central domain comprises an armadillo repeat-like superhelical assembly of 20 α-helices, an EF-hand domain on the ridge of the assembly, and a U-motif at the carboxyl-terminus. e, Structure of the channel domain from one RyR1 protomer. All structure figures were prepared using PyMol43.
A total of nine distinct domains have been resolved in the cytoplasmic region of each protomer, including the N-terminal domain (NTD), three SPRY domains, P1 and P2 domains, Handle, Helical, and Central domains (Figs. 1b,c). The resolution and quality of the EM densities allowed side chain assignment for the NTD (residues 1-631), the Handle domain (residues 1651-2145), and the Central domain (residues 3668-4251). A large majority of the Helical domain (residues 2146-2712 for HD1 and 3016-3572 for HD2) only permitted tracing of the backbone. The density map for the three SPRY domains, P1/P2 domains, and FKBP12, which are located at the periphery of the tetrameric assembly, is considerably poorer than that for the central regions, but still allowed domain assignment and homologous structure-based model building. The Handle, Helical, and Central domains are previously uncharacterized, whereas the NTD has five additional α-helices compared to that in the crystal structure28 (Extended Data Figs. 3-6).
The Handle and the Helical domains are connected in both primary sequences and spatial arrangements (Figs. 1b,c). The Handle domain is formed by 16 α-helices, among which five pairs are homologous to the armadillo repeats (Extended Data Figs. 6c,f). The Helical domain, which comprises seventeen α-helical hairpins and seven α-helices at the carboxyl-terminal end, forms a right-handed superhelical assembly. The P2 domain (residues 2734-2940) bulges out from the outer surface of the assembly after the 10th repeat (Extended Data Fig. 6d).
In the Central domain, the bulk of the sequences forms a horseshoe-shaped subdomain with 19 α-helices organized into helical repeats conforming to the armadillo repeat fold29 (Extended Data Fig. 6g). The carboxyl-terminal ridge of the helical repeats is bound by an EF-hand subdomain (residues 4071-4131) corresponding to the previously identified EF-hands 1/230 (Fig. 1d, Extended Data Fig. 5). The carboxyl-terminal sequences of the Central domain form a U-shaped subdomain (U motif) that is positioned above the concave side of the armadillo repeats. The U motif consists of a β-hairpin, an α-helix hairpin at the carboxyl-terminus, and an intervening short α-helix (Fig. 1d).
In the channel domain, the TM segments S1 through S6 exhibit a voltage-gated ion channel (VGIC) superfamily fold (Fig. 1e). However, the RyR1 channel domain has three unique features. First, the extended S6 segment, with half in the membrane and the other half sticking into the cytoplasm, is immediately followed by a previously unknown small carboxyl-terminal subdomain (CTD). Second, the intervening sequences between S2 and S3 fold into a cytoplasmic subdomain, named VSC for cytoplasmic subdomain in the voltage-sensing like domain (VSL), which bridges CTD and the S1-S4 segments. Third, a hairpin loop between S5 and the pore helix projects into the SR lumen and is hence named the luminal loop. VSC, CTD, and the Central domain together constitute the previously defined “column” in RyR121,22 (Extended Data Fig. 2b).
Hierarchical organization of the RyR1 structure
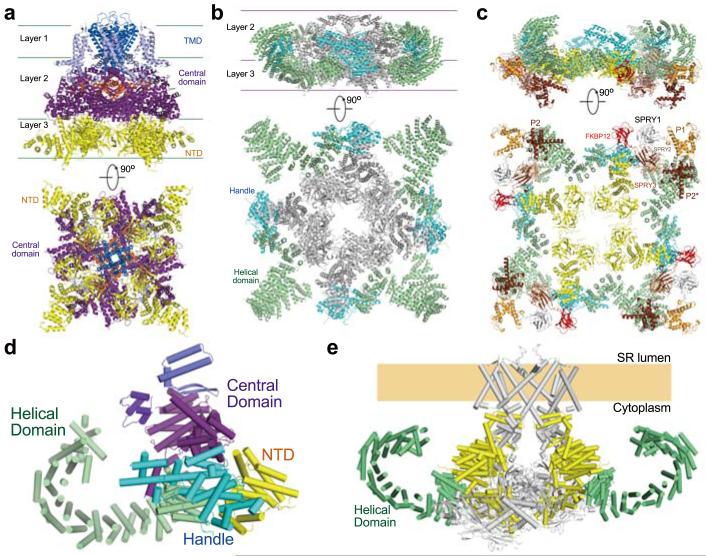
The tetrameric RyR1 structure has a hierarchical organization (Fig. 2, Supplementary Video 1). The overall structure can be divided into three zones: a central tower comprising the channel domain, the Central domains, and the NTDs (Fig. 2a), a corona formed by the Handle and Helical domains surrounding the central tower (Fig. 2b), and the peripheral domains comprising the three SPRY domains and P1/P2 domains that attach to the corona (Fig. 2c).
Figure 2. Hierarchical organization of the tetrameric RyR1.
a, A three-layered central tower forms the core of RyR1. The Central domain is the only cytoplasmic structure that directly interacts with the channel domain. b, The Handle and the Helical domains form a corona around the central tower. For visual clarity, NTD and the Central domain are colored grey and the channel domain is omitted. c, The peripheral domains of RyR1 attach to the corona. The Central domains and the channel domain are omitted. d, Two superhelical assemblies form a scaffold in the cytoplasmic region in each RyR protomer. The Helical domain constitutes one superhelical assembly; the armadillo-like repeats from NTD, the Handle and Central domains constitute the other. e, The two superhelical assemblies provide the binding scaffold and the adaptability for the propagation of conformational changes. Only two diagonal molecules are shown. The superhelical assemblies formed by NTD, the Handle and Central domains are colored yellow, the Helical domains are colored green, and the rest in grey.
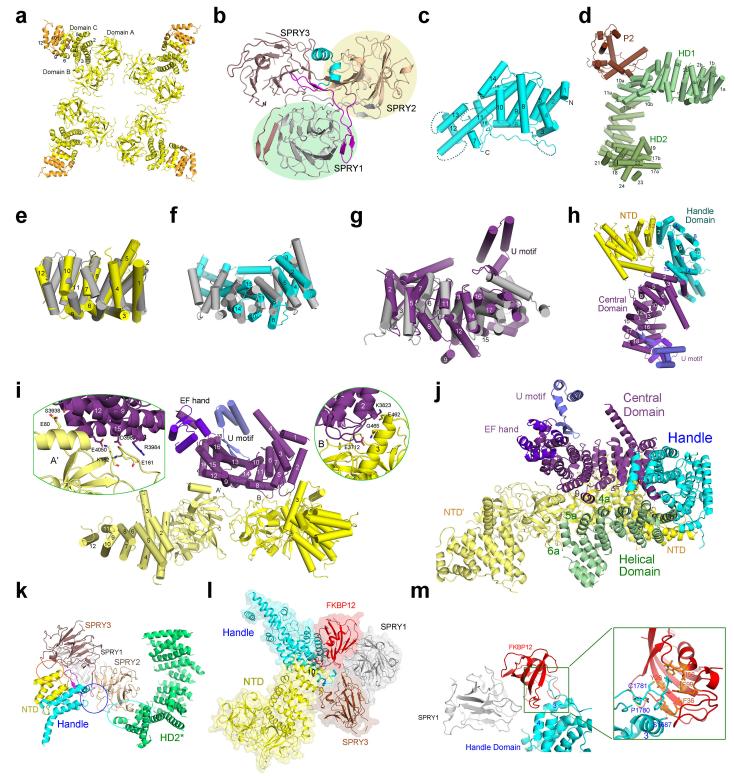
The central tower displays a three-layered organization along the four-fold axis: TM segments as layer 1, the cytoplasmic elements of the channel domain and Central domains as layer 2, and NTDs as layer 3 (Fig. 2a). The NTD comprises subdomains A and B, which are rich in β-strands, and subdomain C, which consists exclusively of 12 α-helices conforming to the armadillo repeats (Extended Data Figs. 6a,e). The four NTDs associate with each other through their respective subdomains A and B to form a central vestibule28. In contrast, the Central domains do not interact with each other. The amino-terminal helical repeats of the Central domain directly bind subdomain B and helix 3 of subdomain C in one NTD, and the carboxyl-terminal helices interact specifically with subdomain A of an adjacent NTD (Extended Data Figs. 6h-j). Notably, the Central domain is the only cytoplasmic structure that directly interacts with the channel domain (Figs. 1a, 2a) and thus must be responsible for allosteric coupling between conformational changes in the cytoplasmic region and the opening/closure of the channel.
The Handle and the Helical domains form a discontinuous corona surrounding the lower two layers of the central tower (Fig. 2b). The gap is occupied by SPRY2 (Extended Data Fig. 6k). The corona interacts extensively with the central tower and provides the binding platform for the peripheral domains as well as RyR modulators such as FKBP12 (Fig. 2c, Extended Data Figs. 6l,m). The peripheral domains contribute to the interactions between adjacent protomers and expand the cytoplasmic surface of RyR1.
Notably, the armadillo repeats from the NTD, Handle and Central domains merge end-to-end to form an extended superhelical assembly, which interacts with the other superhelical structure – the Helical domains – through an extensive interface (Figs. 2d, Extended Data Figs. 6h, j). The armadillo repeat fold, which belongs to the α-solenoid superfamily, is designed for binding to various cofactors and known for its inherent conformational adaptability29. Structural shifts caused by modulator binding may be propagated to other regions along the two superhelical assemblies, which ultimately affect the conformation of the Central domain, and impact on the channel domain (Fig. 2e). RyR1 therefore has the structural support to sense and propagate conformational changes from any location of the cytoplasmic region.
A closed channel
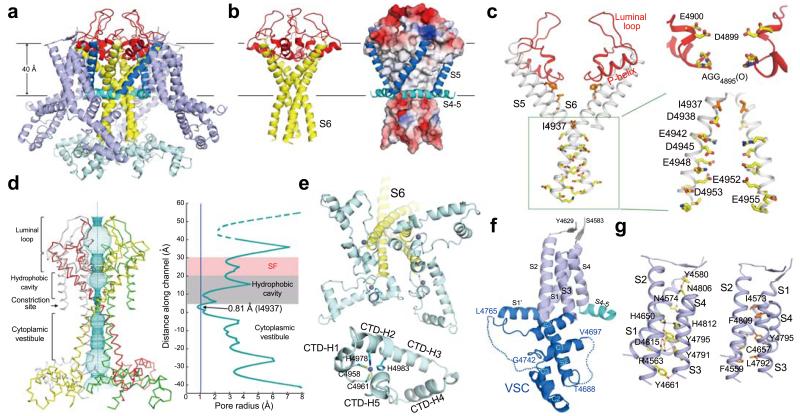
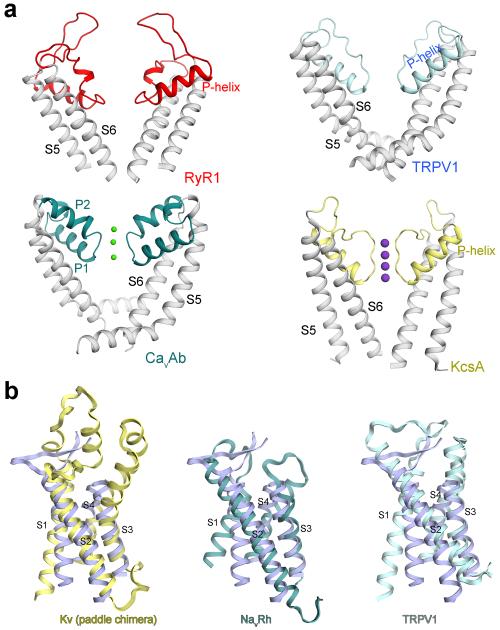
The near-atomic resolution allows a detailed analysis of the RyR1 channel domain (Fig. 3a, Extended Data Fig. 7). The ion-conducting pathway is formed entirely by the S6 segment and the selectivity filter (SF) (Fig. 3b). In K+ and TRPV1 channels, the SF is supported by a half-way pore-helix (P-helix) followed by a re-entrant loop, and an extra helix (the P2 helix) is present in Nav and CavAb channels (Extended Data Fig. 8a). The RyR1 protomer has only one intact pore-helix, and the pore-loop contains a helical turn at the entrance to the SF vestibule, where the side chains of Asp4899 and Glu4900 may constitute an ion-binding site (Fig. 3c).
Figure 3. Structure of the channel domain of RyR1.
a, The transmembrane region of the RyR1 channel domain exhibits a VGIC fold. The structural elements are color-coded as in Fig. 1e. b, The ion-conducting pore of RyR1 is formed by S6 segments and the selectivity filter (SF). Shown here are cartoon representation (left) and electrostatic surface potential (right), calculated by PyMol43. c, Structural analysis of the ion-conducting pathway. Shown here are two diagonal protomers (left) and a close-up view on an enlarged SF vestibule and the cytoplasmic segments of S6 (right). d, The RyR1 channel is closed at the cytoplasmic activation gate. The channel passage, calculated by HOLE40, is depicted by cyan dots (left). The pore radii along the ion-conducting pathway are tabulated (right) where the dashed lines indicate segments of poor EM densities. The position of the S4-5 helical axis is set as the origin of the Y-axis. e, A unique carboxyl-terminal domain (CTD) is tightly connected to S6 in each RyR1 protomer. Lower panel: Structure of one CTD where a C2H2-type ZF motif is identified. The zinc atom is shown as a purple sphere. f, Structure of the voltage sensor-like (VSL) domain in one protomer. The disordered sequences are indicated by dashed lines. g, The transmembrane segments S1-S4 interact closely with each other. Potential hydrogen bonds are shown as red dashed lines.
The SF vestibule is approximately 10 Å in length (Fig. 3d). An inner ion-binding site may be formed by the carbonyl oxygen groups of Ala4893/Gly4894/Gly4895 (Fig. 3c). The observed SF composition is consistent with previous predictions derived from sequence and mutational analyses31-35. Despite distinct physical attributes of the SF vestibule, the combination of an outer site by side chain carboxylates and an inner site by C=O groups within the SF vestibule is reminiscent of that in the Ca2+-conducting channel TRPV136 or CavAb37, suggesting a common principle for Ca2+ permeation. Consistent with its essential function, the SF is also a hotspot for disease-related mutations (Extended Data Figs. 7, 9, Supplementary Table 1).
RyR1 has a hairpin loop between S5 and the P-helix (Fig. 3c). Seven residues at the turn of the hairpin loop exhibit poor EM densities, implying intrinsic flexibility. Six out of the seven residues are Asp or Glu (Extended Data Fig. 3e). The highly electronegative luminal loops above the entrance to the SF vestibule may serve to attract cations and partially account for the store-overload-induced release38,39. Reflecting their functional importance, 8 out of the 16 residues in the luminal loop are targeted for disease-related mutations (Extended Data Figs. 7 & 9, Supplementary Table 1).
The extended S6 helices form a right-handed helical bundle with a bottleneck at the cytoplasmic edge of the SR membrane, which is encircled by the four S4-5 linker helices (Fig. 3b). Analysis of the pore radii with the program HOLE40 identified the constriction point at residues Ile4937 (Figs. 3c,d). The pore radius at the constriction point is less than 1 Å, impermeable to a completely dehydrated Ca2+ ion. Therefore, the structure represents a closed state, consistent with the condition of sample preparation15,23.
Due to the elongated S6 segments and the luminal loops above the SF vestibule, the conducting pathway of RyR1 is extraordinarily long, spanning approximately 90 Å from the SR lumen to the cytoplasm. Below the SF is a hydrophobic cavity (Fig. 3c), which represents a conserved feature observed in the K+, Nav, and TRPV1 channels. Consistent with previous analysis41, the cytoplasmic segment of S6 is highly enriched with Asp/Glu residues (Fig. 3c). The hydrophobic cavity and the high electronegativity along the cytoplasmic vestibule may facilitate rapid Ca2+ ion permeation from SR lumen to the cytoplasm.
A zinc finger (ZF)-containing CTD and the VSL
The cytoplasmic CTD (residues 4957-5037) comprises five short α-helices. Two cysteine and two histidine residues, Cys4958/Cys4961/His4978/His4983, together form a C2H2-type zinc finger (ZF) (Fig. 3e). In the context of the RyR1 homotetramer, the four CTDs are arranged like four blades of a windmill, where the ZF motifs are positioned close to the center and guard the exit of the ion-conducting pore (Fig. 3e). The S6 segment is connected to CTD through the ZF motif, which may restrict relative movement between S6 and CTD.
The VSL domain (residues 4545-4821) is so named, because it exhibits the voltage sensor fold but lacks the voltage-sensing elements such as the gating charges on S4 (Figs. 3f,g, Extended Data Fig. 8b). The sequences between S2 and S3 (residues 4663-4787) fold into the VSC domain, which comprises five helical segments, including the S2’ helix that is an extension of S2 into the cytoplasm, the S3’ helix that connects to S3 through a tight turn, and three short helices C1/2/3 in between (Fig. 3f, Extended Data Fig. 7). The four TM segments closely interact with each other to form a compact helical bundle (Fig. 3g).
Interactions of the RyR1 channel domain
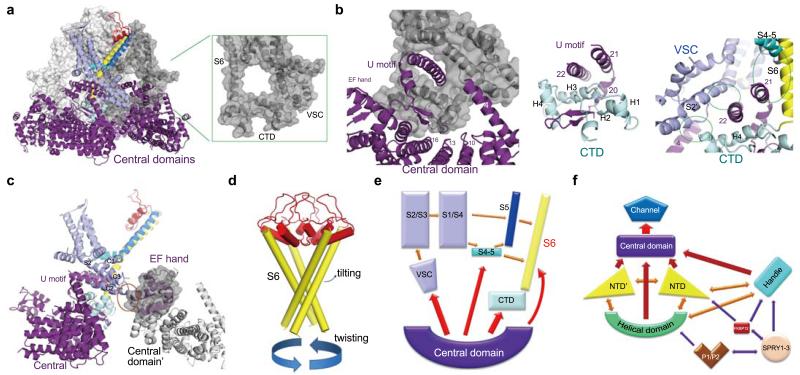
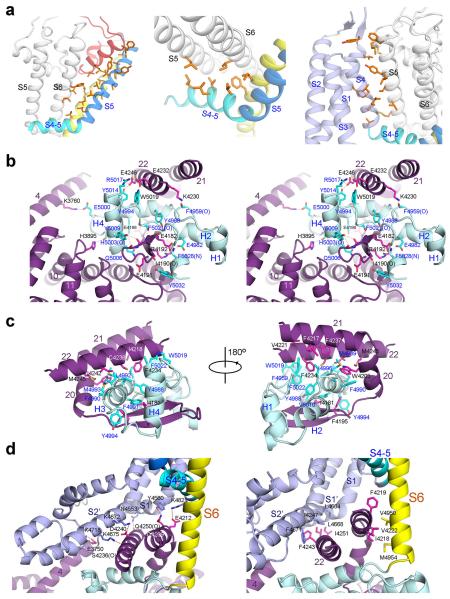
To understand the molecular mechanism of channel activation, we first examined the interactions between different segments of the channel domain and those between the channel domain and the cytoplasmic region (Figs. 4a-c, Extended Data Fig. 10). Within the same RyR1 protomer, several interfaces, including that between S5 and S6, between the S4-5 linker and the pore domain, and between VSL and the pore domain, may contribute to allosteric regulation of channel opening. These interactions, involving predominantly van der Waals contacts (Extended Data Fig. 10a), provide the adaptability to propagate conformational changes within the channel domain.
Figure 4. The intra- and inter-domain contacts of the RyR1 channel domain may contribute to channel gating.
a, VSC and CTD mediate the interactions between the channel domain and the Central domain in the cytoplasmic region of RyR1. Shown in the inset is a circle formed by the cytoplasmic fragment of S6, CTD, and VSC that provides the primary accommodation site for the Central domain. Only one protomer is domain-colored, and the other three protomers are shown in light to dark grey in semi-transparent surface view. b, Analysis of the interactions between the channel domain and the Central domain. The green circles in the right panel indicate the interfaces between the Central domain and the channel domain. Detailed interactions can be found in Extended Data Fig. 10. c, The EF-hand sub-domain in the Central domain contacts VSC and may provide the molecular basis for Ca2+-mediated modulation of RyR1. A semi-transparent surface is shown for the EF-hand sub-domain. The potential interface is highlighted by the orange circle. d, Putative conformational changes of the S6 segments may result in the opening of the activation gate. e, A cartoon diagram to illustrate the actions from the surrounding domains and structural segments that may lead to conformational changes of S6. f, A cartoon illustration of the complex interactions among the different domains of RyR1. Each arrow denotes two mutually interacting domains. Single-headed arrows indicate the directions of allosteric changes, whereas double-headed arrows suggest two-way flow of conformational changes.
In addition to the interactions within the lipid bilayer, VSC and CTD from the same protomer also contact each other. Therefore, conformational shifts of VSC may be directly transmitted to S6 through CTDs (Fig. 4a). CTDs, VSCs, and the cytoplasmic portion of S6 provide the primary docking site for the Central domains. Each U-motif in the Central domain is hooked into a ring structure formed by CTD, VSC, and S6 (Figs. 4a, 4b), involving extensive hydrophobic and polar contacts (Extended Data Figs. 10b-d). The concave surface of the armadillo repeats of the Central domain also interacts with CTD to further strengthen the interface between the channel domain and the cytoplasmic region (Fig. 4b). This extensive interface may serve as the primary transmitter for conformational changes from the cytoplasmic domain to the channel domain. Notably, the EF-hand subdomain in the adjacent Central domain contacts the tip of VSC (Fig. 4c), which may provide an important mechanism for Ca2+ ions to modulate the conductance of RyRs42.
Discussion
The near-atomic resolution structure of the rabbit RyR1 provides an unprecedented opportunity for examination of the structural organization as well as the functional and regulatory mechanisms of high-conductance Ca2+ channels. The RyR1 structure is captured in a closed state with the four elongated S6 segments constricted at the inner activation gate, whereas the SF vestibule appears in a conductive conformation (Fig. 3b-d). The activation of RyRs requires opening of the activation gate. The most intuitive activation model may simply entail twisting of the S6 bundle (Fig. 4d).
S6 is connected to CTD through a potentially rigid ZF joint. Change of the CTD position may lead to the relaxation of the activation gate. The CTD and VSC participate in extensive interactions with the Central domains from the cytoplasmic region (Fig. 4b). Conformational shifts of the Central domains likely impinge upon CTD and VSC simultaneously, whose consequent conformational changes may then be relayed to the TMs in VSL as well as the pore forming elements, resulting in conductance change (Fig. 4e).
In the hierarchical organization of the RyR1 tetramer, the Central domain likely serves as the central transmitter of conformational changes. The two extended superhelical assemblies in the cytoplasmic region and the intricate interaction network among the cytoplasmic domains provide the molecular platform to propagate any conformational changes induced by modulator binding to the Central domain (Figs. 2, 4f).
The mechanisms of channel opening await further characterizations. Nevertheless, the analyses reported here reveal a molecular scaffold that allows long-range allosteric regulation of the activation gate. The near atomic resolution cryo-EM structure of the rabbit RyR1 serves as a framework for interpretation of a wealth of experimental observations over the last four decades and for understanding the function and disease mechanisms of RyRs.
Methods
Preparation of enriched skeletal SR fraction
To reduce the duration for protein purification, we modified the published protocols for the preparation of the enriched skeletal SR fraction from New Zealand white rabbits44. Briefly, fresh skeletal muscles from rabbit legs were homogenized in the buffer containing 0.3 M sucrose, 10 mM MOPS-Na, pH 7.4, 0.5 mM EDTA, and protease inhibitors including 2 mM PMSF, 2.6 μg/ml aprotinin, 1.4 μg/ml pepstatin, and 10 μg/ml leupeptin. The homogenates were centrifuged at 6000 g (low speed) for 6 minutes to remove debris. The supernatant was then centrifuged at 200,000g for 1 hour. The pellet containing enriched SR fraction was collected and frozen at −80°C for storage.
Expression and purification of rabbit FKBP12
The glutathione-S-transferase (GST) fused FKBP12 protein was expressed and purified as reported previously45. The cDNA of FKBP12 from New Zealand white rabbit was inserted into the pGEX-4T-2 vector (Novagen). Overexpression of GST-FKBP12 was induced in E. coli BL21(DE3) with 0.2 mM isopropyl-β-D-thiogalactoside (IPTG) when the cell density reached an OD600 of 1.2. After growth for 6 hours at 37 °C, the cells were harvested, re-suspended in the buffer containing 25 mM Tris-HCl pH 8.0, and 150 mM NaCl, and disrupted by sonication. Cell debris was removed by centrifugation at 27,000g for 45 min. The supernatant was applied to glutathione Sepharose 4B resin (GS4B, GE Healthcare), which was subsequently washed for three times, each with the buffer containing 25 mM Tris-HCl pH 8.0, 150 mM NaCl, and 2 mM DTT (Sigma). The protein, eluted from the affinity resin with wash buffer plus 10 mM glutathione, was further purified through anion-exchange column (Source 15Q, GE Healthcare) to remove reduced glutathione. The peak fractions were pooled for further use.
Pull-down of RyR1 by GST-FKBP12
The RyR1 bound to GST-FKBP12 was purified on the basis of the described protocols3,48,49 with considerable modifications. The enriched SR fraction was solubilized at 4°C for 1 hour in the buffer containing 20 mM MOPS-Na, pH 7.4, 1 M NaCl, 2 mM DTT, 2 mM EDTA, 5% CHAPS, 2.5% (w/v) soybean phospholipids (Calbiochem), and protease inhibitors. During this process, GST-FKBP12 was added in excess. After ultra-centrifugation at 200,000 g for 25 minutes, the supernatant was collected and incubated with GS4B resin at 4°C for 2 hours. The protein-loaded resin was washed with 20 mM MOPS-Na, pH 7.4, 500 mM NaCl, 2 mM DTT, 2 mM EGTA, 0.015% Tween20, and protease inhibitors. The target protein complex was eluted by the buffer containing 13 mM reduced glutathione, 80mM Tris-HCl, pH 8.0, 2 mM DTT, 2 mM EGTA, 0.015% Tween20, and protease inhibitors. Then the target protein complex was further purified through Mono S 5/50 GL (GE Healthcare). The fraction containing target protein complex was concentrated and applied to size exclusion chromatography (Superdex-200, 10/30, GE Healthcare) in the buffer containing 20 mM MOPS-Na, pH 7.4, 250 mM NaCl, 2 mM DTT, 2 mM EGTA, 0.015% Tween20, and protease inhibitors. The fractions containing RyR1-FKBP12 complex were pooled for EM analysis.
Electron microscopy
Aliquots of 3 μl of purified RYR1 at a concentration of approximately 30 nM were placed on glow-discharged holey carbon grids (Quantifoil CuR2/2), on which a home-made continuous carbon film (estimated to be ~30 Å thick) had previously been deposited. Grids were blotted for 2 s and flash frozen in liquid ethane using an FEI Vitrobot. Grids were transferred to an FEI Tecnai Polara electron microscope that was operating at 300 kV. Images were recorded manually using an FEI Falcon-II detector at a calibrated magnification of 104,478, yielding a pixel size of 1.34 Å. A dose rate of 20 electrons per Å2 per second, and an exposure time of 2 s were used on the Falcon.
Image processing
The 34 frames of each video were aligned using whole-image motion correction 27. We used the particles picking tool in the RELION for automated selection of 245,850 particles from 1,500 micrographs. Contrast transfer function parameters were estimated using CTFFIND346. All two and three-dimensional classifications and refinements were performed using RELION25. We used reference-free two-dimensional class averaging and three-dimensional classification to discard bad particles, and selected 154,394 particles, for a first three-dimensional refinement. A 60 Å low-pass filtered cryo-EM reconstruction of RYR1 (EMDB-1606)23 was used as an initial model for the 3D refinement. In a subsequent three-dimensional classification run with four classes, an angular sampling of 0.9° was combined with local angular searches around the refined orientations, and the refined model from the first refinement was used as a starting model. This yielded a subset of 65,872 particles.
Particle based beam-induced movement correction was performed using statistical movie processing in RELION. For these calculations, we used running averages of seven movie frames, and a standard deviation of one pixel for the translational alignment. To further increase the accuracy of the per-particle movement correction, we used RELION-1.3 to fit linear tracks through the optimal translations for all running averages, and included neighboring particles on the micrograph in these fits. In addition, we employed a resolution and dose-dependent model for the radiation damage, where each frame is weighted with a different B-factor (temperature factor) as estimated from single-frame reconstructions47. Reported resolutions are based on the gold-standard FSC 0.143 criterion, and FSC curves were corrected for the effects of a soft mask on the FSC curve using high-resolution noise substitution48. Prior to visualization, all density maps were corrected for the modulation transfer function (MTF) of the detector, and then sharpened by applying a negative B-factor that was estimated using automated procedures49. Local resolution variations were estimated using ResMap50.
Model building
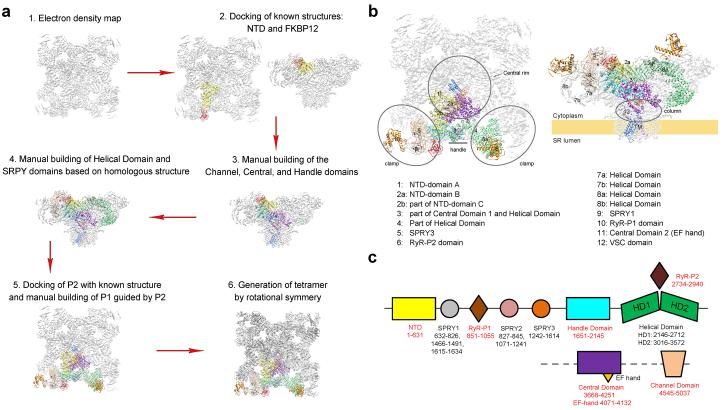
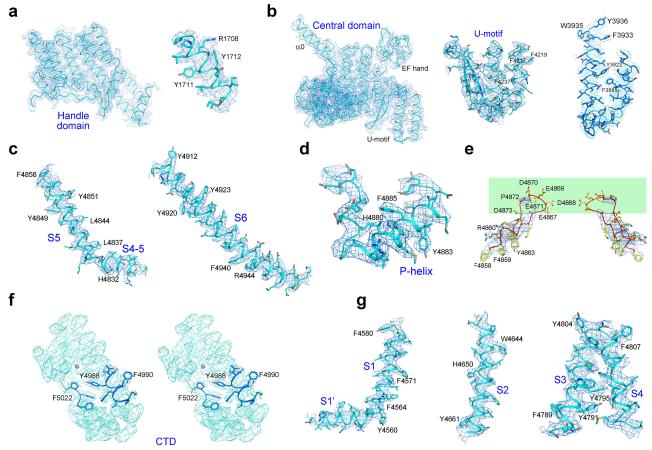
Because of the uneven distribution of resolution, we combined de novo building and homologous structure docking to generate the structural model of RyR1. A simplified diagram of the procedure for model building is presented in Extended Data Fig. 2. The resolution and quality of electron density allows de novo generation of atomic models for the following regions, the C-terminal helices of NTD (residues 560-639), the Handle domain (residues 1651-2145), the N-terminal helices of the HD1 domain (residues 2146-2460), the Central Domain (residues 3668-4251), and the channel domain (residues 4545-5037). The atomic model was built in COOT51. The chemical properties of proteins and amino acids were considered to facilitate initial model building. For instance, the hydrophobic residues in the channel domain likely favor the interface between the transmembrane segments and lipids. Sequence assignment was guided mainly by bulky residues such as Phe, Tyr, Trp, and Arg. Unique patterns of sequences were exploited for validation of residue assignment. The backbone of a large portion of the HD1 and HD2 domains can be traced, therefore poly-Ala residues were built.
The crystal structures of the N-terminal domain (residues 1-559) 28 and FKBP1252, with respective PDB accession codes 4JKQ and 2PPN, were docked into the corresponding density maps. The EM density at the tip of each RyR1 protomer is of relatively low resolution, but displays a characteristic V-shape, which is reminiscent of the overall structure of the phosphorylation hotspot domain (residues 2734-2940, also known as the RyR domain)53-55. Unfortunately, sequence analysis is against docking of the phosphorylation domain structure into this V-shaped EM density.
In the previously reported low-resolution EM maps23,56, the cytoplasmic domain contains a few solvent-filled holes enclosed by a structural feature named “clamp”57. The Helical domain accounts for half of the clamp (Extended Data Fig. 2b). Three SPRY domains (residues 640-1634) were identified and assigned to the other half of the clamp. Sequence alignments provide useful information for the domain identification and model building of the SPRY domains. The initial structural model for the three SPRY domains were generated on the basis of the homologous structure Ash2L (PDB code: 3TOJ)58. After structural docking, manual adjustment was performed to correct the polypeptide connections. Most of the side chains were able to be assigned for the three SPRY domains. Notably, the SPRY sequences are interrupted by residues 851-1055 that occupy the V-shaped EM density at the tip of each protomer and hence named the P1 domain. Consequently, the structurally homologous phosphorylation hotspot domain is referred to as the P2 domain (residues 2734-2940, PDB session code: 4ERT), which was assigned to a V-shaped density on the convex side of the Helical domain. A homology model for P1 domain was generated on the basis of the structure of P2 domain, and is docked into the density with further manual adjustment.
Structure refinement
Initial structure refinement was carried out by PHENIX in real space59,60 with secondary structure and geometry restraint. To accelerate refinement, the EM map was transformed from P1 to P4 space group according the symmetry of tetrameric RyR1 by MAPMAN61. A reciprocal space refinement was carried out in REFMAC62,63 with stereo-chemical and homology restraints, using the modified versions of the program for cryo-EM maps. To prevent overfitting, the optimal weight for refinement in REFMAC were determined by cross-validation as recently described64.
Extended Data
Extended Data Figure 1. Purification and electron cryo-microscopic (cryo-EM) analysis of the rabbit RyR1 complex bound to the modulator FKBP12.
a, The final step of purification of the rabbit RyR1 bound to FKBP12. Shown here are size exclusion chromatogram of the RyR1-FKBP12 complex (left panel) and a SDS-PAGE gel of the peak fractions visualized by Coomassie blue staining (right panel). The shaded fractions in the left panel were pooled for cryo-EM analysis. b, A representative electron micrograph of the rabbit RyR1-FKBP12 complex. The scale bar represents 20 nm. c, 2D class averages of the electron micrographs. d, Gold-standard FSC curves for the density maps. The overall resolution is estimated at 3.8 Å. e, Tilt-pair validation of the correctness of the map. Particles of RYR1 were imaged twice at 0° and 20° tilt angles. The position of each dot represents the direction and the amount of tilting for a particle pair in polar coordinates. Blue and red dots correspond to in-plane and out-of-plane tilt transformations, respectively. Most of the blue dots cluster at a tilt angle of approximately 20°, which validates the structure. f, Angular distribution for the final reconstruction. Each sphere represents one view and the size of the sphere is proportional to the number of particles for that view. The azimuth angle only spans 90°because of the 4-fold symmetry axis that runs from top to bottom. g, FSC curves between the model and the cryo-EM map. Shown here are the FSC curves between the final refined atomic model and the reconstruction from all particles (black), between the model refined in the reconstruction from only half of the particles and the reconstruction from that same half (FSCwork, green), and between that same model and the reconstruction from the other half of the particles (FSCtest, red). h, The overall EM density map of the RyR1-FKBP12 is color-coded to indicate a range of resolutions. Much of the central region of RyR1 is resolved at resolutions better than the overall 3.8 Å, while the periphery of the structure is of much lower resolution. i, EM density map for the channel domain of the rabbit RyR1.Two perpendicular views are shown. The EM density maps were generated in Chimera65.
Extended Data Figure 2. An illustration of the model building procedures for the RyR1-FKBP12 complex into the EM density map.
a, The step-by-step procedures for the generation of the overall structural model and domain assignment. Detailed descriptions can be found in Methods. b, Correlation between the previously assigned sub-regions21,22 and the corresponding domains in our 3.8 Å structure. c, The boundaries of the identified domains in the current structure of RyR1. NTD: amino-terminal domain; SPRY: a domain originally identified in SplA kinase and RyRs; HD: Helical domain. The P2 domain is a phosphorylation hotspot in RyRs. P1 shares homology with P2. The numbers below the domains indicate their sequence boundaries. Those labelled red were identified on the basis of well-defined EM density maps. It is of particular note that the SPRY1/2/3 and P1 domains are intertwined in primary sequences. It is of particular note that the three SPRY domains appear to be intertwined. Refer to Extended Data Fig. 6b for the following structural descriptions. Each SPRY domain consists mainly of a β-sandwich. In addition to the core β-sandwich (residues 639-826), SPRY1 also contains two pairs of anti-parallel β-strands (residues 1466-1491 colored brown and 1615-1634 colored magenta), whose primary sequences are connected to those of SPRY3. Similarly, SPRY2 contains a pair of anti-parallel β-strands (residues 827-845, colored silver) from SPRY1. The sequences of SPRY2 are also interrupted by those of the P1 domain. Consequently, the amino- and the carboxyl-termini of the SPRY1-3 region (residues 639 and 1634) are both contained within the SPRY1 structure.
Extended Data Figure 3. EM density maps for the domains whose atomic structural models were generated de novo.
a, The EM density maps for the Handle domain. Representative EM density map for one helix in the Handle domain is shown on the right. b, The EM density maps for the Central domain. Left to right: The EM density maps for the overall domain, the U-motif, and one representative helical repeat in the Central domain, respectively. c-g, The EM density maps for the segments in the channel domain. Shown here are the density maps for the pore forming elements (c), the selectivity filter (d), the luminal hairpin loop (e), the carboxyl terminal domain shown in stereo views (f), and the voltage sensor-like domain (g). The maps, shown as blue mesh, are contoured at 4σ and made in PyMol. Representative bulky residues which were used to aid sequence assignment are shown as sticks and labeled.
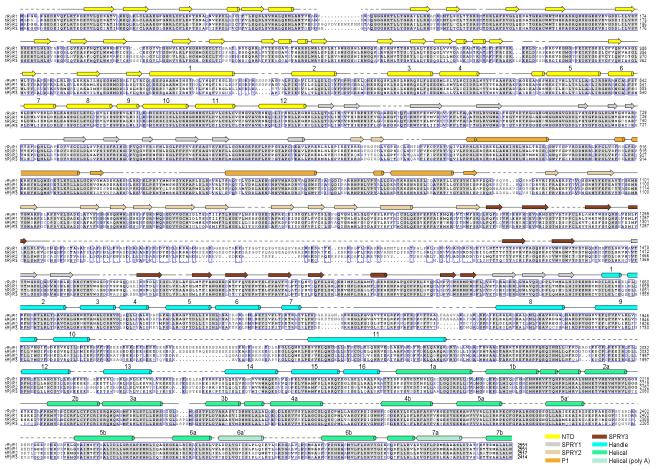
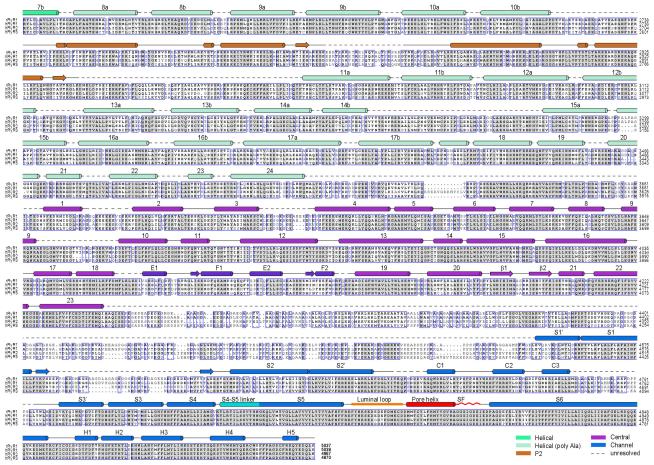
Extended Data 4. Sequence alignment of RyR orthologues.
Secondary structural elements are indicated above the sequence alignment and domains are colored the same as the structures shown in the main text figures. The numbering of the secondary elements refers to their sequential positions within the corresponding domains. Invariant amino acids are shaded light grey. The GI codes for the sequences from top to bottom: rabbit RyR1 (156119408), human RyR1 (113204615), human RyR2 (308153558), and human RyR3 (325511382).
Extended Data 5. Continued sequence alignment of RyR orthologues.
Due to the enormous size of the proteins, the sequence alignment was divided into two figures with an overlap at the helix 7b from the Helical domain. Notably, it was predicted that a number of EF-hand domains may exist between residues 4252 and 45454. The lack of EM density for these domains may indicate their intrinsic flexibility in the absence of Ca2+. The structure and mechanism of these putative EF-hand domains await further investigation.
Extended Data Figure 6. Organization of the cytoplasmic domains of RyR1.
a, The NTD (yellow) participates in tetramerization. Compared to the previously reported crystal structure of NTD28, five additional α-helices (residues 560-631, colored orange) were identified in the EM structure. b, The structure of the SPRY1-3 domains. Refer to Extended Data Fig. 2c for the sequence assignment of the three intertwined domains. Note that the amino-terminus of SPRY1 is preceded by the NTD and its carboxyl-terminus (magenta) is followed by the Handle domain (cyan). c, Structure of the Handle domain. The disordered sequences are indicated by dashed lines. d, The Helical domain comprises two discontinuous sequence fragments, HD1 and HD2, which are disrupted by the P2 domain. e, The helical repeats in subdomain C of the NTD resemble the armadillo repeats. Shown here is a superposition with a designed armadillo protein (PDB code: 4DB8). f, Structural superposition of the Handle domain with β-catenin (PDB code: 3IFQ) suggests that five pairs of helices, 1/2, 4/5, 8/9, 10/11, and 14/15, in the Handle domain exhibit structural homology to the armadillo repeats. g, The helical repeats in the Central domain are armadillo-like repeats. Shown here is the superposition of the Central domain with the armadillo repeats of the anaphase promoting complex (PDB code: 3NMW). h, The armadillo-like repeats in NTD, Handle, Central domains are joined end-to-end to form a superhelical assembly. The appearance of the superhelical assembly resembles a question mark. i, Each Central domain directly interacts with two adjacent NTDs. The convex side of the helical repeats is involved in binding to the NTDs. Two close-up views are shown to highlight key residues that may form hydrogen bonds at the interfaces. j, The NTDs, Central, Handle, and Helical domains form multiple interfaces. Shown here are two adjacent NTDs (NTD and NTD’), one Central domain, one handle Domain, and the N-terminal fragment of the Helical domain. k, SPRY2 bridges the spatial gap between the Handle domain and HD2 from the adjacent protomer. l, FKBP12 is bound in a cleft formed by the Handle, NTD, and SPRY1/3 domains. m, An extended hydrophobic loop from the Handle domain reaches into the ligand-binding pocket of FKBP12. A close-up view is shown to illustrate the residues that may mediate the interactions.
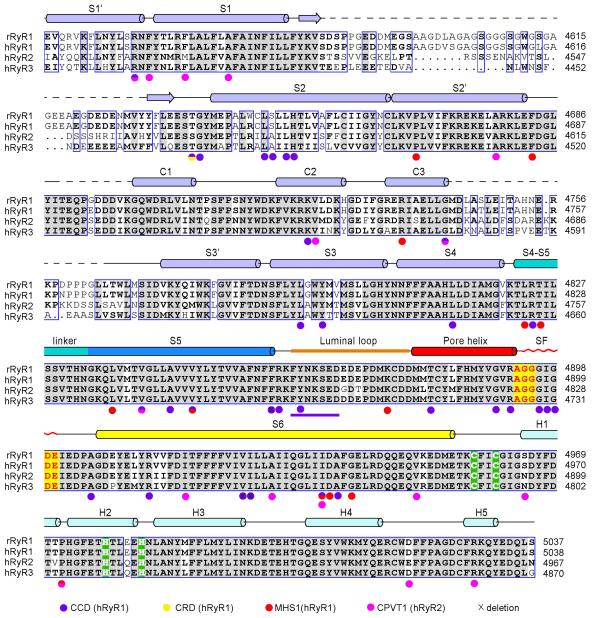
Extended Data Figure 7. Alignment of the channel domain sequences of RyR orthologues.
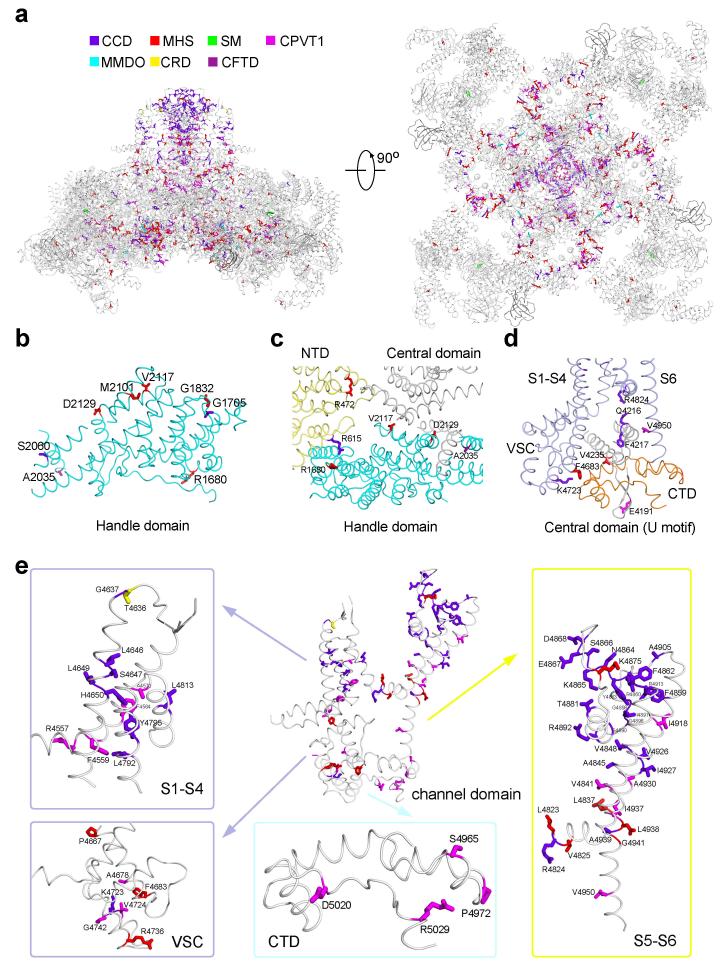
Secondary structural elements are indicated above the sequence alignment. Invariant amino acids are shaded in grey. The residues that may constitute potential cation binding sites are cored red. The C2H2 zinc finger motif is highlighted with green background. The residues whose mutations or deletions have been identified in patients are indicated with colored circles below the sequences. The color code is annotated at the bottom. CCD: central core disease; CRD: core/rod disease; MHS: malignant hyperthermia susceptibility; CPVT1: catecholaminergic polymorphic ventricular tachycardia type 1.
Extended Data Figure 8. Structural comparison of the RyR1 channel domain with representative tetrameric cation channels of known structures.
a, Structural comparison of the pore forming elements from different tetrameric cation channels of known structures. Two diagonal protomers are shown. In all the structures, the S5 and S6 segments are colored grey. In the structures of CavAb and KcsA, the bound ions are shown as spheres. PDB accession codes: 4MW3 for CavAb, 3J5Q for TRPV1, and 1BL8 for KcsA. b, Structural comparison of the transmembrane region of RyR1-VSL to the VSDs or like domains in the indicated tetrameric ion channels. Note that a hydrophilic sequence between S1 and S2 (residues 4579-4639) exhibits poor EM density and constitutes the least conserved DR1 region (DR for “divergent”) in the RyR1 channel domain11 (Extended Data Fig. 7). The ordered segments within this sequence form a pair of short anti-parallel β-strands that extends into the SR lumen. PDB accession codes: 2R9R for the Kv1.2/Kv2.1 paddle chimera, 4DXW for NavRh, and 3J5P for TRPV1.
Extended Data Figure 9. Mapping of the disease-associated point mutations onto the structure of the RyR1 channel domain.
a, The residues that are targeted for disease-derived mutations are highlighted by different colors: purple blue for CCD (central core disease), red for MHS (malignant hyperthermia susceptibility), green for SM (samaritan myopathy), cyan for MMDO (minicore myopathy with ophthalmoplegia), yellow for CRD (core/rod disease), dark purple for CFTD (congenital fiber type disproportion), and magenta for CPVT1 (catecholaminergic polymorphic ventricular tachycardia type 1). Please refer to the Supplementary Table 1 for details of these mutations. b, Disease-related mutations in the Handle domain. The concerned residues, which are positioned on the surface of the Handle domain, may be involved in the interaction with modulators or other domains within RyR1. c, Disease-related residues aligning the inter-domain interface between NTD, the Handle and Central domains. d, Representative disease-related residues involved in the interaction between the Central domain and the channel domain. e, The channel domain represents a hotspot for mutations associated with a number of diseases. Please refer to Extended Data Fig. 7 and Supplementary Table 1 for details of the mutations.
Extended Data Figure 10. Intra- and inter-domain interactions that may be important for the long-range allosteric regulation of channel gating.
a, Extensive van der Waals interactions exist between the pore-forming segments, and between the VSL of one protomer and S6 of adjacent protomer. These extensive interactions may aid the coupling of conformational changes within the channel domain. One protomer is color coded, whereas the adjacent one is colored silver. b, A stereo view of the polar interaction network between the Central domain and CTD. Potential H-bonds are shown as red dashed lines. c, The van der Waals contacts between the U-motif of the Central domain and the CTD. Two opposite views are shown. d, Interactions between the Central domain and the VSL. Polar and van der Waals contacts are shown on the left and right, respectively.
Supplementary Material
Supplementary Video 1 | Overall structure and domain organization of the RyR1-FKBP12 complex. The animation illustrates the EM density map, the overall structure, and the domain organization of the rabbit RyR1 in complex with FKBP12.
ACKNOWLEDGMENTS
This work was supported by funds from the Ministry of Science and Technology of China (2015CB910101, 2011CB910501, 2014ZX09507003006), National Natural Science Foundation of China (projects 31321062, 31130002 and 31125009), a European Union Marie Curie Fellowship (to XB), and the UK Medical Research Council (MC_UP_A025_1013, to SHWS). The research of Nieng Yan was supported in part by an International Early Career Scientist grant from the Howard Hughes Medical Institute and an endowed professorship from Bayer Healthcare.
Footnotes
Author Information The atomic coordinates of RyR1-FKBP12 complex have been deposited in the Protein Data Bank with the accession code 3J8H. The 3.8 Å EM map has been deposited in EMDB with accession codes EMD-2807.
The authors declare no competing financial interests.
Readers are welcome to comment on the online version of the paper.
References
- 1.Pessah IN, Waterhouse AL, Casida JE. The calcium-ryanodine receptor complex of skeletal and cardiac muscle. Biochem Biophys Res Commun. 1985;128:449–56. doi: 10.1016/0006-291x(85)91699-7. [DOI] [PubMed] [Google Scholar]
- 2.Inui M, Saito A, Fleischer S. Purification of the ryanodine receptor and identity with feet structures of junctional terminal cisternae of sarcoplasmic reticulum from fast skeletal muscle. J Biol Chem. 1987;262:1740–7. [PubMed] [Google Scholar]
- 3.Lai FA, Erickson HP, Rousseau E, Liu QY, Meissner G. Purification and reconstitution of the calcium release channel from skeletal muscle. Nature. 1988;331:315–9. doi: 10.1038/331315a0. [DOI] [PubMed] [Google Scholar]
- 4.Takeshima H, et al. Primary structure and expression from complementary DNA of skeletal muscle ryanodine receptor. Nature. 1989;339:439–45. doi: 10.1038/339439a0. [DOI] [PubMed] [Google Scholar]
- 5.Rossi D, Sorrentino V. Molecular genetics of ryanodine receptors Ca2+-release channels. Cell Calcium. 2002;32:307–19. doi: 10.1016/s0143416002001987. [DOI] [PubMed] [Google Scholar]
- 6.Seo MD, et al. Structural and functional conservation of key domains in InsP3 and ryanodine receptors. Nature. 2012;483:108–12. doi: 10.1038/nature10751. [DOI] [PMC free article] [PubMed] [Google Scholar]
- 7.Mignery GA, Sudhof TC, Takei K, De Camilli P. Putative receptor for inositol 1,4,5-trisphosphate similar to ryanodine receptor. Nature. 1989;342:192–5. doi: 10.1038/342192a0. [DOI] [PubMed] [Google Scholar]
- 8.Bhat MB, Zhao J, Takeshima H, Ma J. Functional calcium release channel formed by the carboxyl-terminal portion of ryanodine receptor. Biophys J. 1997;73:1329–36. doi: 10.1016/S0006-3495(97)78166-9. [DOI] [PMC free article] [PubMed] [Google Scholar]
- 9.Lanner JT, Georgiou DK, Joshi AD, Hamilton SL. Ryanodine receptors: structure, expression, molecular details, and function in calcium release. Cold Spring Harb Perspect Biol. 2010;2:a003996. doi: 10.1101/cshperspect.a003996. [DOI] [PMC free article] [PubMed] [Google Scholar]
- 10.Meissner G. Ryanodine receptor/Ca2+ release channels and their regulation by endogenous effectors. Annu Rev Physiol. 1994;56:485–508. doi: 10.1146/annurev.ph.56.030194.002413. [DOI] [PubMed] [Google Scholar]
- 11.Van Petegem F. Ryanodine Receptors: Allosteric Ion Channel Giants. J Mol Biol. 2014 doi: 10.1016/j.jmb.2014.08.004. [DOI] [PubMed] [Google Scholar]
- 12.Endo M, Tanaka M, Ogawa Y. Calcium induced release of calcium from the sarcoplasmic reticulum of skinned skeletal muscle fibres. Nature. 1970;228:34–6. doi: 10.1038/228034a0. [DOI] [PubMed] [Google Scholar]
- 13.Fabiato A. Calcium-induced release of calcium from the cardiac sarcoplasmic reticulum. Am J Physiol. 1983;245:C1–14. doi: 10.1152/ajpcell.1983.245.1.C1. [DOI] [PubMed] [Google Scholar]
- 14.Bezprozvanny I, Watras J, Ehrlich BE. Bell-shaped calcium-response curves of Ins(1,4,5)P3- and calcium-gated channels from endoplasmic reticulum of cerebellum. Nature. 1991;351:751–4. doi: 10.1038/351751a0. [DOI] [PubMed] [Google Scholar]
- 15.Smith JS, Coronado R, Meissner G. Single channel measurements of the calcium release channel from skeletal muscle sarcoplasmic reticulum. Activation by Ca2+ and ATP and modulation by Mg2+ J Gen Physiol. 1986;88:573–88. doi: 10.1085/jgp.88.5.573. [DOI] [PMC free article] [PubMed] [Google Scholar]
- 16.Rios E, Brum G. Involvement of dihydropyridine receptors in excitation-contraction coupling in skeletal muscle. Nature. 1987;325:717–20. doi: 10.1038/325717a0. [DOI] [PubMed] [Google Scholar]
- 17.Block BA, Imagawa T, Campbell KP, Franzini-Armstrong C. Structural evidence for direct interaction between the molecular components of the transverse tubule/sarcoplasmic reticulum junction in skeletal muscle. J Cell Biol. 1988;107:2587–600. doi: 10.1083/jcb.107.6.2587. [DOI] [PMC free article] [PubMed] [Google Scholar]
- 18.MacMillan D. FK506 binding proteins: Cellular regulators of intracellular Ca2+ signalling. Eur J Pharmacol. 2013;700:181–193. doi: 10.1016/j.ejphar.2012.12.029. [DOI] [PubMed] [Google Scholar]
- 19.Radermacher M, et al. Cryo-EM of the native structure of the calcium release channel/ryanodine receptor from sarcoplasmic reticulum. Biophys J. 1992;61:936–40. doi: 10.1016/S0006-3495(92)81900-8. [DOI] [PMC free article] [PubMed] [Google Scholar]
- 20.Radermacher M, et al. Cryo-electron microscopy and three-dimensional reconstruction of the calcium release channel/ryanodine receptor from skeletal muscle. J Cell Biol. 1994;127:411–23. doi: 10.1083/jcb.127.2.411. [DOI] [PMC free article] [PubMed] [Google Scholar]
- 21.Samso M, Wagenknecht T, Allen PD. Internal structure and visualization of transmembrane domains of the RyR1 calcium release channel by cryo-EM. Nat Struct Mol Biol. 2005;12:539–44. doi: 10.1038/nsmb938. [DOI] [PMC free article] [PubMed] [Google Scholar]
- 22.Serysheva II, et al. Subnanometer-resolution electron cryomicroscopy-based domain models for the cytoplasmic region of skeletal muscle RyR channel. Proc Natl Acad Sci U S A. 2008;105:9610–5. doi: 10.1073/pnas.0803189105. [DOI] [PMC free article] [PubMed] [Google Scholar]
- 23.Samso M, Feng W, Pessah IN, Allen PD. Coordinated movement of cytoplasmic and transmembrane domains of RyR1 upon gating. PLoS Biol. 2009;7:e85. doi: 10.1371/journal.pbio.1000085. [DOI] [PMC free article] [PubMed] [Google Scholar]
- 24.Franzini-Armstrong C. STUDIES OF THE TRIAD: I. Structure of the Junction in Frog Twitch Fibers. J Cell Biol. 1970;47:488–99. doi: 10.1083/jcb.47.2.488. [DOI] [PMC free article] [PubMed] [Google Scholar]
- 25.Scheres SHW. RELION: Implementation of a Bayesian approach to cryo-EM structure determination. Journal Of Structural Biology. 2012;180:519–530. doi: 10.1016/j.jsb.2012.09.006. [DOI] [PMC free article] [PubMed] [Google Scholar]
- 26.Bai XC, Fernandez IS, McMullan G, Scheres SHW. Ribosome structures to near-atomic resolution from thirty thousand cryo-EM particles. Elife. 2013;2 doi: 10.7554/eLife.00461. [DOI] [PMC free article] [PubMed] [Google Scholar]
- 27.Li X, et al. Electron counting and beam-induced motion correction enable near-atomic-resolution single-particle cryo-EM. Nat Methods. 2013;10:584–90. doi: 10.1038/nmeth.2472. [DOI] [PMC free article] [PubMed] [Google Scholar]
- 28.Tung CC, Lobo PA, Kimlicka L, Van Petegem F. The amino-terminal disease hotspot of ryanodine receptors forms a cytoplasmic vestibule. Nature. 2010;468:585–8. doi: 10.1038/nature09471. [DOI] [PubMed] [Google Scholar]
- 29.Tewari R, Bailes E, Bunting KA, Coates JC. Armadillo-repeat protein functions: questions for little creatures. Trends Cell Biol. 2010;20:470–81. doi: 10.1016/j.tcb.2010.05.003. [DOI] [PubMed] [Google Scholar]
- 30.Xiong H, et al. Identification of a two EF-hand Ca2+ binding domain in lobster skeletal muscle ryanodine receptor/Ca2+ release channel. Biochemistry. 1998;37:4804–14. doi: 10.1021/bi971198b. [DOI] [PubMed] [Google Scholar]
- 31.Zhao M, et al. Molecular identification of the ryanodine receptor pore-forming segment. J Biol Chem. 1999;274:25971–4. doi: 10.1074/jbc.274.37.25971. [DOI] [PubMed] [Google Scholar]
- 32.Gao L, et al. Evidence for a role of the lumenal M3-M4 loop in skeletal muscle Ca(2+) release channel (ryanodine receptor) activity and conductance. Biophys J. 2000;79:828–40. doi: 10.1016/S0006-3495(00)76339-9. [DOI] [PMC free article] [PubMed] [Google Scholar]
- 33.Du GG, Guo X, Khanna VK, MacLennan DH. Functional characterization of mutants in the predicted pore region of the rabbit cardiac muscle Ca(2+) release channel (ryanodine receptor isoform 2) J Biol Chem. 2001;276:31760–71. doi: 10.1074/jbc.M102751200. [DOI] [PubMed] [Google Scholar]
- 34.Chen SR, Li P, Zhao M, Li X, Zhang L. Role of the proposed pore-forming segment of the Ca2+ release channel (ryanodine receptor) in ryanodine interaction. Biophys J. 2002;82:2436–47. doi: 10.1016/s0006-3495(02)75587-2. [DOI] [PMC free article] [PubMed] [Google Scholar]
- 35.Wang Y, Xu L, Pasek DA, Gillespie D, Meissner G. Probing the role of negatively charged amino acid residues in ion permeation of skeletal muscle ryanodine receptor. Biophys J. 2005;89:256–65. doi: 10.1529/biophysj.104.056002. [DOI] [PMC free article] [PubMed] [Google Scholar]
- 36.Cao E, Liao M, Cheng Y, Julius D. TRPV1 structures in distinct conformations reveal activation mechanisms. Nature. 2013;504:113–8. doi: 10.1038/nature12823. [DOI] [PMC free article] [PubMed] [Google Scholar]
- 37.Tang L, et al. Structural basis for Ca2+ selectivity of a voltage-gated calcium channel. Nature. 2014;505:56–61. doi: 10.1038/nature12775. [DOI] [PMC free article] [PubMed] [Google Scholar]
- 38.Palade P, Mitchell RD, Fleischer S. Spontaneous calcium release from sarcoplasmic reticulum. General description and effects of calcium. J Biol Chem. 1983;258:8098–107. [PubMed] [Google Scholar]
- 39.Jiang D, et al. RyR2 mutations linked to ventricular tachycardia and sudden death reduce the threshold for store-overload-induced Ca2+ release (SOICR) Proc Natl Acad Sci U S A. 2004;101:13062–7. doi: 10.1073/pnas.0402388101. [DOI] [PMC free article] [PubMed] [Google Scholar]
- 40.Smart OS, Goodfellow JM, Wallace BA. The pore dimensions of gramicidin A. Biophys J. 1993;65:2455–60. doi: 10.1016/S0006-3495(93)81293-1. [DOI] [PMC free article] [PubMed] [Google Scholar]
- 41.Xu L, Wang Y, Gillespie D, Meissner G. Two rings of negative charges in the cytosolic vestibule of type-1 ryanodine receptor modulate ion fluxes. Biophys J. 2006;90:443–53. doi: 10.1529/biophysj.105.072538. [DOI] [PMC free article] [PubMed] [Google Scholar]
- 42.Fessenden JD, Feng W, Pessah IN, Allen PD. Mutational analysis of putative calcium binding motifs within the skeletal ryanodine receptor isoform, RyR1. J Biol Chem. 2004;279:53028–35. doi: 10.1074/jbc.M411136200. [DOI] [PubMed] [Google Scholar]
- 43.DeLano WL. The PyMOL Molecular Graphics System. 2002 on World Wide Web http://www.pymol.org.
- 44.Chu A, Dixon MC, Saito A, Seiler S, Fleischer S. Isolation Of Sarcoplasmic-Reticulum Fractions Referable To Longitudinal Tubules And Junctional Terminal Cisternae From Rabbit Skeletal-Muscle. Methods In Enzymology. 1988;157:36–46. doi: 10.1016/0076-6879(88)57066-0. [DOI] [PubMed] [Google Scholar]
- 45.Wiederrecht G, et al. Characterization Of High-Molecular-Weight Fk-506 Binding Activities Reveals a Novel Fk-506-Binding Protein as Well as a Protein Complex. Journal Of Biological Chemistry. 1992;267:21753–21760. [PubMed] [Google Scholar]
- 46.Mindell JA, Grigorieff N. Accurate determination of local defocus and specimen tilt in electron microscopy. Journal Of Structural Biology. 2003;142:334–347. doi: 10.1016/s1047-8477(03)00069-8. [DOI] [PubMed] [Google Scholar]
- 47.Scheres SH. Beam-induced motion correction for sub-megadalton cryo-EM particles. Elife. 2014;3:e03665. doi: 10.7554/eLife.03665. [DOI] [PMC free article] [PubMed] [Google Scholar]
- 48.Chen S, et al. High-resolution noise substitution to measure overfitting and validate resolution in 3D structure determination by single particle electron cryomicroscopy. Ultramicroscopy. 2013;135:24–35. doi: 10.1016/j.ultramic.2013.06.004. [DOI] [PMC free article] [PubMed] [Google Scholar]
- 49.Rosenthal PB, Henderson R. Optimal determination of particle orientation, absolute hand, and contrast loss in single-particle electron cryomicroscopy. J Mol Biol. 2003;333:721–45. doi: 10.1016/j.jmb.2003.07.013. [DOI] [PubMed] [Google Scholar]
- 50.Kucukelbir A, Sigworth FJ, Tagare HD. Quantifying the local resolution of cryo-EMEM density maps. Nature Methods. 2014;11:63–+. doi: 10.1038/nmeth.2727. [DOI] [PMC free article] [PubMed] [Google Scholar]
- 51.Emsley P, Lohkamp B, Scott WG, Cowtan K. Features and development of Coot. Acta Crystallogr D Biol Crystallogr. 2010;66:486–501. doi: 10.1107/S0907444910007493. [DOI] [PMC free article] [PubMed] [Google Scholar]
- 52.Szep S, Park S, Boder ET, Van Duyne GD, Saven JG. Structural coupling between FKBP12 and buried water. Proteins. 2009;74:603–11. doi: 10.1002/prot.22176. [DOI] [PMC free article] [PubMed] [Google Scholar]
- 53.Zorzato F, et al. Molecular cloning of cDNA encoding human and rabbit forms of the Ca2+ release channel (ryanodine receptor) of skeletal muscle sarcoplasmic reticulum. J Biol Chem. 1990;265:2244–56. [PubMed] [Google Scholar]
- 54.Yuchi Z, Lau K, Van Petegem F. Disease mutations in the ryanodine receptor central region: crystal structures of a phosphorylation hot spot domain. Structure. 2012;20:1201–11. doi: 10.1016/j.str.2012.04.015. [DOI] [PubMed] [Google Scholar]
- 55.Sharma P, et al. Structural determination of the phosphorylation domain of the ryanodine receptor. FEBS J. 2012;279:3952–64. doi: 10.1111/j.1742-4658.2012.08755.x. [DOI] [PMC free article] [PubMed] [Google Scholar]
- 56.Ludtke SJ, Serysheva II, Hamilton SL, Chiu W. The pore structure of the closed RyR1 channel. Structure. 2005;13:1203–11. doi: 10.1016/j.str.2005.06.005. [DOI] [PMC free article] [PubMed] [Google Scholar]
- 57.Serysheva II, et al. Electron cryomicroscopy and angular reconstitution used to visualize the skeletal muscle calcium release channel. Nat Struct Biol. 1995;2:18–24. doi: 10.1038/nsb0195-18. [DOI] [PubMed] [Google Scholar]
- 58.Chen Y, Cao F, Wan B, Dou Y, Lei M. Structure of the SPRY domain of human Ash2L and its interactions with RbBP5 and DPY30. Cell Res. 2012;22:598–602. doi: 10.1038/cr.2012.9. [DOI] [PMC free article] [PubMed] [Google Scholar]
- 59.Adams PD, et al. PHENIX: a comprehensive Python-based system for macromolecular structure solution. Acta Crystallogr D Biol Crystallogr. 2010;66:213–21. doi: 10.1107/S0907444909052925. [DOI] [PMC free article] [PubMed] [Google Scholar]
- 60.Afonine PV, Headd JJ, Terwilliger TC, Adams PD. New tool:phenix.real_space_refine. Computational Crystallography Newsletter. 2013;4:43–44. [Google Scholar]
- 61.Kleywegt GJ, Jones TA. xdlMAPMAN and xdlDATAMAN - programs for reformatting, analysis and manipulation of biomacromolecular electron-density maps and reflection data sets. Acta Crystallogr D Biol Crystallogr. 1996;52:826–8. doi: 10.1107/S0907444995014983. [DOI] [PubMed] [Google Scholar]
- 62.Murshudov GN, et al. REFMAC5 for the refinement of macromolecular crystal structures. Acta Crystallogr D Biol Crystallogr. 2011;67:355–67. doi: 10.1107/S0907444911001314. [DOI] [PMC free article] [PubMed] [Google Scholar]
- 63.Amunts A, et al. Structure of the yeast mitochondrial large ribosomal subunit. Science. 2014;343:1485–9. doi: 10.1126/science.1249410. [DOI] [PMC free article] [PubMed] [Google Scholar]
- 64.Fernandez IS, Bai XC, Murshudov G, Scheres SH, Ramakrishnan V. Initiation of translation by cricket paralysis virus IRES requires its translocation in the ribosome. Cell. 2014;157:823–31. doi: 10.1016/j.cell.2014.04.015. [DOI] [PMC free article] [PubMed] [Google Scholar]
- 65.Pettersen EF, et al. UCSF Chimera--a visualization system for exploratory research and analysis. J Comput Chem. 2004;25:1605–12. doi: 10.1002/jcc.20084. [DOI] [PubMed] [Google Scholar]
Associated Data
This section collects any data citations, data availability statements, or supplementary materials included in this article.
Supplementary Materials
Supplementary Video 1 | Overall structure and domain organization of the RyR1-FKBP12 complex. The animation illustrates the EM density map, the overall structure, and the domain organization of the rabbit RyR1 in complex with FKBP12.


