

Abstract
In the healthy adult brain synapses are continuously remodelled through a process of elimination and formation known as structural plasticity1. Reduction in synapse number is a consistent early feature of neurodegenerative diseases2, 3, suggesting deficient compensatory mechanisms. While much is known about toxic processes leading to synaptic dysfunction and loss in these disorders2,3, how synaptic regeneration is affected is unknown. In hibernating mammals, cooling induces loss of synaptic contacts, which are reformed on rewarming, a form of structural plasticity4, 5. We have found that similar changes occur in artificially cooled laboratory rodents. Cooling and hibernation also induce a number cold-shock proteins in the brain, including the RNA binding protein, RBM36. The relationship of such proteins to structural plasticity is unknown. Here we show that synapse regeneration is impaired in mouse models of neurodegenerative disease, in association with the failure to induce RBM3. In both prion-infected and 5×FAD (Alzheimer-type) mice7, the capacity to regenerate synapses after cooling declined in parallel with the loss of induction of RBM3. Enhanced expression of RBM3 in the hippocampus prevented this deficit and restored the capacity for synapse reassembly after cooling. Further, RBM3 over-expression, achieved either by boosting endogenous levels through hypothermia prior to the loss of the RBM3 response, or by lentiviral delivery, resulted in sustained synaptic protection in 5×FAD mice and throughout the course of prion disease, preventing behavioural deficits and neuronal loss and significantly prolonging survival. In contrast, knockdown of RBM3 exacerbated synapse loss in both models and accelerated disease and prevented the neuroprotective effects of cooling. Thus, deficient synapse regeneration, mediated at least in part by failure of the RBM3 stress response, contributes to synapse loss throughout the course of neurodegenerative disease. The data support enhancing cold shock pathways as potential protective therapies in neurodegenerative disorders.
We used the phenomenon of physiological structural plasticity seen in hibernating mammals to determine the capacity for synapse regeneration in mouse models of neurodegenerative disease. When they enter torpor, the neurons of hibernators undergo morphological changes including changes in spine morphology8, 9 and/or changes in connectivity4, 5. These are rapidly reversed on regaining normal body temperature4, 5,8-10. We first established that the phenomenon of synapse dismantling and reassembly (structural plasticity) on artificial cooling and rewarming occurs in laboratory mice (Figure 1a and Extended Data Figure 1a). We then explored the capacity for structural plasticity after cooling in two mouse models of neurodegenerative disease: prion disease and the 5×FAD model of Alzheimer’s disease7. We used tg37+/− mice11 infected with Rocky Mountain Laboratory (RML) prions used in our previous studies12-14. These mice show substantial synapse loss from 7 weeks post inoculation (w.p.i.)13; 5×FAD mice have synapse loss from 4 months, after which learning deficits emerge7. We tested the capacity for structural plasticity using cooling early in the course of disease, before the onset of established synapse loss in both models: from 4 w.p.i. in prion-infected animals and from 2 months of age in 5×FAD mice.
Figure 1. The capacity for synaptic regeneration is lost early in neurodegenerative disease.

a) synapse numbers decline on cooling and recover on rewarming in wild type mice, counted in both 3D and 2D. Representative electron micrographs (pseudo-coloured for ease of synapse identification) and bar charts showing quantitation are shown for each experiment (n = 4 animals at 18°C and n = 2 at 37°C; 192 images from 2 mice per condition for 3D analyses; 93 images from 3 animals per condition, for 2D analyses). A typical tripartite synapse is shown at higher magnification. b) The same response is seen in prion diseased mice at 4 and 5 w.p.i. but this fails at 6 w.p.i (arrow), and in c) 5×FAD mice, where it fails at 3 months (arrow). ***p <0.0001, **p <0.01; *p <0.05; n.s. non significant. Student’s t-test; two tailed. All data in bar charts are mean ± s.e.m. Scale bar = 1μm. Source data for all figures can be found in the Supplementary tables.
All mice were cooled to 16-18°C for 45 minutes, similar to core temperatures reached in small hibernators (deep hypothermia) using the biomolecule 5′-adenosine monophosphate (5′-AMP)15, after which they were allowed to slowly rewarm. Animals were sacrificed at each stage of the cooling-rewarming process and synapses were counted in the CA1 region of hippocampus. Both synapse density and total synapse number significantly declined on cooling, but recovered on re-warming in wild type mice, as measured using both 3D16 and 2D analyses13 (Figure 1a). Neither brain volume nor synapse size changed on cooling and rewarming, excluding the possibility that changes in synapse density reflected changes in these parameters (Extended Data Figure 1a). Thus, wild type mice showed synaptic structural plasticity with reduction in synapse number on cooling and recovery on rewarming (Figure 1a). This capacity for plasticity was also seen in both prion-infected and 5×FAD mice very early in the course of disease, at 4 and 5 w.p.i., and at 2 months of age, respectively (Figure 1b and c). However, this capacity was lost by 6 w.p.i in prion-diseased mice (Figure 1b and Extended Data Figure 1b) and at 3 months in 5×FAD mice (Figure 1c and Extended Data Figure 1c). Notably, impaired structural plasticity shortly preceded established decline in synapse number seen in prion-infected tg37+/− mice at 7 w.p.i.14, and in the 5×FAD mice from 4 months of age (see schematic, Extended Data Figure 1d). The lost ability to reassemble synapses was not due to loss of synaptic proteins at this stage (Extended Data Figure 2) nor to increased levels of disease-specific misfolded prion protein (PrPSc) in prion-infected mice, or of amyloid-beta (Aβ) oligomers in 5×FAD mice induced by the cooling-rewarming process (Extended Data Figure 3).
In hibernation and hypothermia, global protein synthesis and cell metabolism are down-regulated, but low temperature also induces a small subset of proteins known as cold-shock proteins that escape translational repression17,18. Amongst these, RNA-binding motif protein 3 (RBM3) and cold-inducible RNA binding protein (CIRP) are cold-shock proteins expressed at high levels in brain6,19. We found strong induction of RBM3 by cooling in brains of wild type mice and in mice with prion disease at 4 w.p.i and AD mice at 2 months (Figure 2). CIRP was not upregulated (Extended Data Figure 4). However, both prion and 5×FAD mice lost the capacity to upregulate RBM3 after cooling at 6 w.p.i. (Figure 2b) and at 3 months of age (Figure 2c) respectively, in parallel with the lost ability to reassemble synapses after cooling at these time points (Figure 1b,c). Therefore, we asked if induction of RBM3 expression drives synaptic recovery.
Figure 2. Failure to induce RBM3 parallels lost capacity for synaptic recovery in neurodegenerative disease models.
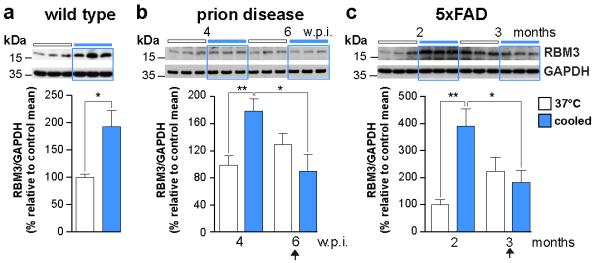
a) Cooling induces increased RBM3 levels in hippocampi of wild type mice. The response fails b) at 6 w.p.i. in prion-infected mice and c) at 3 months in 5×FAD mice (arrows). Representative western blots are shown. Bar graphs show quantification of RBM3 levels relative to GAPDH, (n = 6-11 mice per time point; all experiments in triplicate) **p < 0.01, *p <0.05, Mann Whitney U test in a and c, Student’s t-test in b. All data are mean ± s.e.m.
Therapeutic hypothermia is a powerful neuroprotectant in brain injury acting through multiple mechanisms, including enhanced gene expression driving regenerative processes enhancing synapse formation (see Yenari and Han for review)17. RBM3 has been implicated in protection against cell death in various in vitro models of cooling and neuroprotection20,21, albeit in conditions of mild hypothermia (~32°C). It is known to increase local protein synthesis at dendrites19 and global protein synthesis through ribosomal sub-unit binding and/or miRNA biogenesis22. The neuroprotective effects of hypothermia on neurodegenerative disease are unknown, however. Given that the capacity for structural plasticity correlated with induction of RBM3, we asked if raising endogenous RBM3 levels through early therapeutic cooling would restore failed synaptic plasticity. In wild type mice, a single episode of cooling to 16-18°C raised RBM3 levels in brain for up to 3 days (see Figure 2a and Extended Data Figure 4c), suggesting the response is sustained for some time after the cold stress. Animals were cooled twice: at 3 w.p.i. and again at 4 w.p.i., resulting in a sustained several fold increase in RBM3 expression up to six weeks later, declining to baseline levels at 12 w.p.i., at terminal stage of disease (Figure 3a and Extended Data Figure 5). Control mice were infected with prions but were not cooled. Early cooling and associated increased RBM3 expression protected against synapse loss in prion disease at 7, 8 and 9 w.p.i. (Figure 3b), restored synaptic transmission (Figure 3c) and prevented behavioural deficits, maintaining burrowing behaviours and novel object recognition memory (Figure 3d and Extended Data Figure 6a). There was also marked neuronal protection in the hippocampus (Figure 3e, compare panels B and C), even in mice succumbing to prion infection, which is ultimately overwhelming due to other toxic effects13. Most remarkably, early cooling significantly increased survival in prion-infected mice (91±7 days in cooled mice vs 84±4 days for uncooled mice; p = 0.0003). Indeed, one animal survived 117 days post infection, nearly a 50% increase in life expectancy (Figure 3f). Mice cooled later in prion disease, at 5 and 6 wpi, when the RBM3 induction response is lost (see Figure 2b), did not show increased survival (Extended Data Figure 7). As predicted, RBM3 knockdown by lentivirally-mediated RNAi in the hippocampus abolished the protective effects of early cooling on CA1 pyramidal neurons and spongiform change (Figure 3e, panel D), on object recognition memory (Extended Data Figure 6b,c), and on survival (Figure 3f). As before, misfolded PrP levels were not affected by cooling (Extended Data Figure 8). In therapeutic human hypothermia temperatures of ~34°C are used, similar to those of hibernating large mammals such as bears, which are known to induce similar transcriptional changes in RBM36. Therefore, these physiological changes in small rodents at 16-18°C may well be relevant in therapeutic human hypothermia23. Cooling of mice to higher core temperature of 26-28°C, was similarly protective in prion disease, extending survival (Extended Data Figure 9).
Figure 3. Early cooling induces RBM3 over-expression and is neuroprotective in prion-infected mice.

a) Cooling at 3 and 4 w.p.i. resulted in sustained high levels of RBM3 in hippocampus for several weeks (n= 3-8 mice per time point) causing b) marked protection of synapse number at 7, 8 and 9 w.p.i. (62 images from 2 mice per time point). Scale bar = 1μm. c) Early cooling maintained synaptic transmission (n= 4-8 cells from 2 mice per time point; representative raw traces of evoked EPSCs are shown) and d) prevented decline in burrowing behaviour and loss of novel object recognition memory, expressed as ratio of exploratory preference (n ≥10 mice per group) in contrast to un-cooled mice. e) Haematoxylin and eosin stained sections show striking reduction in hippocampal spongiosis and protection of CA1 neurons (bar chart) in cooled mice that is abolished by RBM3 knockdown (n = 4-6 animals per treatment, except LV-shRNA-RBM3: n = 2). Scale bar = 50μm. One-way ANOVA, Brown-Forsythe test with Tukey’s post hoc analysis for multiple comparisons was used in d and e. f) Early cooling significantly prolonged survival, but this was abolished by knockdown of RBM3 (n = 31 cooled mice; n = 17 not cooled; n = 10 cooled + RNAi of RBM3). Mann-Whitney U test. *p < 0.05; **p< 0.01; ***p < 0.001. Student’s t-test two tails was used unless otherwise stated. All data in bar charts are mean ± s.e.m.
We next asked if RBM3 over-expression alone, in the absence of cooling, was similarly neuroprotective. We over-expressed, or knocked-down, RBM3 in both hippocampi of mice by stereotaxic injection of lentiviruses LV-RBM3 and LV-shRNA-RBM3, respectively. LV-RBM3 produced a three-fold increase in RBM3 levels compared to controls up to 8 weeks post injection; while knockdown by LV-shRNA-RBM3 reduced RBM3 levels to 30% of control levels (Figure 4a). LV-RBM3 treatment, but not LV-Control, rescued the early deficit in synapse reassembly in both prion-infected and 5×FAD mice on rewarming (Figure 4b). Further, LV-RBM3 was associated with marked, sustained neuroprotective effects in prion-infected mice: preventing synapse loss (Figure 4c), synaptic transmission decline (Figure 4d) and memory and behavioral impairments (Figure 4e). In vitro, RBM3 has been shown to promote translation22. Increased global protein synthesis rates are profoundly neuroprotective, rescuing synapse number in prion disease13,14. We found that RBM3 over-expression rescued levels of global translation, while RBM3 knockdown further reduced them, in prion infected mice at 9 w.p.i (Figure 4f) suggesting that this action of RBM3 along with preferential translation of specific RBM3-bound mRNAs, contributes to the synapse regeneration process. LV-RBM3 treatment reduced prion neuropathology and prevented neuronal loss (compare panels B and C in Figure 4g) and significantly extended survival of prion-infected animals (Figure 4h). This was not associated with changes in levels of PrPSc, which were not affected by over-expression of RBM3 (Extended Data Figure 8). Knockdown of RBM3, in contrast, accelerated synapse loss and memory and behavioural deficits (Figure 4c-e), accelerating neuronal loss (Figure 4g, panel D) and significantly shortening survival (Figure 4h). 5×FAD mice do not allow similar analysis of long-term effects of RBM3 over-expression as evolution of deficits and neuronal loss takes many months, and life expectancy is normal. However, RNAi of RBM3 accelerated onset of synaptic loss in 5×FAD mice, which was now seen at 3 months (Extended Data Figure 10a), suggesting that RBM3 has a long-term protective role in structural plasticity in these mice also. RBM3 knockdown also reduced synapse number and novel object memory in wild type mice (Extended Data Figure 10b), thus it is likely to be involved in synaptic maintenance under normal physiological conditions.
Figure 4. Lentivirally mediated over-expression of RBM3 restores structural synaptic plasticity and is neuroprotective in neurodegenerative disease.

a) LV-RBM3 produces high levels of expression in hippocampus; LV-shRNA-RBM3 reduces endogenous levels. Representative western blot and bar graph, where n = 6 mice per treatment, repeated in triplicate. b) LV-RBM3 rescues the deficit in structural plasticity in prion-infected and 5×FAD mice at 6 w.p.i. and 3 months of age respectively (93 images from 3 mice per time point) and c) produced lasting protection of synapse number in prion-infected mice at 7 and 9 w.p.i., while LV-shRNA-RBM3 accelerated synapse loss (62 images from 2 mice per time point). d) LV-RBM3 resulted in significant recovery in synaptic transmission (left panel, inset: representative raw traces of evoked EPSCs are shown; n= 6 cells from 2 mice per time point) and e) protected against behavioural decline, while RNAi of RBM3 accelerated memory loss and burrowing deficits (n ≥10 mice per group). RBM3 over-expression: f) increases global protein synthesis rates in hippocampal slices of prion-infected mice at 9 w.p.i. (n = 4-6 mice), g) is neuroprotective (n= 3-6 mice) and h) significantly lengthened survival (n = 20 mice), while knockdown accelerated disease (n = 14 mice), compared to LV-control treated mice (n = 31 mice), Mann Whitney U test. p * <0.05 p ** <0.01 *** p < 0.001. Student’s t-test, two tails except in e,f and g which used one-way ANOVA, Brown Forsythe test with Tukey’s post hoc analysis for multiple comparisons. All data represent means ± s.e.m. Scale bar = 1μm in b and c and 50μm in g.
In conclusion, we have shown that early synapse loss in mouse models of neurodegenerative disease results, at least in part, from defective synaptic repair processes associated with failure to induce the cold-shock RNA-binding protein, RBM3. This results in impaired synaptic reassembly after cooling, but also appears to be important in the context of protecting against on-going synaptic toxicity during disease and in synaptic maintenance in wild type mice. Our data suggest that further understanding the mechanisms of action of cold shock proteins such as RBM3 may yield insights into endogenous repair processes and bring new therapeutic targets for neuroprotection in neurodegenerative disease.
Methods
Animals
All animal work conformed to UK regulations and institutional guidelines, performed under Home Office guidelines.
Prion infection of mice
3 week old tg37+/− mice11 were inoculated intracerebrally into the right parietal lobe with 30μl of 1% brain homogenate of Chandler/RML (Rocky Mountain Laboratories) prions under general anesthetic, as described24. Animals were culled when they developed clinical signs of scrapie as defined in14. Control mice received 1% normal brain homogenate.
5×FAD mice
Founder 5×FAD mice were obtained from the Jackson Laboratory (Ba Harbor, ME, USA). The 5×FAD mice have the following five mutations: Swedish (K670N and M671L), Florida (I716V) and London (V717I) in human APP695 and human PS1 cDNA (M146L and L286V) under the transcriptional control of the neuron-specific mouse Thy-1 promoter7. Colonies were maintained by crossing hemizygous transgenic to wild type littermates.
Induction of hypothermia
FVB, tg37+/− and 5×FAD mice weighing ≥20g were cooled using 5′-AMP as described15,25, with slight modifications. Freshly prepared 5′-AMP (Sigma) was injected intraperitoneally (0.7 mg/g). Control mice were injected with saline. Mice were maintained at room temperature until core body temperature decreased to 25°C (approx. 60 minutes). Subsequently, mice were transferred to a refrigerator (5°C) and core body temperature lowered to 16-18°C for 45 minutes. Mice recovered normal body temperature at room temperature conditions. Cooled samples were collected at the end of the 16-18°C period and rewarmed samples as stated elsewhere in the text.
Electron Microscopy data acquisition and analysis of synapse number
Male mice were used to avoid the effects on synapse number of the oestrus cycle. Brains were perfusion fixed with 2% glutaraldehyde + 2% paraformaldehyde in 0.1M sodium cacodylate buffer (final pH 7.3). Slices (300μm) were prepared using a vibrating blade microtome (Leica Microsystems, Milton Keynes, UK). These slices were post-fixed in 1% osmium tetroxide + 1% potassium ferrocyanide, stained en-bloc with 5% uranyl acetate and embedded in epoxy resin (TAAB Laboratories Equipment Ltd, Aldermaston, UK), as described26.
For random sampling and calculation of synapse density, estimation of total synapse number and measures of volume of tissue using the stereology disector method: the following procedures were used, as described in West16. Fixed and stained slices were flat embedded as described27. The slices were mounted for microtomy, a semi-thin (1μm) section was cut from the upper surface of each slice and the area of the stratum radiatum (sr) measured using the Cavalieri estimator (points grid), as described16. These results were then used to estimate the volume of the stratum radiatum and the systematic random selection of regions for electron microscopy, as described16. Briefly, the grid has intersections every 50 pixels (at a scale that 1 pixel is 1μm). Each intersection was labelled with a dot. The dots were numbered in each of the sections generated per hippocampus. These numbers were used for measuring the area of each section and generate the data about the volume applying the following formula: VsrCA1= ΣPsrCA1 × Ap × T16. The total number of dots per hippocampus was divided by 6 (number of samples selected to obtain representative synapse variability from the whole hippocampus). The number obtained was used for the generation of a random number for sampling the first position and defined the interval for the subsequent 5 positions to be sampled. These regions were trimmed-down, mounted on aluminium pins and imaged by serial block-face scanning electron microscopy in a FEI Quanta FEG 250 electron microscope (FEI Ltd, Cambridge, UK) equipped with a ‘3View2XP’ system (Gatan Ltd, Abingdon, UK). Images of 32 serial sections were generated in each of the six points. Serial sections of areas 51.4 μm2 were recorded at x20000 and an accelerating voltage of 3kV, using spot size 3.0, at a working distance of 6.1mm, and a dwell-time of 5 μsec/pixel. The mean section thickness was estimated by sectioning only half of the original block face. The block was then re-embedded, sectioned orthogonally and the depth removed by ‘3View’ was measured by transmission electron microscopy28. The mean thickness of 3View sections was 86nm. We analyzed synapses in a volume stack of 88μm3 (with an area of 33μm2, a measured section thickness of 0.086 μm and 31 sections). Synapses that had their first identifiable profile below the first section in the series were counted16. Synapses were identified, within a counting frame of 5.75 × 5.75 microns, which follows the counting frame rules to avoid edge effect for the estimation of synapse numerical density. The total number of synapse was estimated with the synapse density and the volume of each hippocampus, as described16.
Synapse size was calculated by measuring mean synapse length, mean synapse area in the same serial sections used for estimations of synapse density and total synapse number, as described16.
For routine 2-D analyses: semi-thin (1μm) sections were stained with toluidine blue and examined to select areas for ultramicrotomy. Ultrathin sections (~70nm) were stained with lead citrate and examined, blind, in a Jeol 100-CXII electron microscope (JEOL (UK) Ltd. Welwyn Garden City, UK) equipped with a ‘Megaview III’ digital camera (Olympus Soft Imaging Solutions GmbH, Münster, Germany). A series of images were recorded from the stratum radiatum, all at a distance of approximately 100μm from the CA1 pyramidal layer to avoid the large dendritic profiles in the proximal area. 31 images, each encompassing an area of 55 μm2, from each of two to three mice were used for scoring. For synapse quantification the following criteria were followed: the presence of an unambiguous postsynaptic density, a clear synaptic cleft, and three or more synaptic vesicles. An average of 300 synapses were counted per sample.
Quantitation of numbers of neurons in CA1 region of hippocampus
for CA1 pyramidal layer volume analysis, whole hippocampus was cut and every 250μm stained with Haemotoxylin and Eosin in fixed sections of 5um thickness. The volume of the pyramidal layer was measured using the Cavalieri estimator (points grid). For neuron mean density slices were stained with NeuN and calculated within an unbiased virtual space. The total number of neurons in CA1 pyramidal layer was estimated with the neuron density and the volume of the hippocampus.
Immunoblotting
Protein samples were isolated from hippocampi using protein lysis buffer (50 mM Tris, 150 mM NaCl,1% Triton X-100, 1% Na deoxycholate, 0.1% SDS and 125 mM sucrose) supplemented with Phos-STOP and protease inhibitors (Complete, Roche), followed by centrifugation and quantification. Protein levels were determined by resolving 20 μg of protein on SDS–polyacrylamide gel electrophoresis gels, transferred onto either nitrocellulose or PDVF membranes and incubated with primary antibodies. Synaptic proteins were detected using the following antibodies: SNAP-25, (1:10,000; Cat. number: ab5666, Abcam), VAMP2 (1:5,000; Cat. number: 104204, Synaptic Systems), NMDA-R1 (1:1,000; Cat. number: G8913, Sigma) and PSD95 (1:1,000; Cat. number: 04-1066, Millipore). Odyssey IRDye800 secondary antibodies (1:5,000; Cat. number: 926-32210/32211 LI-COR) were applied, visualized and quantified using Odyssey infrared imager (LI-COR; software version 3.0). Protein for PrP levels was determined using the primary antibody ICSM35 (1:10,000; Cat. number: 0130-03501, D-GEN). PrPSc was detected after Proteinase K digestion. Cold shock proteins levels were determined with antibodies CIRP (1:1,000; Cat. number: 10209-2-AP, Proteintech Group, Inc.) and RBM3 (1:500; Cat. number: 14363-1-AP, Proteintech Group, Inc.). Aβ levels in 5×FAD mice were detected by 6E10 clone antibody (1:1,000; Cat. number: SIG-39320, Covanche). Horseradish-peroxidase-conjugated secondary antibodies (1:10,000; DAKO) were applied and protein visualized using enhanced chemiluminescence (GE Healthcare) and quantified using ImageJ. Antibody against GAPDH (1:5,000; Cat. number: sc32233, Santa Cruz) was used to determine gels loading.
Lentiviruses
GenTarget Inc (San Diego, CA, USA) generated lentiviral plasmids. The neuron-specific promoter CAMKII was used to drive RBM3; the H1 promoter was used for shRNA-RBM3 expression and scrambled sequence-shRNA. Viruses were injected stereotaxically into the CA1 region of the hippocampus as described30. Mouse RBM3 isoform 2 (NM_001166410.1) overexpression was induced using the pLenti-CAMKII (RBM3)-Rsv (GFP-Bsd) plasmid. pLenti-CAMKII (empty)-Rsv (GFP-Bsd) was used as control. RBM3 down regulation was achieved by using pLenti-H1-shRNA(m RBM3) sequence #2-Rsv(GFP-Bsd). This plasmid contains the following shRNA-RBM3 sense, anti-sense and loop sequences (sequence #2: 5′-GTTGATCATGCAGGAAAGTCTcgagAGACTTTCCTGCATGATCAAC-3′. pLenty-H1-shRNA (negative control)-Rsv (GFP-Bsd) containing the sequence 5′-GTCTCCACGCGCAGTACATTT-3′ was used as control. Lentiviral sequences and viral stocks were generated by GenTarget Inc (San Diego, CA, USA). Virus titre was determined using FACS (BD FACS Calibur). Viruses were used with a final titre of 0.6-1.5 × 10⁸ transducing units.
Stereotaxic Injection
Under general anesthetic, mice were injected with 5μl of lentivirus per site into the CA1 region of the hippocampus. Mice were injected at 2 locations per hemisphere; at −2mm and −2.7mm posterior, ±2mm lateral and −2.2mm ventral relative to bregma, using a 26s-gauge needle and Hamilton syringe as described30.
Burrowing assay
This was performed as described14,29. Briefly, mice were placed in individual large plastic cages containing a clear Perspex tube, 20cm long × 6.8cm diameter, filled with 140g of normal food pellets. The weight of pellets remaining in the tube was measured after 2hours and the percentage burrowed calculated. Behavioral data were analysed using one-way ANOVA with Brown-Forsythe test and Tukey’s post hoc test.
Novel object recognition memory
This was performed as described12. Briefly, mice were tested in a black cylindrical arena (69cm diameter) mounted with a 100 LED strip infra-red light source and a high resolution day/night video camera (Sony). Mice were acclimatized to the arena five days prior to testing. During the learning phase, two identical objects were placed 15 cm from the sides of the arena. Each mouse was placed in the arena by an operator blind to the experimental group for two blocks of 10 min for exploration of the objects with an inter-trial interval of 10 minutes. Two hours later, one of the objects was exchanged for a novel one, and the mouse was replaced in the arena for 5 minutes (test phase). The amount of time spent exploring all objects was tracked and measured for each animal using Ethovision software (Tracksys Ltd.) All objects and the arena were cleansed thoroughly between trials to ensure the absence of olfactory cues. The amount of time spent exploring the novel one over the familiar one is expressed as a ratio, where a ratio of 1 reflects random exploration, and >1 reflects memory. Behavioural data were analysed using one-way ANOVA with Brown-Forsythe test and Tukey’s post hoc test.
Electrophysiology
Whole-cell recordings were made in acute hippocampal slices to measure synaptic transmission from identified CA1 neurons and recording performed as described31. In brief, neurons were voltage clamped using a Multiclamp 700B amplifier and pClamp 10.3 software (Molecular Devices) and EPSCs were evoked by stimulation with bipolar platinum electrode at 37 °C. Pipettes (2.5-3.5 MΩ) were filled with a solution containing (in mM): KCl 110, HEPES 40, EGTA 0.2, MgCl2 1, CaCl2 0.1; pH was adjusted to 7.2 with KOH. Neurons were visualized with ×60 objective lenses on a Nikon FS600 microscope fitted with differential interference contrast optics. Four to eight cells were measured per mouse in at least two animals per experiment.
Hippocampal slice preparation and 35S-methionine labeling
Slices were dissected in an oxygenated cold (2-5°C) sucrose artificial cerebrospinal fluid (ACSF) containing (mm): 26mM NaHCO3, 2.5mM KCl, 4 mM MgCl2, 0.1 mM CaCl2, and 250mM sucrose. Hippocampal slices were prepared using a tissue chopper (McIlwain). Slices were allowed to recover in normal ACSF buffer while being oxygenated at 37°C for 1hr, then incubated with [35S]-Methionine label for one hour, then homogenized14. Proteins were TCA precipitated and incorporation of radiolabel was measured by scintillation counting (Winspectal, Wallac Inc.).
Statistics
Statistical analyses were performed using Prism v5 software, using Student’s t test for data sets with normal distribution and a single intervention; when the F test to compare variances was significant, Mann Whitney U-test was performed instead.
Behavioural data, neuronal counts and 35S-met were analysed using one-way ANOVA and Tukey’s post hoc test for multiple variables.
For behavioural testing no formal randomization was needed or used. Experimenter was blind to group allocation during the experiments and when assessing outcome.
Statistical analyses for in vivo experiments
Sample size estimation for induction of hypothermia for volume, synaptic density and estimation of total number of synapses was based in effect size of the preliminary experiment on dissector method (5.9511) and obtained with the free software G*Power 3.1.9.2.
The software prediction shows that with a sample size of six animals for two conditions (control and cooled or cooled and rewarmed), the experiment have a 99.83485% of chance of detecting a difference and avoid a type II error (β error), with a 0.05% chance of a type I (α-error). Sample size estimation for novel object recognition experiment was established based on the effect size of 1.6161 from control and prion mice at 8 w.p.i.. This parameter was applied in the following F tests calculation of Power analysis with G*Power 3.1.9.2.
Similar analyses were performed for burrowing tests.
Extended Data
Extended Data Figure 1. Stereological assessment of volume and synapse size to validate 2D assumption-based approaches for counting synapse density.

a) CA1 volume and synapse mean length and area in the stratum radiatum remain essentially unchanged on cooling and rewarming in wild type mice. Volume was measured using disector principle and synapse mean length and area determined in the same sections, as described16, n= as reported for Figure 1a. Representative electron micrographs (pseudo-coloured for ease of synapse identification) for data not shown in Figure 1b and 1c, from prion-infected mice at 4 and 6 w.p.i. b) and for 5x FAD mice at 2 and 3 months c) before cooling (black framed images) and cooled (blue framed images). d) Schematic showing lost capacity for structural plasticity precedes synapse loss and neuronal loss in both mouse models. Scale bar = 1μm. All data in bar charts are mean ± s.e.m. Student’s t-test, two tailed. Non-significant p values.
Extended Data Figure 2. Synaptic protein levels during cooling-rewarming in prion and 5×FAD mice.

a) Levels of pre-(SNAP25, VAMP2) and post-(PSD95, NR1) synaptic proteins do not change before (black bars) and after cooling to 16-18°C (blue bars) in prion-infected mice at 4 and 6 w.p.i, and b) 5×FAD mice at 2 and 3 months. Representative western blots are shown for 3 mice per temperature and time point. Bar graphs show quantification of synaptic protein levels relative to GAPDH. All data represent means ± s.e.m. (n = 3-11 mice per time point). Student’s t-test, two tailed. Non-significant p values.
Extended Data Figure 3. Cooling does not induce changes in PrPSc or Aβ levels.

a) Levels of total PrP (upper blot) and PrPSc (lower blot) do not change notably before (white line), during (blue line) or after (red line) cooling to 16-18°C in prion-infected mice. PrPSc is detected after digestion with proteinase K. Levels are undetectable by western bloting at 6 w.p.i., as expected. b) Cooling does not change levels of Aβ oligomers in 5×FAD mice, arrow indicates Aβ monomers (Lane 1 - synthetic Aβ oligomers, last lane - one year old 5×FAD control (C+)). Representative western blots are shown for 3 mice per temperature and time point. Data in bar charts are mean ± s.e.m. Student’s t-test, two tailed. Non-significant p values.
Extended Data Figure 4. Cooling induces sustained increase in RBM3 levels but not in CIRP.

Levels of CIRP do not change after cooling in a) prion-infected at 4 and 6 w.p.i or b) in 5x FAD mice at 2 and 3 months. Representative western blots are shown for 3 mice per temperature and time point. Bar graphs show quantification of CIRP levels relative to GAPDH. All data represent means ± s.e.m (n = 6-9 mice per time point). Student’s t-test, two tailed. Non-significant p values. c) Increased levels of RBM3 are sustained for at least 72hrs after cooling in wild type mice. Bar graph shows quantification of RMB3 against GAPDH in control (white bar), cooled (blue bar), and 12, 48 and 72 hrs recovery after cooling (red bars). All data represent means ± s.e.m, (n= 3-6 mice per time points, *p < 0.05, Mann Whitney U test, two tailed).
Extended Data Figure 5. Levels of RBM3 remain elevated after early cooling.

to 16-18°C in prion-infected mice (magenta boxes) compared to control prion-infected mice. These levels remained high up to six weeks later and declined at 12 w.p.i. Representative western blots are shown for 3 mice per time point.
Extended Data Figure 6. Exploration time in exposure phase of novel object testing is normal in all groups; RBM3 knockdown abolishes improved memory after cooling.

a) exploratory behaviour measured in seconds is not different in mice with early cooling from prion diseased mice and is not affected by the duration of disease (n as reported in figure 3d); b) lentivirally mediated RNAi of RBM3 eliminates the protective effect of cooling on novel object memory impairment in prion disease (dark green bar); c) but does not affect exploratory behaviour in training phase. Data analysed using one way ANOVA, Brown-Forsythe test with Tukey’s post hoc analysis for multiple comparisons (n = 11-16 mice per time point, **p < 0.01).
Extended Data Figure 7. Induction of hypothermia at time point when RBM3 induction fails is not neuroprotective.

Cooling at 5 and 6 w.p.i., when synaptic plasticity and RBM3 induction fails (see Figure 1 and 2, main text), does not increase survival in prion infected mice. Kaplan-Meier survival plots for prion-infected mice (black line, no cooling; n = 10; orange line, mice cooled at 5 and 6 w.p.i., n = 16). Student’s t-test, two tailed. Non-significant p values
Extended Data Figure 8. PrPSc levels remain unchanged in prion with over-expression of RMB3.

In prion-infected mice total PrP and PrPSc levels do not alter a) after early cooling to 16-18°C (magenta boxes), or b) following treatment with LV-RBM3 (dark green) and LV-shRNA-RBM3 (pale green). PrP and PrPSc levels tested in 9 w.p.i and terminal mice. PrPSc is detected after digestion with proteinase K. Representative western blots are shown for 3 mice per temperature and time point, C shows uninfected control mouse.
Extended Data Figure 9. Mild hypothermia also extends survival in prion-infected mice.

Kaplan Meier plot showing that cooling to 26°C at an early stage also significantly lengthens survival (n = 27 v n = 16 mice); **p <0.01, Student’s t-test, two tailed.
Extended Data Figure 10. RNAi of RBM3 down-regulation accelerates impaired structural synaptic plasticity in the 5×FAD mouse model, and also reduced synapse number and function in wild type mice.

Impaired structural synaptic plasticity after cooling occurs in shRNA-RBM3 treated 5×FAD mice at 3 months. Representative electron micrographs are shown and are pseudo-coloured as in main text figures. Quantification shows significant reduction in synapse number by RNAi of RBM3. (n = 82-93 images from 3 mice per time point, Student’s t-test, two tailed) b) RBM3 knockdown reduces synapse number and novel object memory in wild type mice. (n =93 images from 3 mice per time point, Student’s t-test, two tailed ***p <0.0001; n.o.r. n=11 mice LV-shRNA-control and 10 mice LV-shRNA-RBM3, Mann Whitney U test, * p <0.05). Scale bar = 1μm
Supplementary Material
Acknowledgements
We thank Jenny Edwards, Judy McWilliam and David Read of the MRC Toxicology Unit; members of University of Leicester Department of Biological Services staff; and Daniel Morrison, University of Cambridge, for technical assistance. We thank Dr Jeremy Skepper, University of Cambridge, for advice about stereological procedures. This work was funded by the Medical Research Council, UK.
Footnotes
The authors declare no conflict of interest.
References
- 1.Holtmaat A, Svoboda K. Experience-dependent structural synaptic plasticity in the mammalian brain. Nature Reviews Neuroscience. 2009;10:647–658. doi: 10.1038/nrn2699. doi:nrn2699 [pii] 10.1038/nrn2699. [DOI] [PubMed] [Google Scholar]
- 2.Selkoe DJ. Alzheimer’s disease is a synaptic failure. Science. 2002;298:789–791. doi: 10.1126/science.1074069. doi:10.1126/science.1074069 298/5594/789 [pii] [DOI] [PubMed] [Google Scholar]
- 3.Mallucci GR. Prion neurodegeneration: starts and stops at the synapse. Prion. 2009;3:195–201. doi: 10.4161/pri.3.4.9981. doi:9981 [pii] [DOI] [PMC free article] [PubMed] [Google Scholar]
- 4.Magarinos AM, McEwen BS, Saboureau M, Pevet P. Rapid and reversible changes in intrahippocampal connectivity during the course of hibernation in European hamsters. Proc Natl Acad Sci U S A. 2006;103:18775–18780. doi: 10.1073/pnas.0608785103. doi:10.1073/pnas.0608785103. [DOI] [PMC free article] [PubMed] [Google Scholar]
- 5.Popov VI, Bocharova LS. Hibernation-induced structural changes in synaptic contacts between mossy fibres and hippocampal pyramidal neurons. Neuroscience. 1992;48:53–62. doi: 10.1016/0306-4522(92)90337-2. [DOI] [PubMed] [Google Scholar]
- 6.Williams DR, et al. Seasonally hibernating phenotype assessed through transcript screening. Physiol Genomics. 2005;24:13–22. doi: 10.1152/physiolgenomics.00301.2004. doi:00301.2004 [pii] 10.1152/physiolgenomics.00301.2004. [DOI] [PubMed] [Google Scholar]
- 7.Oakley H, et al. Intraneuronal beta-amyloid aggregates, neurodegeneration, and neuron loss in transgenic mice with five familial Alzheimer’s disease mutations: potential factors in amyloid plaque formation. The Journal of neuroscience. 2006;26:10129–10140. doi: 10.1523/JNEUROSCI.1202-06.2006. doi:10.1523/JNEUROSCI.1202-06.2006. [DOI] [PMC free article] [PubMed] [Google Scholar]
- 8.Popov VI, et al. Reversible reduction in dendritic spines in CA1 of rat and ground squirrel subjected to hypothermia-normothermia in vivo: A three-dimensional electron microscope study. Neuroscience. 2007;149:549–560. doi: 10.1016/j.neuroscience.2007.07.059. doi:S0306-4522(07)00906-2 [pii] 10.1016/j.neuroscience.2007.07.059. [DOI] [PubMed] [Google Scholar]
- 9.Ruediger J, et al. Dynamics in the ultrastructure of asymmetric axospinous synapses in the frontal cortex of hibernating European ground squirrels (Spermophilus citellus) Synapse. 2007;61:343–352. doi: 10.1002/syn.20380. doi:10.1002/syn.20380. [DOI] [PubMed] [Google Scholar]
- 10.von der Ohe CG, Garner CC, Darian-Smith C, Heller HC. Synaptic protein dynamics in hibernation. The Journal of Neuroscience. 2007;27:84–92. doi: 10.1523/JNEUROSCI.4385-06.2007. doi:27/1/84 [pii] 10.1523/JNEUROSCI.4385-06.2007. [DOI] [PMC free article] [PubMed] [Google Scholar]
- 11.Mallucci GR, et al. Post-natal knockout of prion protein alters hippocampal CA1 properties, but does not result in neurodegeneration. Embo J. 2002;21:202–210. doi: 10.1093/emboj/21.3.202. doi:10.1093/emboj/21.3.202. [DOI] [PMC free article] [PubMed] [Google Scholar]
- 12.Mallucci GR, et al. Targeting cellular prion protein reverses early cognitive deficits and neurophysiological dysfunction in prion-infected mice. Neuron. 2007;53:325–335. doi: 10.1016/j.neuron.2007.01.005. doi:S0896-6273(07)00008-6 [pii] 10.1016/j.neuron.2007.01.005. [DOI] [PubMed] [Google Scholar]
- 13.Moreno JA, et al. Sustained translational repression by eIF2alpha-P mediates prion neurodegeneration. Nature. 2012;485:507–511. doi: 10.1038/nature11058. doi:10.1038/nature11058. [DOI] [PMC free article] [PubMed] [Google Scholar]
- 14.Moreno JA, et al. Oral treatment targeting the unfolded protein response prevents neurodegeneration and clinical disease in prion-infected mice. Science translational medicine. 2013;5:206ra138. doi: 10.1126/scitranslmed.3006767. doi:10.1126/scitranslmed.3006767. [DOI] [PubMed] [Google Scholar]
- 15.Zhang J, Kaasik K, Blackburn MR, Lee CC. Constant darkness is a circadian metabolic signal in mammals. Nature. 2006;439:340–343. doi: 10.1038/nature04368. doi:nature04368 [pii] 10.1038/nature04368. [DOI] [PubMed] [Google Scholar]
- 16.West MJ. Counting and measuring ultrastructural features of biological samples. Cold Spring Harb Protoc. 2013;2013:593–605. doi: 10.1101/pdb.top071886. doi:2013/7/pdb.top071886 [pii] 10.1101/pdb.top071886. [DOI] [PubMed] [Google Scholar]
- 17.Yenari MA, Han HS. Neuroprotective mechanisms of hypothermia in brain ischaemia. Nature Reviews Neuroscience. 2012;13:267–278. doi: 10.1038/nrn3174. doi:nrn3174 [pii] 10.1038/nrn3174. [DOI] [PubMed] [Google Scholar]
- 18.Danno S, et al. Increased transcript level of RBM3, a member of the glycine-rich RNA-binding protein family, in human cells in response to cold stress. Biochemical and biophysical research communications. 1997;236:804–807. doi: 10.1006/bbrc.1997.7059. doi:S0006-291X(97)97059-5 [pii] 10.1006/bbrc.1997.7059. [DOI] [PubMed] [Google Scholar]
- 19.Smart F, et al. Two isoforms of the cold-inducible mRNA-binding protein RBM3 localize to dendrites and promote translation. Journal of neurochemistry. 2007;101:1367–1379. doi: 10.1111/j.1471-4159.2007.04521.x. doi:JNC4521 [pii] 10.1111/j.1471-4159.2007.04521.x. [DOI] [PubMed] [Google Scholar]
- 20.Chip S, et al. The RNA-binding protein RBM3 is involved in hypothermia induced neuroprotection. Neurobiology of disease. 2011;43:388–396. doi: 10.1016/j.nbd.2011.04.010. doi:S0969-9961(11)00127-6 [pii] 10.1016/j.nbd.2011.04.010. [DOI] [PubMed] [Google Scholar]
- 21.Tong G, et al. Effects of moderate and deep hypothermia on RNA-binding proteins RBM3 and CIRP expressions in murine hippocampal brain slices. Brain Res. 2013;1504:74–84. doi: 10.1016/j.brainres.2013.01.041. doi:S0006-8993(13)00137-6 [pii] 10.1016/j.brainres.2013.01.041. [DOI] [PubMed] [Google Scholar]
- 22.Dresios J, et al. Cold stress-induced protein Rbm3 binds 60S ribosomal subunits, alters microRNA levels, and enhances global protein synthesis. Proc Natl Acad Sci U S A. 2005;102:1865–1870. doi: 10.1073/pnas.0409764102. doi:0409764102 [pii] 10.1073/pnas.0409764102. [DOI] [PMC free article] [PubMed] [Google Scholar]
- 23.Lee CC. Is human hibernation possible? Annu Rev Med. 2008;59:177–186. doi: 10.1146/annurev.med.59.061506.110403. doi:10.1146/annurev.med.59.061506.110403. [DOI] [PubMed] [Google Scholar]
Methods References
- 24.Mallucci G, et al. Depleting neuronal PrP in prion infection prevents disease and reverses spongiosis. Science. 2003;302:871–874. doi: 10.1126/science.1090187. doi:Doi 10.1126/Science.1090187. [DOI] [PubMed] [Google Scholar]
- 25.Daniels IS, et al. A role of erythrocytes in adenosine monophosphate initiation of hypometabolism in mammals. The Journal of biological chemistry. 2010;285:20716–20723. doi: 10.1074/jbc.M109.090845. doi:M109.090845 [pii] 10.1074/jbc.M109.090845. [DOI] [PMC free article] [PubMed] [Google Scholar]
- 26.Deerinck TJ. Microsc. Microanal. 2010;16:1138–1139. [Google Scholar]
- 27.Nguyen KB, Pender MP. A simple technique for flat osmicating and flat embedding of immunolabelled vibratome sections of the rat spinal cord for light and electron microscopy. J Neurosci Methods. 1996;65:51–54. doi: 10.1016/0165-0270(95)00145-x. [DOI] [PubMed] [Google Scholar]
- 28.Yang GCH, Shea SM. Precise Measurement of Thickness of Ultrathin Sections by a Resectioned-Section Technique. J Microsc-Oxford. 1975;103:385–392. [Google Scholar]
- 29.Cunningham C, et al. Synaptic changes characterize early behavioural signs in the ME7 model of murine prion disease. Eur J Neurosci. 2003;17:2147–2155. doi: 10.1046/j.1460-9568.2003.02662.x. doi:2662 [pii] [DOI] [PubMed] [Google Scholar]
- 30.White MD, et al. Single treatment with RNAi against prion protein rescues early neuronal dysfunction and prolongs survival in mice with prion disease. P Natl Acad Sci USA. 2008;105:10238–10243. doi: 10.1073/pnas.0802759105. doi:Doi 10.1073/Pnas.0802759105. [DOI] [PMC free article] [PubMed] [Google Scholar]
- 31.Haustein MD, et al. Acute hyperbilirubinaemia induces presynaptic neurodegeneration at a central glutamatergic synapse. J Physiol. 2011;588:4683–4693. doi: 10.1113/jphysiol.2010.199778. doi:jphysiol.2010.199778 [pii] 10.1113/jphysiol.2010.199778. [DOI] [PMC free article] [PubMed] [Google Scholar]
Associated Data
This section collects any data citations, data availability statements, or supplementary materials included in this article.