Abstract
Head movements are intimately involved in sound localization and may provide information that could aid an impaired auditory system. Using an infrared camera system, head position and orientation was measured for 17 normal-hearing and 14 hearing-impaired listeners seated at the center of a ring of loudspeakers. Listeners were asked to orient their heads as quickly as was comfortable toward a sequence of visual targets, or were blindfolded and asked to orient toward a sequence of loudspeakers playing a short sentence. To attempt to elicit natural orienting responses, listeners were not asked to reorient their heads to the 0° loudspeaker between trials. The results demonstrate that hearing-impairment is associated with several changes in orienting responses. Hearing-impaired listeners showed a larger difference in auditory versus visual fixation position and a substantial increase in initial and fixation latency for auditory targets. Peak velocity reached roughly 140 degrees per second in both groups, corresponding to a rate of change of approximately 1 microsecond of interaural time difference per millisecond of time. Most notably, hearing-impairment was associated with a large change in the complexity of the movement, changing from smooth sigmoidal trajectories to ones characterized by abruptly-changing velocities, directional reversals, and frequent fixation angle corrections.
I. INTRODUCTION
A stereotypical behavioural response to sound is to physically turn to its perceived direction. Even at only a few days of age, human infants involuntarily turn their heads toward a sound source (Muir and Field, 1979). In adults, the propensity for head movements varies from person to person, but most adults move their heads toward a sound source (Fuller, 1992). Such orientation behaviour may serve a number of purposes, including spatially centering the acoustic image of a sound, resolving front-back ambiguities, and bringing the visual system to bear on the source of the sound. There are clear benefits for listeners who turn to face a talker because of the associated visual cues: speech detection is easier when listeners are allowed to see a talker’s lip movements or related head movements (Grant and Seitz, 2000; Grant, 2001; Munhall et al., 2004). Pairing auditory and visual information can also increase speech comprehension scores (MacLeod and Summerfield, 1987; Schwartz et al., 2004); Middelweerd and Plomp (1987) found that adding visual information was equivalent to a 4 dB increase in signal to noise ratio, for both normal hearing and hearing impaired listeners. This increase in intelligibility provided by the visual system should be particularly useful for hearing-impaired listeners, as it would partly offset a real increase in signal to noise ratio that would otherwise be required to maintain intelligibility (Duquesnoy, 1983).
Beyond the cues provided by the visual system, it has been hypothesized that head movements themselves can play an important part in the processing of sound, particularly in determining source location (Wallach, 1940; Lambert, 1974). Head-movements permit higher accuracy in localizing sounds (Noble, 1981; Perrett and Noble, 1997a; b), even when these movements are non-voluntary (Thurlow and Runge, 1967). This phenomenon has also been demonstrated in rhesus monkeys and cats (Populin, 2006; Tollin et al., 2005). Conversely, when a listener’s head position is fixed, a number of errors can arise: front-back localization errors are more commonplace (Wightman and Kistler, 1999), localization accuracy is inversely correlated with a stimulus’ angular distance from the midline (Makous and Middlebrooks, 1990), and the apparent position of a sound shifts as a function of head angle (Lewald and Ehrenstein, 1998; Lewald et al., 2000). Head movements do not necessarily lead to an increase in accuracy, however; for instance, Leung et al., (2008) found that when very brief sounds are played during an ongoing head movement, localization accuracy is diminished.
It has long been known that listeners with a variety of hearing deficits have difficulties in accurately locating a sound source (Angell and Fite, 1901; Tonning, 1975; Hunig and Berg, 1990; Noble et al., 1994), and the presence of background noise can create further difficulties for those with hearing impairment (Lorenzi et al., 1999). Hearing-impaired listeners also have larger just-noticeable differences for interaural time and phase differences presented over headphones (Nilsson and Liden, 1976; Hawkins and Wightman, 1980; Rosenhall, 1985; Smith-Olinde et al., 1998). Kidd et al. (2005) demonstrated that when listeners know where a sound is coming from, they are better at speech recognition in multi-talker situations. Taken together with the localization accuracy benefit provided by head movements, it is reasonable to conclude that head movement may aid speech comprehension.
Although a number of studies have used head-pointing as a behavioural measure of sound localization accuracy (Perrott et al., 1987; Wightman and Kistler, 1989; Makous and Middlebrooks, 1990; Recanzone et al., 1998), only a few studies have explicitly examined the head movements themselves. Fuller (1996) found that gaze shifts (i.e., the combination of eye- and head-movements) in response to auditory stimuli were found to be larger in amplitude and slower in velocity than those in response to visual stimuli. In general, head velocity has been shown to increase as a function of jump size for either modality (Fuller, 1992). Zambarbieri et al. (1997) found that the relative contribution of head-movement to a gaze shift was slightly greater for auditory targets than for visual targets; this was also found by Populin et al. (2002), particularly for small shifts when the eyes are already pointed at the target. In contrast, Goldring et al. (1996) found no significant differences in the pattern of head movement when orienting towards auditory, visual, or audio/visual targets.
Given the effect that hearing loss has on sound localization, the potential benefits of head movement, and the lack of data on natural orienting responses, particularly in hearing-impaired listeners, we studied how hearing impairment affects orienting responses to speech sounds. The experiment was also intended to provide a baseline for future studies of the effects that head movements may have on the benefits of directional microphones and dynamic compression in modern hearing-aids, and of the effects those features may have on head movements themselves. In the experiment, each listener was seated at the center of a circular ring of loudspeakers and presented with sentences from a pseudo-random sequence of 11 loudspeakers in the front hemi-field. The listeners were asked to orient their heads as quickly as was comfortable in the direction of the loudspeaker they believed to be the source of the sound (specifically, they were asked to turn to face the active loudspeaker and remain fixated until they heard the next sentence). We measured each listener’s final fixation position, initial latency and fixation latency of movement, movement trajectory, and peak velocity. In a control condition, we measured performance for corresponding visual stimuli. The data were collected using an infrared-based motion capture system, which allowed us to measure head position at high precision (sub-millimeter) and sample rate (100 Hz).
II. METHOD
A. Listeners
Thirty-one listeners participated, including 14 hearing-impaired and 17 normal-hearing individuals. Their age ranged from 18-73 years old; the average age of our normal-hearing subjects was 29, while our hearing-impaired listeners averaged 58 years old. The hearing-impaired listeners, defined as those with a four frequency average (4FA) hearing threshold greater than 25 dB HL, averaged 43.5 dB of hearing loss, while the normal-hearing listeners had on average 7.8 dB of loss. One listener had 82 dB of hearing loss; her data is included in the figures as hourglass symbols, but not included in any statistical analyses. Those listeners who wore hearing aids were asked to remove them prior to the start of each experiment.
B. Apparatus
1. Sound generation and presentation
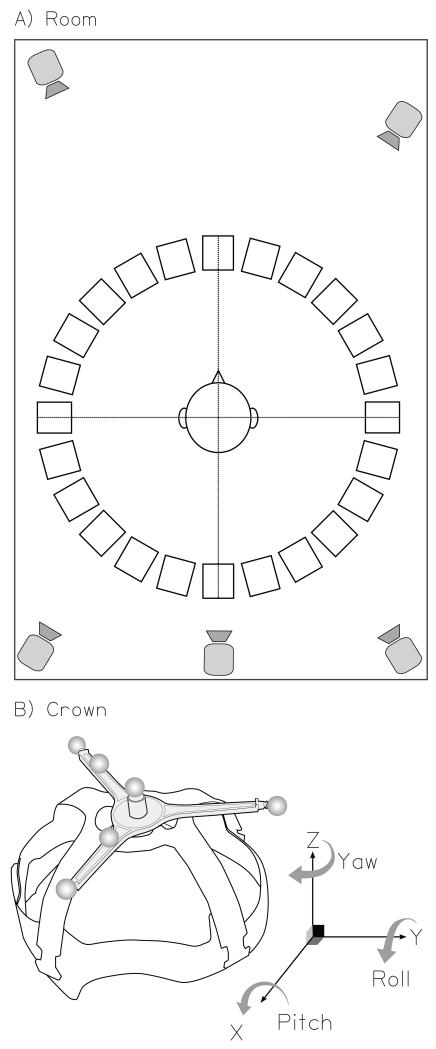
The experiment was run in a sound-treated room with an ambient noise level of approximately 37 dB(A) (Akeroyd et al., 2007). Figure 1A shows a schematic illustration of the apparatus in the room. Listeners sat at the center of a 360° ring of 24 active, self-powered, dual-driver loudspeakers (Phonic SEp207). The radius of the ring was 0.9 m, and the loudspeaker separation was 15°; the 0° loudspeaker was straight ahead of the listener. The audio stimuli were digitally generated on a PC and fed to a 24-channel digital audio interface (Mark of the Unicorn 2408 mk3), then routed through three 8-channel digital to analogue converters (Fostex VC-8), and then through a multi-channel mixing board (Behringer Ultralink Pro MX882) to the loudspeakers. The level of the each loudspeaker was regularly measured with a B&K 2260 Observer sound-level meter, using as a reference the A-weighted level of a lengthy 80 dB SPL octave band of noise centered at 1 kHz. The levels were then calibrated to ensure that the outputs of individual loudspeakers were within ±0.5 dB of the reference.
FIG. 1.
Schematic illustration of the experimental apparatus. (A) The acoustically-treated room showing the 360° loudspeaker ring, the 5 infrared motion-tracking cameras, and the listener’s approximate location in the room. (B) The head-mounted crown including reflective markers. This diagram also depicts the 3 Euler angles (yaw, pitch, and roll) and their respective axes of rotation. The directions of the arrows represent positive angles.
2. Head movement tracking
The motion tracking was performed using a commercial infrared camera system (Vicon MX3+). Five cameras were placed above the listener, behind and ahead, and were pointed towards the listener (see Figure 1A). The system tracked individual markers which were 9-mm diameter reflective balls. Markers were placed on three of the loudspeakers (at eccentricities1 of 0°, −60° and +60°), a head-mounted “crown”, and a wand. The loudspeaker markers provided reference directions, the crown was worn by the listeners throughout the experiment to measure where they were, and the wand was used at the beginning and end to determine the location of the ears and nose relative to the crown (see below). The crown was constructed by modifying the inside of a protective hard hat and placing six markers on top of it in an asymmetric, three-dimensional array (see Figure 1B). The crown was individually adjusted for each listener to give a snug and comfortable fit. The infrared markers were lightweight and did not encumber the listeners, and by not requiring physical tethers or measuring devices with prominent acoustic shadows, did not affect the natural acoustic environment of the listener.
C. Stimulus parameters and sequencing
The acoustic stimuli were 110 randomly selected sentences from the “ASL” (Adaptive Sentence List) corpus (MacLeod and Summerfield, 1987); these are short sentences about 1.3 seconds in duration (e.g., “The leaves fell from the trees”). They were presented sequentially from any one of the 11 loudspeakers in the front hemi-field (eccentricities of −75° to +75° in 15° increments). The interstimulus interval between sentences was varied randomly from 2.5 to 3.5 seconds. The total presentation time for each sequence was about six minutes. The stimulus level was randomly varied between 65 and 75 dB SPL (this was raised to 75 to 80 dB for the listener with the 82-dB average hearing threshold). The presentation order of the loudspeakers was determined by a modification of the de Bruijn sequence2 (de Bruijn, 1946; Brimijoin and O’Neill, 2005). The smallest jumps were 30°, the largest was 150°. Table 1 lists all the loudspeaker jumps used in the study; note that the total number of jumps of a given size was necessarily a function of jump size. Although they were included in the sequence of jumps, we did not analyze results for jumps larger than ±105° because of the small number of occurrences of these largest jumps. Twenty-five independent sequences were generated prior to the experiment and the particular sequence for each run was determined randomly at run-time.
TABLE I. Speaker Transitions / Effective Jump Sizes (degrees).
| Speaker 1 | Speaker 2 | ||||||||||
| −75 | −75 | −60 | −45 | −30 | −15 | 0 | +15 | +30 | +45 | +60 | +75 |
| −60 | +30 | +45 | +60 | +75 | +90 | +105 | +120* | +135* | +150* | ||
| −45 | −30 | +30 | +45 | +60 | +75 | +90 | +105 | +120* | +135* | ||
| −30 | −45 | −30 | +30 | +45 | +60 | +75 | +90 | +105 | +120* | ||
| −15 | −60 | −45 | −30 | +30 | +45 | +60 | +75 | +90 | +105 | ||
| 0 | −75 | −60 | −45 | −30 | +30 | +45 | +60 | +75 | +90 | ||
| +15 | −90 | −75 | −60 | −45 | −30 | +30 | +75 | +60 | +75 | ||
| +30 | −105 | −90 | −75 | −60 | −45 | −30 | +30 | +45 | +60 | ||
| +45 | −120* | −105 | −90 | −75 | −60 | −45 | −30 | +30 | +45 | ||
| +60 | −135* | −120* | −105 | −90 | −75 | −60 | −45 | −30 | +30 | ||
| +75 | −150* | −135* | −120* | −105 | −90 | −75 | −60 | −45 | −30 | ||
The visual stimuli were generated with red LEDs mounted atop each loudspeaker that were lit in a pseudo-random sequential order. Their presentation order and interstimulus interval was determined at run-time by one of the 25 modified de Bruijn sequences, thus matching the transitional statistics and overall duration of the sequences of acoustic stimuli. Once lit, an LED remained on until the next LED in the sequence had started; this was done so that if the next LED was outside their visual field, listeners could use the offset of the LED as a cue to initiate a movement.
To accurately synchronize the motion-tracking data to the stimuli, both visual stimuli and auditory stimuli were immediately preceded by a square wave pulse sent by the stimulus PC to the motion-tracking hardware.
D. Experimental tasks
Orientation data were collected for three tasks: visual (illuminated LEDs); audio, eyes-open (sentences); and audio, eyes-closed (sentences). Each task was performed twice and the data averaged. The task order was always visual/eyes-open/eyes-closed - visual/eyes-open/eyes-closed. In the visual task, listeners were told that one of the LEDs would be lit, and they were asked to point their heads toward the loudspeaker with the lit LED. Specifically, they were asked to point with an imaginary line drawn from the center of their heads through their nose to the loudspeaker. They were asked to continue to fixate the loudspeaker until the LED was turned off, at which point a new LED was lit. For both audio tasks, listeners were told the procedure was the same except that sentences would be used instead of LEDs. In the “eyes-open” condition they were allowed to see the loudspeakers, but in the “eyes closed” condition they were not; this was achieved by asking them to wear opaque safety glasses while endeavouring to keep their eyes closed. We found no significant differences between eyes-open and eyes-closed auditory trials in any of our measurements, and so the eyes-open data is not shown. In all tasks listeners were encouraged to move their heads as quickly as was comfortable for them.
Prior to the main experiments, listeners were given shortened versions of the three tasks while under observation from the experimenters. During this practice and training the experimenters encouraged the listeners to orient quickly and accurately and to maintain their fixation without drifting back towards the front center loudspeaker.
At the very beginning and end of the experiment, the wand was held in succession to the listener’s nose, right ear, and left ear. The resulting motion-tracking data were used to determine the position of the nose and ears relative to the center of the crown. From this information we determined the nominal center of the head and the acoustic axis through the nose.
E. Data analysis
The motion-tracking system returned 3-D Cartesian coordinates of all markers on all objects at a sample rate of 100 Hz, using the system’s own software (Vicon Nexus, version 1.3.109). The x,y,z origin of these coordinates and X,Y,Z axis orientation was set during an initial calibration exercise. The x,y,z position of the loudspeaker markers was used to compute a least-squares estimate of the geometric circle defined by the loudspeaker ring, and so determine the position of the loudspeakers relative to the motion tracking system. The positions of the crown markers were transformed via 3-D translation and rotation to a new coordinate system, based on the listener and the loudspeaker ring, whose origin was the nominal center of the head (derived from the wand data described above) and oriented such that the direction of a listener who perfectly faced the straight-ahead loudspeaker was 0°. This transformation removed any overall alignment discrepancies between the crown and the listener’s head. Note that five listeners were tested before we introduced loudspeaker tracking; their data was artificially corrected to set their mean fixation position to the 0° loudspeaker equal to 0°. These data are represented as stars in the relevant figures and are not included in the analysis of fixation position. For the other 26 listeners, absolute orientation with respect to the geometric circle defined by the loudspeaker ring is reported.
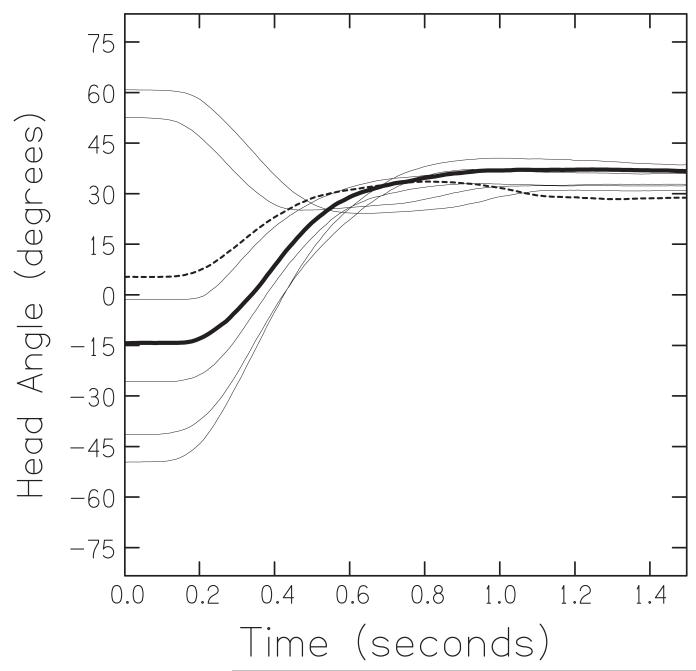
All the measurements derived from the motion-tracking data were based on a listener’s yaw angle, i.e., rotation about the Z, or vertical, axis (Figure 1B). These measurements were: the fixation position (in degrees), the peak velocity (in degrees per second), the initial latency of movement (in seconds), the final fixation latency (in seconds), the overshoot count, and the trajectory’s polynomial order. The fixation position for each loudspeaker was computed as the mean intersection between the listener’s acoustic axis after they were within ± 3° of their final resting position, and the geometric circle defined by the loudspeaker ring.3 The peak velocity, defined as the maximum rate of change of position during the motion, was computed via a first-order difference of the angular position after smoothing by a five-point (50 ms) Hanning window. The initial latency was calculated as the time taken after activation of the target for the listener to move their head by ± 3°. Similarly, the fixation latency was calculated as the time taken for their head to get to within ± 3° of their final resting position. An overshoot was defined as a head movement of more than a criterion amount of degrees past a listener’s ultimate fixation point before he/she reversed to fixate. As the process of choosing the criterion value is inherently arbitrary and its value greatly affects the overall counts, we counted overshoots using two different criteria, 7.5° and 3.25°, corresponding to ½ and ¼ of the angular separation of adjacent loudspeakers. The polynomial order was an overall metric of movement complexity: we used an iterative process to fit increasingly higher order polynomial functions to the movement trajectories until the prediction error estimate of the fit dropped below a value of 0.1 (via the Matlab “polyval” function). This gave the order of the simplest polynomial required to accurately fit each movement trajectory.4 (For example, the bold trajectory in Figure 2 was well fit by a 3rd order polynomial, while the dotted trajectory required a 4th order polynomial.)
FIG. 2.
A set of example movement trajectories of an individual representative of normal-hearing listeners. All trajectories are in the form of yaw angle as a function of time and represent movements in response to a sentence presented from the 45° loudspeaker. The solid and dashed lines highlight two illustrative trajectories.
III. RESULTS
A. Overview
Figure 2 shows an illustrative set of movement trajectories. The listener’s head angle is plotted in degrees of yaw relative to the 0° loudspeaker. The bold line shows a stereotypical sigmoidal trajectory. It is the trajectory of a blindfolded normal-hearing listener turning his head from a prior fixation on the −15° loudspeaker to a new sentence presented from the +45° loudspeaker. The listener initiated his head movement approximately 0.2 sec after the onset of the sentence, moved to the right, reached a peak velocity of about 120 degrees/sec, and had fixated at 36° by about 0.8 sec. As the target was at 45°, this fixation represents an “undershoot” of 9°. The dotted line is a movement trajectory from the +15° to the +45° loudspeaker. This movement was initiated within 0.2 sec, the listener’s head reached a peak velocity of about 90 degrees/sec, then “overshot” by about 5°, and returned to fixate at 29° by about 1.1 seconds. The other lines in Figure 2 show the remaining trajectories for loudspeaker jumps in which the listener was presented with a sentence from the 45° loudspeaker. It can be seen that individual trajectories often contained overshoots and varied in initial latency and fixation latency.
B. Fixation position
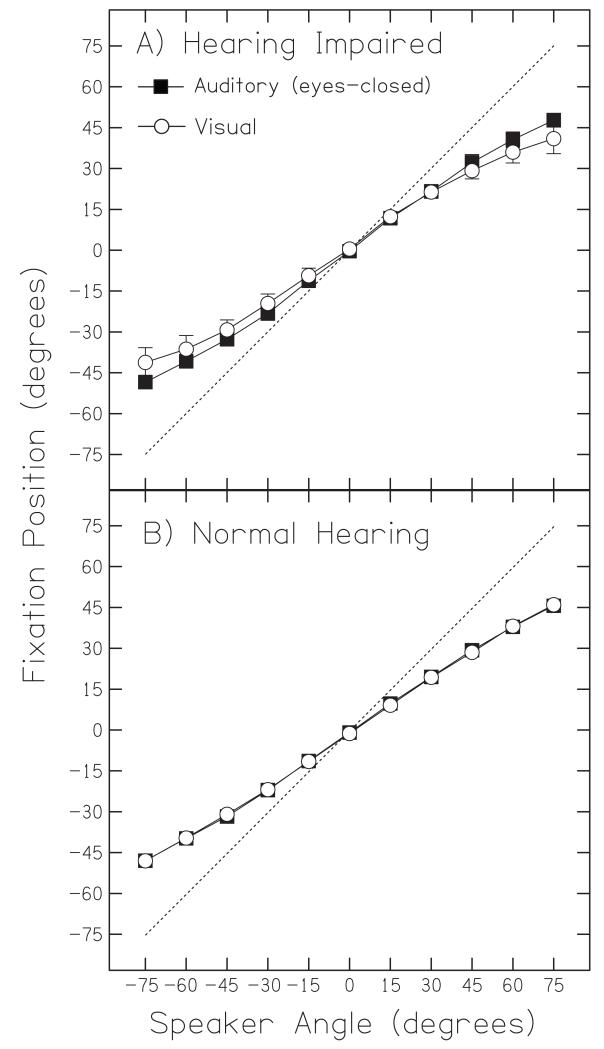
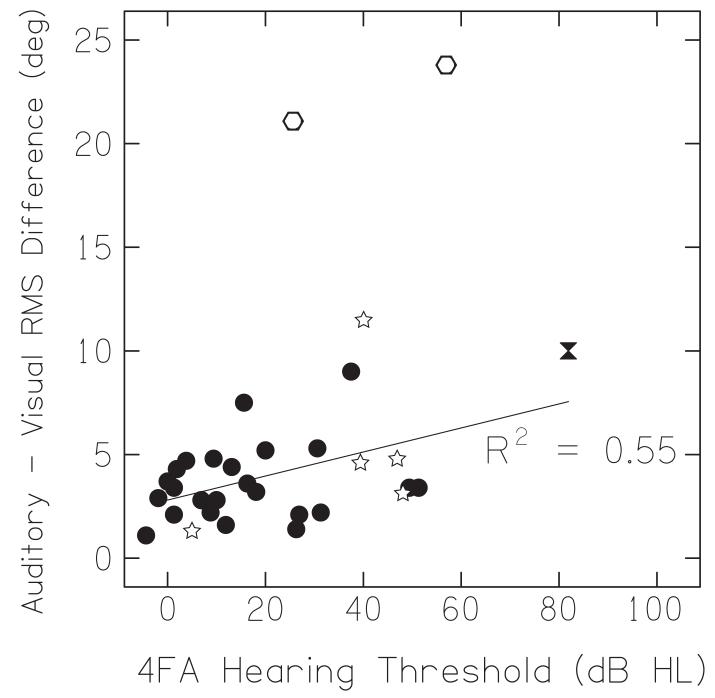
Figure 3 shows the average fixation positions for all listeners plotted as a function of target loudspeaker angle (error bars are standard error of the mean). The dashed line shows the ‘ideal’ orientation, i.e., a fixation perfectly on the target loudspeaker. When we examined average fixation position, we found that all listeners undershot both auditory targets (filled squares) and visual targets (open circles), and the amount of undershoot tended to increase as the loudspeaker eccentricity increased. We also found that hearing-impaired listeners appeared to undershoot auditory targets less than visual targets (Figure 3A). Normal-hearing listeners, on the other hand, tended to give equal undershoots to both auditory and visual targets (Figure 3B). This difference is emphasized in Figure 4, which plots the RMS difference in degrees between visual and auditory fixation position as a function of hearing loss. The tendency to make more eccentric responses — i.e., movements to larger azimuths — to auditory targets than visual targets increased with hearing loss, a correlation that was found to be statistically significant (Pearson r2 = 0.55, n = 24, p = 0.004). The open stars represent individuals whose fixation data had to be corrected so as to set their straight ahead orientation equal to 0°; these data were not included in analysis, but they were consistent with the other data. The two obvious outliers (at >15°) were also excluded from this correlation analysis because of inconsistencies in individual trajectories.
FIG. 3.
Group averages for auditory and visual fixation points. Mean fixation angle for all hearing-impaired (A) and normal-hearing (B) listeners in response to auditory (squares) and visual (circles) targets as a function of target loudspeaker angle. Error bars shown are standard error of the mean. The dotted line represents an ‘ideal’ orientation response, namely a fixation angle that precisely matched the target speaker angle.
FIG. 4.
Auditory versus visual fixation differences expressed as RMS error as a function of average hearing-impairment. Listeners whose 0° loudspeaker orientation was artificially centered (open stars), outlying listeners with inconsistent trajectories (open hexagons), and the listener with 82 dB hearing loss (represented by an hourglass in this and all subsequent figures) were not included in the analysis.
C. Peak velocity
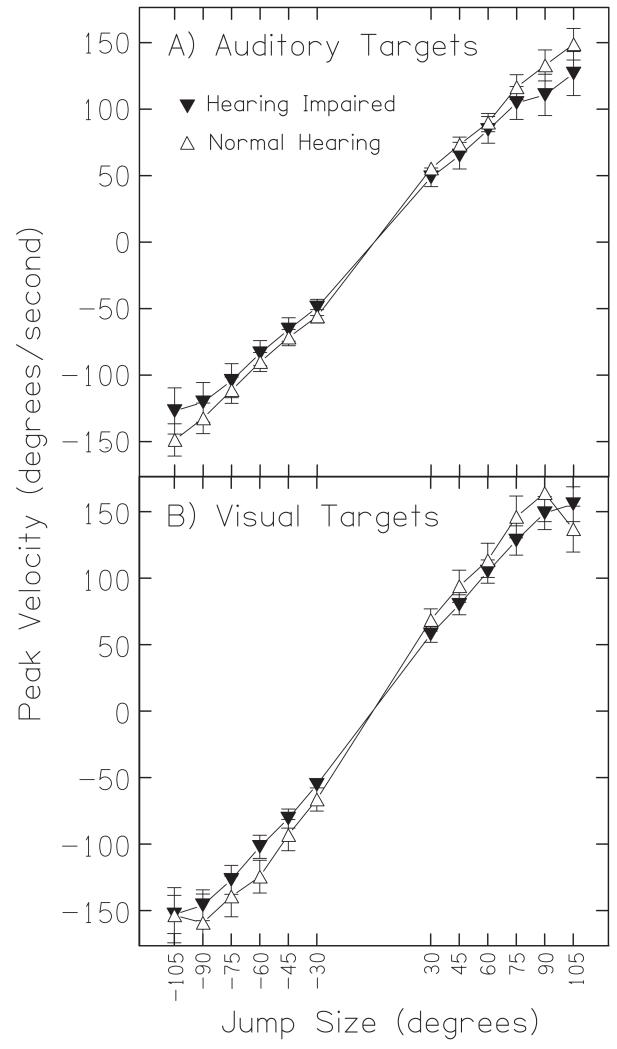
Figure 5A plots the peak velocity as a function of jump size for the auditory conditions. For both normal-hearing (open circles) and hearing-impaired listeners (filled squares), peak velocity depended markedly on jump size (Fuller, 1992). Small jump sizes (±30°) resulted in peak velocities of roughly 50 deg/sec for both hearing-impaired and normal-hearing listeners. The largest jump sizes (±105°) resulted in peak velocities of approximately ±150 deg/sec in normal-hearing and about ±130 deg/sec in hearing-impaired listeners; these values were not significantly different from one another (F(1,11) = 0.10, p = 0.76). The data in Figure 5B suggests that slightly higher velocities in response to visual targets were found for both normal-hearing and hearing-impaired listeners, but this effect was not statistically significant (F(1,11) = 0.17, p = 0.69).
FIG. 5.
Peak velocity for auditory and visual targets. The mean peak velocity for all hearing-impaired (squares) and normal-hearing listeners (circles) in response to auditory (A) and visual targets (B) is plotted as a function of jump size. Error bars shown are standard error of the mean. The gap in the x-axis corresponds to the small jumps that were not included in the loudspeaker sequence.
D. Response latency
1. Initial latency
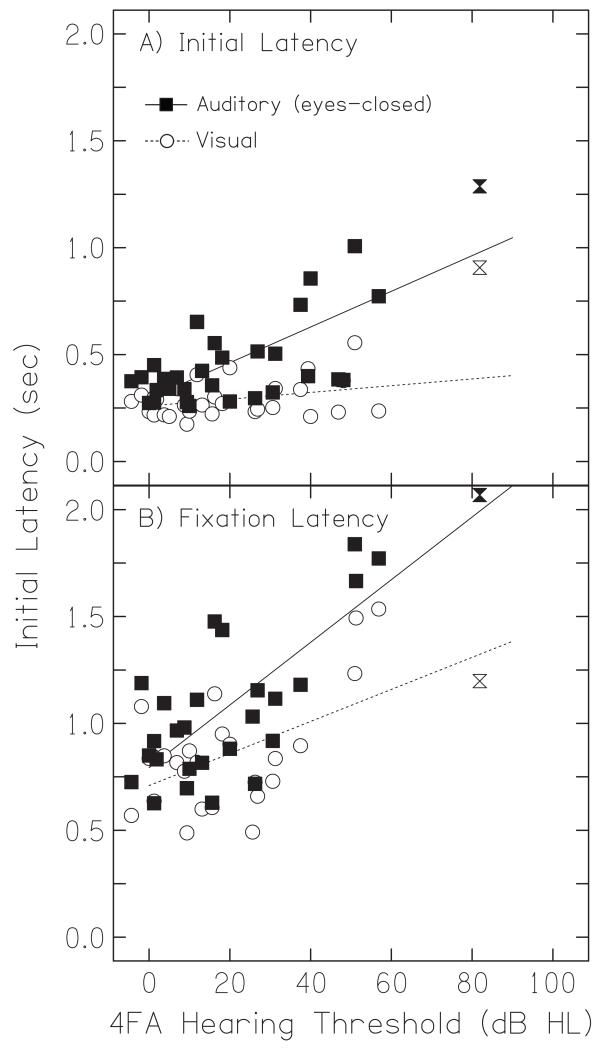
As there was no effect of jump size on either initial latency (F(1,11) = 0.31, p = 0.98) or fixation latency (F(1,11) = 0.18, p = 0.99), all latency data is presented as averages across all jump sizes. Figure 6A shows that the initial latency in response to auditory targets increased as a function of hearing loss; this correlation was relatively robust (Pearson’s r2 = 0.51, n = 28, p < 0.01). On average, the initial latency of normal-hearing listeners in response to auditory targets was 0.4 seconds, while that of hearing-impaired listeners was 0.6 seconds. The initial latency to visual targets, however, did not depend on hearing loss (Pearson’s r2 = 0.17, n = 28, p = 0.39). The average initial latency for visual targets for normal-hearing listeners was 0.3 seconds while for hearing-impaired listeners it was 0.4 seconds.
FIG. 6.
Response latencies for auditory and visual targets. Initial latency (A) and fixation latency (B) in response to auditory (squares) and visual targets (circles) is plotted as a function of hearing-loss. Linear regressions for auditory (solid line) and visual targets (dashed line) are plotted in both panels. Data points for the listener with the most severe loss are plotted as hourglass symbols but were not included in the regression.
2. Fixation latency
Figure 6B shows that the fixation latency in response to auditory targets also increased as a function of hearing loss (Pearson’s r2 = 0.56, n = 28, p < 0.01). On average, the fixation latency of normal-hearing listeners in response to auditory targets was 0.9 seconds, while that of hearing-impaired listeners was 1.2 seconds. Unlike initial latency, fixation latency to visual targets also increased with increasing hearing loss (Figure 7B, Pearson’s r2 = 0.50, n = 28, p < 0.01), although the statistical significance of this increase was due solely to two listeners with somewhat erratic trajectories. The average fixation latency for visual targets for normal-hearing listeners was 0.8 seconds while for hearing-impaired listeners it was 1.0 seconds.
FIG. 7.
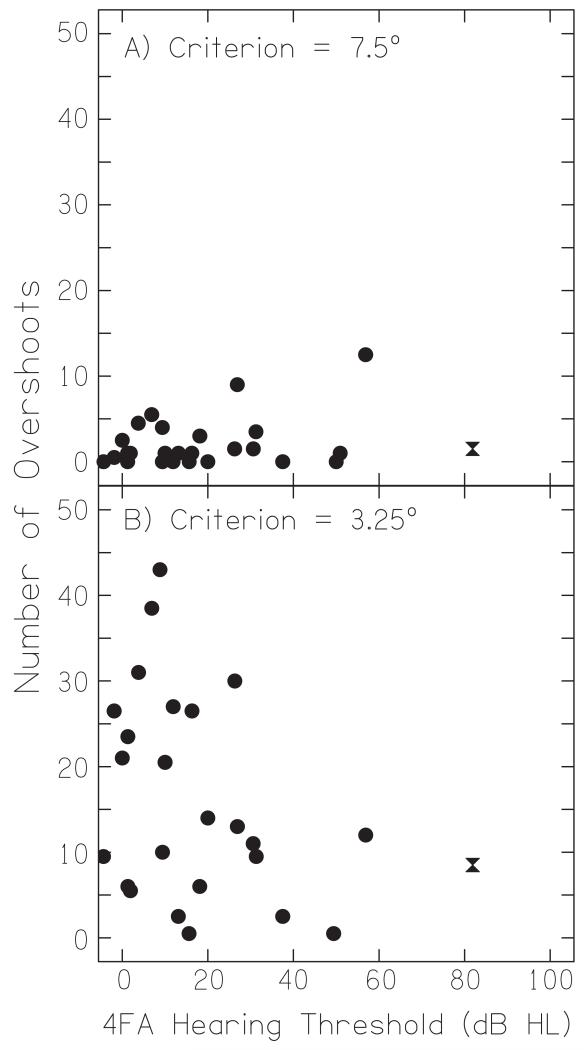
Overshoot counts for auditory targets. (A) The mean number of overshoots as calculated using the criterion of 3.25° is plotted as function of hearing-loss (B) The mean number of overshoots as calculated using the less stringent criterion of 7.5°. The hourglass symbol shows data for the listener with the most severe loss.
E. Overshoots
Figure 7A shows the number of overshoots for each listener when calculated using the 7.5° criterion. Apart from an apparent increase in individual differences as a function of hearing-impairment, there was no correlation between the tendency to overshoot and the degree of hearing loss (Pearson’s r2 = 0.14, n = 28, p = 0.47). For the less stringent criterion of 3.25° (Figure 7B), the total number of overshoots was larger but there was still no significant association with hearing-loss (Pearson’s r2 = −0.35, n = 28, p = 0.09).
F. Trajectory polynomial order
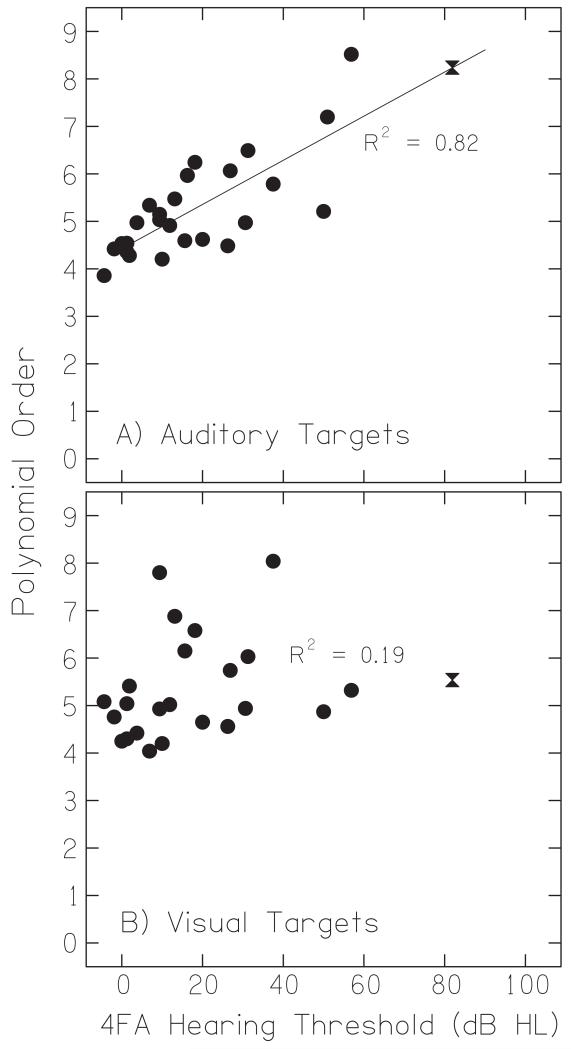
The stereotypical movement trajectory was sigmoidal in shape, reaching peak velocity at the halfway point between movement onset and cessation (see Figure 2). Many trajectories, however — and particularly those of hearing-impaired listeners — contained reversals of direction, inconsistent variations in velocity over time, and, generally, were highly heterogeneous from listener to listener. Figure 8A plots the polynomial order, a quantification of complexity, as a function of hearing loss. A strong correlation was found between the polynomial order during auditory trials and a listener’s degree of hearing loss (Pearson’s r2 = 0.82, n = 28, p < 0.001), indicating that the trajectories got more complex as hearing loss increased. For every 20 dB of additional hearing loss, the mean polynomial order required to accurately fit a listener’s trajectories increased by approximately 1. Figure 8B plots the polynomial order for visual trials as a function of hearing loss. Polynomial order for visual trials was not significantly correlated with hearing loss (Pearson’s r2 = 0.19, n = 28, p = 0.35).
FIG. 8.
Trajectory complexity for auditory targets. Mean polynomial order — a quantification of trajectory shape— is plotted as a function of hearing loss for auditory targets (A) and visual targets (B). The hourglass symbol shows data for the listener with the most severe loss.
G. Age and Orienting Responses
Although there was an overall correlation between age and hearing loss for our listeners (Pearson’s r2 = 0.72, n = 28, p < 0.001), age was not significantly correlated with the peak velocity, the visual initial latency, the auditory initial latency, the visual fixation latency, or the number of overshoots for either the 7.5° or 3.25° criteria (respectively Pearson’s r2 = 0.03, 0.34, 0.36, 0.30, 0.25, 0.21; n = 28; all p > 0.05). Trajectory complexity, on the other hand, was significantly correlated with age (Pearson’s r2 = 0.49, n = 28, p < 0.05), but not as strongly correlated as it was with hearing loss. Age was also significantly correlated with fixation latency for auditory targets (Pearson’s r2 = 0.46, n = 28, p < 0.05).
IV. DISCUSSION
A. Overview
The intent behind this study was to document the natural orienting responses of hearing-impaired versus normal-hearing listeners to visual and auditory targets. The most dramatic hearing loss-related changes in orienting responses were found in the shape of a listener’s movement trajectory over time, as demonstrated by the robust correlation between polynomial order for auditory targets and the degree of hearing impairment. This change in polynomial order — a quantification of the complexity of a movement trajectory — demonstrates that normal-hearing listeners tended to exhibit smoother, more sigmoidal movement trajectories than did hearing-impaired listeners, whose trajectories were often characterized by abruptly changing velocities, reversals of direction, and frequent corrections in fixation angle. These changes were consistent with the larger fixation latencies seen in hearing-impaired listeners. All the other measures of orienting responses described above essentially represent different aspects of trajectory complexity; while these measures provide a more descriptive explanation of what changes were associated with hearing impairment, individually they were less strongly correlated with hearing impairment. These effects may be due to one (or both) of two sources: (1), a hearing-impaired listener’s increased uncertainty of the location of a given sound source, resulting in a number of correcting movements, or (2), a compensatory strategy used by hearing-impaired listeners to extract maximal information from an effectively quieter environment. The present data does not distinguish between these two possibilities, leaving this question open for future research.
B. Fixation Angle
All listeners tended to undershoot both auditory and visual targets, and the amount of undershoot increased as a function of target azimuth. The auditory and visual fixation positions for normal-hearing listeners were the same, a finding in agreement with Goldring et al. (1996), but somewhat at odds with Zambarbieri et al. (1997)’s results that showed that fixation positions for auditory targets are slightly more eccentric than those for visual targets. Hearing-impaired listeners on the other hand, tended to undershoot auditory targets less than corresponding visual targets, and this discrepancy increased with loudspeaker eccentricity. This implies that hearing-impaired listeners made more accurate auditory orienting responses than normal-hearing listeners. But the actual sizes of the auditory movements did not differ across the two groups: instead, the difference lay in the sizes of their visual movements. Thus, only if one defined the visual orienting response as the spatially-veridical reference for head-pointing — instead of the actual direction of loudspeakers — then hearing impairment is associated with larger auditory orienting responses.
C. Movement Latency
The initial latency of head movements in response to auditory targets increased by roughly 10 ms per dB of hearing impairment. Although simple reaction time has been shown to increase as a function of decreasing stimulus level (Wynn, 1977; van der Molen and Keuss, 1979), it does so at a reduced rate — of the order of 1 to 2 ms per dB — provided the stimulus level is not at or very near threshold. Since the stimulus level was at least 10 dB above hearing threshold for all listeners save one, the changes in initial movement latency are unlikely to be attributable to a sensation level-dependent increase in simple reaction time. Zambarbieri et al. (1997) found that the initial latency of head movements toward auditory targets near the midline was longer than that for visual targets, but shorter than visual for more eccentric targets. In contrast to this, we did not find any effect of target eccentricity on auditory initial latency. We are unsure as to the source of this discrepancy, although it may simply reflect individual differences between listeners or differences in method: for instance, Zambarbieri et al. required listeners to reorient to the 0° loudspeaker between each trial, but we did not.
D. Peak Velocity
For peak velocity, no significant difference between normal-hearing and hearing-impaired listeners was observed. Given that, to a first approximation, interaural time difference (ITD) is proportional to head angle, with a rate of change of approximately 7.5 microseconds per degree (Feddersen et al., 1957; Woodworth, 1938), the peak velocities found during the largest jumps (± 105°) by normal-hearing and hearing-impaired listeners thus correspond to maximal rates of change of approximately 1100 and 1000 microseconds per second, respectively. These values — which can be conveniently further approximated to a value of about one microsecond of ITD per millisecond of time— represent the largest rate of change in ITDs that are typically experienced during a natural orienting movement to a sound source.
E. Rotations about the X and Y axes (Pitch and Roll)
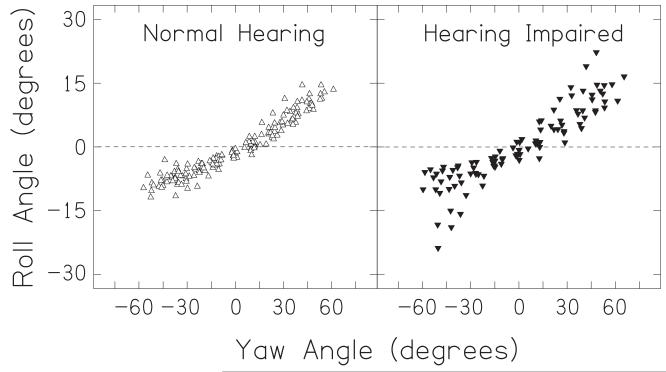
Although our analyses have concentrated on measurements of yaw, as yaw corresponds to rotations within the plane of the speakers and to normal rotations of the head about the spinal column, the equipment also allowed us to measure pitch and roll. We found that pitch varied on average by only 1.9 ± 1.0° over the course of an orienting movement, and was not systematically related to yaw. Roll, however, was highly correlated with yaw (Pearson’s r2 = 0.93, n = 286, p < 0.001). Figure 9 shows the roll values for each trial and listener as a function of the yaw. It can be seen that, on average, when the head was yawed furthest to the right the head was rolled down towards the right shoulder by approximately 10°; when the head was yawed furthest to the left, the head was rolled down to the left shoulder by approximately 7°. This linkage of roll and yaw was the same for both normal hearing and hearing-impaired listeners. While the linkage is likely due simply to constraints of the anatomy of the skeleton and musculature, it introduces azimuth-dependent changes in elevation and thus the head-related transfer function experienced by the listener. These changes in elevation are dependent on the amount a listener’s yaw undershoots the target position as well as their amount of roll. For example, suppose a listener orients to a target with an actual azimuth of 90° and an elevation of 0°. If that listener yaws 45° towards the target and rolls by 10° to the right then the listener will experience the sound source at an azimuth of +45° and an elevation of +5°. The roll-induced change in effective elevation angle at both ears varies linearly as a function of yaw undershoot, from 0° at no yaw undershoot to an elevation equal to the amount of roll at 90° yaw undershoot. In practice this interaction may be yet more complex, as the illustrative example above assumes the sound source is infinitely far away. Any rolls relative to a nearby talker will create interaurally-asymmetrical elevation differences that depend on sound source distance, particularly for distances less than a meter where distance-dependant interaural time difference and interaural level difference effects are also prominent (Brungart et al., 1999). The interaction between yaw and roll in head turns as opposed to body turns – or other turns without a roll component – may be of importance to ongoing work in virtual acoustics.
FIG. 9.
Head roll plotted as a function of head yaw for all listeners. Roll varies as a function of yaw for both normal-hearing (left) and hearing-impaired listeners (right).
F. Statistical Control of Sequential Movements
Part of our goal was to measure the head movements that would be seen in a natural situation, for instance in following a conversation among multiple people in a restaurant. In attempting to simulate a natural listening situation in the laboratory, we opted to ask the listeners to move from one target immediately to the next, instead of requiring that they reorient towards the 0° degree loudspeaker between each trial. This paradigm potentially suffers from a loss of control in loudspeaker jump size. By controlling for transitional probabilities, the modified de Bruijn sequence (de Bruijn, 1946) allows a parametric analysis of both head-position as a function of loudspeaker location and head-velocity as a function of jump size, because the number of jumps of each size is explicitly controlled. A potential confound arises, however, when a listener incorrectly orients to one speaker: the effective size of the following loudspeaker jump may be altered. To counter this, multiple exemplars of each jump size were used and the effect of any isolated misorientation was thus reduced via averaging. Given that hearing impairment was not found to significantly affect peak velocity, a measure known to be directly dependent on jump size (Fuller, 1992), it is unlikely that jump-size errors were a significant problem.
G. Causes of Increased Movement Complexity
There are a number of potential sources of the observed increase in movement complexity and initial response latency. The first was an increase in the uncertainty of the target location. The levels used were at least 10 dB above hearing threshold for all participants (save one, whose data was excluded), but the fixed presentation level of approximately 70 dB SPL resulted in a higher sensation level for normal-hearing listeners. The quieter sounds may have resulted in initial directional confusion, but sensation level may not have been solely responsible for the increase in movement complexity. Simpson et al. (2005) assessed the effects of hearing protection on the measured head movements of listeners performing an auditory-cued visual search task. They found that the combination of ear plugs and earmuffs significantly increased the amount of head movement elicited during the search task, even when auditory stimuli were increased in sensation level to match that of the unoccluded condition. The reduction in the quality of directional cues caused by hearing protection is not strictly analogous to hearing-impairment, but any degradation in spectral or binaural cues to sound source location might be expected to cause directional confusion. Another possible source was a learned behavioral search response. Given the localization advantage that is conferred on listeners who are allowed to move their heads, it is reasonable to expect that some hearing-impaired listeners might develop a strategy to use exploratory head movements to better determine sound source location. Use of this strategy in the laboratory could account for the changing velocities, directional reversals, and fixation angle corrections that we observed.
H. Orientation and Age
There was a significant correlation between age and hearing loss for our listeners, leading to a potential confound. Age on its own was not significantly correlated with the peak velocity, the auditory initial latency, the visual initial latency, the visual fixation latency, or the number of overshoots for either the 7.5° or 3.25° criteria. Trajectory complexity and fixation latency for auditory targets, on the other hand, were correlated with age, albeit less so than with hearing loss. All these measures are directly related to the cognitive and motor demands of the orienting task. That age was correlated with some of them suggests that it may have been a contributing factor to the trajectory differences observed in this study, but was not the primary cause. Despite the difference in critical movement-related measures, it is nonetheless impossible to completely untangle age and hearing-impairment given the nature of the listener pool. Overall, the orienting differences observed are most safely interpreted as being the consequence of age-related hearing-impairment, but future research may be necessary.
V. CONCLUSIONS
Overall, the results demonstrate that hearing impairment is associated with several differences in orienting responses, primarily a change in head movement trajectories towards more complex trajectories and an increase in latency. Subtle changes were observed in fixation position, but no changes were observed in peak velocity. The fastest head movements corresponded to rate of change of roughly 1 microsecond of ITD per millisecond of time. These results suggest that the most important difference in orienting responses comes not in where a listener finishes a head movement, but in the dynamics of the movement itself.
In the current study, those listeners who wore hearing-aids were asked to remove them prior to the experiment; this was done so as to avoid conflating sound localization ability with hearing-aid directionality. Motion-tracking of auditory orienting behaviour is, however, of particular relevance to the use of hearing aids, especially those with directional microphones. Head orientation angle is critical for listeners who use directional hearing aids as the maximal advantage in signal-to-noise ratio is only conferred when the listener is facing the sound source and the noise is located in the null of the microphone (Ricketts, 2000). Any head movements thus result in a potentially confusing orientation-dependent shift in signal-to-noise ratio over time. Future studies should address the effects of directional hearing aids on orienting behavior and speech comprehension in hearing-impaired listeners.
ACKNOWLEDGMENT
The Scottish Section of IHR is supported by intramural funding from the Medical Research Council and the Chief Scientist Office of the Scottish Government. The authors would also like to thank Ruth Litovsky and three anonymous reviewers for their invaluable comments on early drafts of this manuscript.
Footnotes
The “eccentricity” is the angular distance (in azimuth) of each loudspeaker from straight ahead. Positive values are to the right and negative values to the left of the 0° loudspeaker.
A de Bruijn sequence is a pseudo-random ordered set of arbitrary characters. The defining feature of a de Bruijn sequence is that it contains an equal number of occurrences of each character as well as an equal number of every possible sequential combination of characters, up to a specified subsequence length. A sequence of N characters with a subsequence length of L would be NL characters in length, contain N(L-1) examples of each character, N(L-2) examples of each pair of characters, N(L-3) examples of each possible triplet of characters, and so on. One example of a 32 sequence is “CBBCABAAC”, a second example is “ACBBCCABA.” Note that the sequences are circular, in that one “pair” is actually the pairing of the last character and the first character. We used a modified 112 sequence, which excluded any pairs of loudspeakers whose within-pair eccentricity differences were less than 30°, while still requiring that each loudspeaker was used an equal number of times and each allowed pair (i.e., transition from one loudspeaker to the next) appeared once. All example sequences were generated with a custom-written Matlab function.
The threshold value of 3° for defining the start and end of the movement phase was chosen empirically for its combination of its reliability and its insensitivity to minor, random head-movements.
In spite of the fact that the majority of trajectories were sigmoidally-shaped, a polynomial function was chosen over a sigmoid as it was found that sigmoid functions fitted to trajectory data often suffered from conditioning problems.
References
- Akeroyd MA, Gatehouse S, Blaschke J. The detection of differences in the cues to distance by elderly hearing-impaired listeners. J. Acoust. Soc. Am. 2007;121:1077–1089. doi: 10.1121/1.2404927. [DOI] [PMC free article] [PubMed] [Google Scholar]
- Angell JR, Fite W. The Monaural Localization of Sounds. Psychol. Rev. 1901;8:225–246. [Google Scholar]
- Brimijoin WO, O’Neill WE. Measuring Inhibition and Facilitation in the Inferior Colliculus Using Vector-Based Analysis of Spectrotemporal Receptive Fields. Advances and Perspectives in Auditory Neurophysiology (abstracts) 2005;3 [Google Scholar]
- Brungart DS, Durlach NI, Rabinowitz WM. Auditory localization of nearby sources. II. Localization of a broadband source. J. Acoust. Soc. Am. 1999;106:1956–1968. doi: 10.1121/1.427943. [DOI] [PubMed] [Google Scholar]
- de Bruijn NG. A Combinatorial Problem. Koninklijke Nederlandse Akademie v. Wetenschappen. 1946;49:758–764. [Google Scholar]
- Duquesnoy AJ. The intelligibility of sentences in quiet and in noise in aged listeners. J. Acoust. Soc. Am. 1983;74:1136–1144. doi: 10.1121/1.390037. [DOI] [PubMed] [Google Scholar]
- Feddersen WE, Sandel TT, Teas DC, Jeffress LA. Localization of high-frequency tones. J. Acoust. Soc. Am. 1957;29:988–991. [Google Scholar]
- Fuller JH. Head movement propensity. Exp. Brain. Res. 1992;92:152–164. doi: 10.1007/BF00230391. [DOI] [PubMed] [Google Scholar]
- Fuller JH. Comparison of horizontal head movements evoked by auditory and visual targets. J. Vestib. Res. 1996;6:1–13. [PubMed] [Google Scholar]
- Goldring JE, Dorris MC, Corneil BD, Ballantyne PA, Munoz DP. Combined eye-head gaze shifts to visual and auditory targets in humans. Exp. Brain Res. 1996;111:68–78. doi: 10.1007/BF00229557. [DOI] [PubMed] [Google Scholar]
- Grant KW. The effect of speechreading on masked detection thresholds for filtered speech. J. Acoust. Soc. Am. 2001;109:2272–2275. doi: 10.1121/1.1362687. [DOI] [PubMed] [Google Scholar]
- Grant KW, Seitz PF. The use of visible speech cues for improving auditory detection of spoken sentences. J. Acoust. Soc. Am. 2000;108:1197–1208. doi: 10.1121/1.1288668. [DOI] [PubMed] [Google Scholar]
- Hawkins DB, Wightman FL. Interaural time discrimination ability of listeners with sensorineural hearing loss. Audiology. 1980;19:495–507. doi: 10.3109/00206098009070081. [DOI] [PubMed] [Google Scholar]
- Hunig G, Berg M. “Richtungshören von Patienten mit seitenungleichem Hörvermögen,” (“Sound localization in patients with asymmetrical hearing loss”) Audiolog. Akustik. 1990;29:86–97. [Google Scholar]
- Kidd G, Jr., Arbogast TL, Mason CR, Gallun FJ. The advantage of knowing where to listen. J. Acoust. Soc. Am. 2005;118:3804–3815. doi: 10.1121/1.2109187. [DOI] [PubMed] [Google Scholar]
- Lambert RM. Dynamic theory of sound-source localization. J. Acoust. Soc. Am. 1974;56:165–171. doi: 10.1121/1.1903248. [DOI] [PubMed] [Google Scholar]
- Leung J, Alais D, Carlile S. Compression of auditory space during rapid head turns. Proc. Natl. Acad. Sci. U S A. 2008;105:6492–6497. doi: 10.1073/pnas.0710837105. [DOI] [PMC free article] [PubMed] [Google Scholar]
- Lewald J, Dorrscheidt GJ, Ehrenstein WH. Sound localization with eccentric head position. Behav. Brain Res. 2000;108:105–125. doi: 10.1016/s0166-4328(99)00141-2. [DOI] [PubMed] [Google Scholar]
- Lewald J, Ehrenstein WH. Influence of head-to-trunk position on sound lateralization. Exp. Brain Res. 1998;121:230–238. doi: 10.1007/s002210050456. [DOI] [PubMed] [Google Scholar]
- Lorenzi C, Gatehouse S, Lever C. Sound localization in noise in hearing-impaired listeners. J. Acoust. Soc. Am. 1999;105:3454–3463. doi: 10.1121/1.424672. [DOI] [PubMed] [Google Scholar]
- MacLeod A, Summerfield Q. Quantifying the contribution of vision to speech perception in noise. Br. J. Audiol. 1987;21:131–141. doi: 10.3109/03005368709077786. [DOI] [PubMed] [Google Scholar]
- Makous JC, Middlebrooks JC. Two-dimensional sound localization by human listeners. J. Acoust. Soc. Am. 1990;87:2188–2200. doi: 10.1121/1.399186. [DOI] [PubMed] [Google Scholar]
- Middelweerd MJ, Plomp R. The effect of speechreading on the speech-reception threshold of sentences in noise. J. Acoust. Soc. Am. 1987;82:2145–2147. doi: 10.1121/1.395659. [DOI] [PubMed] [Google Scholar]
- Muir D, Field J. Newborn infants orient to sounds. Child Dev. 1979;50:431–436. [PubMed] [Google Scholar]
- Munhall KG, Jones JA, Callan DE, Kuratate T, Vatikiotis-Bateson E. Visual prosody and speech intelligibility: head movement improves auditory speech perception. Psychol. Sci. 2004;15:133–137. doi: 10.1111/j.0963-7214.2004.01502010.x. [DOI] [PubMed] [Google Scholar]
- Nilsson R, Liden G. Sound localization with phase audiometry. Acta Otolaryngol. 1976;81:291–299. doi: 10.3109/00016487609119965. [DOI] [PubMed] [Google Scholar]
- Noble W, Byrne D, Lepage B. Effects on sound localization of configuration and type of hearing impairment. J. Acoust. Soc. Am. 1994;95:992–1005. doi: 10.1121/1.408404. [DOI] [PubMed] [Google Scholar]
- Noble WG. Earmuffs, exploratory head movements, and horizontal and vertical sound localization. J. Aud. Res. 1981;21:1–12. [PubMed] [Google Scholar]
- Perrett S, Noble W. The contribution of head motion cues to localization of low-pass noise. Percept. Psychophys. 1997a;59:1018–1026. doi: 10.3758/bf03205517. [DOI] [PubMed] [Google Scholar]
- Perrett S, Noble W. The effect of head rotations on vertical plane sound localization. J. Acoust. Soc. Am. 1997b;102:2325–2332. doi: 10.1121/1.419642. [DOI] [PubMed] [Google Scholar]
- Perrott DR, Ambarsoom H, Tucker J. Changes in head position as a measure of auditory localization performance: Auditory psychomotor coordination under monaural and binaural listening conditions. J. Acoust. Soc. Am. 1987;82:1637–1645. doi: 10.1121/1.395155. [DOI] [PubMed] [Google Scholar]
- Populin LC. Monkey Sound Localization: Head-Restrained versus Head-Unrestrained Orienting. J. Neurosci. 2006;26:9820–9832. doi: 10.1523/JNEUROSCI.3061-06.2006. [DOI] [PMC free article] [PubMed] [Google Scholar]
- Populin LC, Tollin DJ, Weinstein JM. Human gaze shifts to acoustic and visual targets. Ann. N. Y. Acad. Sci. 2002;956:468–473. doi: 10.1111/j.1749-6632.2002.tb02857.x. [DOI] [PubMed] [Google Scholar]
- Recanzone GH, Makhamra SD, Guard DC. Comparison of relative and absolute sound localization ability in humans. J. Acoust. Soc. Am. 1998;103:1085–1097. doi: 10.1121/1.421222. [DOI] [PubMed] [Google Scholar]
- Ricketts T. The impact of head angle on monaural and binaural performance with directional and omnidirectional hearing aids. Ear and hearing. 2000;21:318–328. doi: 10.1097/00003446-200008000-00007. [DOI] [PubMed] [Google Scholar]
- Rosenhall U. The influence of hearing loss on directional hearing. Scand. Audiol. 1985;14:187–189. doi: 10.3109/01050398509045940. [DOI] [PubMed] [Google Scholar]
- Schwartz JL, Berthommier F, Savariaux C. Seeing to hear better: evidence for early audio-visual interactions in speech identification. Cognition. 2004;93:B69–78. doi: 10.1016/j.cognition.2004.01.006. [DOI] [PubMed] [Google Scholar]
- Simpson BD, Bolia RS, McKinley RL, Brungart DS. The impact of hearing protection on sound localization and orienting behavior. Human Factors. 2005;47:188–198. doi: 10.1518/0018720053653866. [DOI] [PubMed] [Google Scholar]
- Smith-Olinde L, Koehnke J, Besing J. Effects of sensorineural hearing loss on interaural discrimination and virtual localization. J. Acoust. Soc. Am. 1998;103:2084–2099. doi: 10.1121/1.421355. [DOI] [PubMed] [Google Scholar]
- Thurlow WR, Runge PS. Effect of induced head movements on localization of direction of sounds. J. Acoust. Soc. Am. 1967;42:480–488. doi: 10.1121/1.1910604. [DOI] [PubMed] [Google Scholar]
- Tollin DJ, Populin LC, Moore JM, Ruhland JL, Yin TCT. Sound-localization performance in the cat: The effect of restraining the head. J. Neurophysiol. 2005;93:1223–1234. doi: 10.1152/jn.00747.2004. [DOI] [PubMed] [Google Scholar]
- Tonning FM. Auditory localization and its clinical applications. Audiology. 1975;14:368–380. doi: 10.3109/00206097509071750. [DOI] [PubMed] [Google Scholar]
- van der Molen MW, Keuss PJ. The relationship between reaction time and intensity in discrete auditory tasks. The Quarterly journal of experimental psychology. 1979;31:95–102. doi: 10.1080/14640747908400709. [DOI] [PubMed] [Google Scholar]
- Wallach H. The role of head movements and vestibular and visual cues in sound localization. J. Exp. Psychol. 1940;27:339–367. [Google Scholar]
- Wightman FL, Kistler DJ. Headphone simulation of free-field listening.II Psychophysical validation. J. Acoust. Soc. Am. 1989;85:868–878. doi: 10.1121/1.397558. [DOI] [PubMed] [Google Scholar]
- Wightman FL, Kistler DJ. Resolution of front-back ambiguity in spatial hearing by listener and source movement. J. Acoust. Soc. Am. 1999;105:2841–2853. doi: 10.1121/1.426899. [DOI] [PubMed] [Google Scholar]
- Woodworth RS. Experimental psychology. Holt; New York: 1938. [DOI] [PubMed] [Google Scholar]
- Wynn VT. Simple reaction time--evidence for two auditory pathways to the brain. J. Aud. Res. 1977;17:175–181. [PubMed] [Google Scholar]
- Zambarbieri D, Schmid R, Versino M, Beltrami G. Eye-head coordination toward auditory and visual targets in humans. J. Vestib. Res. 1997;7:251–263. [PubMed] [Google Scholar]


