

Abstract
Background
Clinical practice focuses on the primary prevention of cardiovascular (CV) disease (CVD) through the modification and pharmacological treatment of elevated risk factors. Prediction models based on established risk factors are available for use in the primary prevention setting. However, the prevention of risk factor development through healthy lifestyle behaviors, or primordial prevention, is of paramount importance to achieve optimal population‐wide CV health and minimize long‐term CVD risk.
Methods and Results
We developed a lifestyle‐based CVD prediction model among 61 025 women in the Nurses’ Health Study and 34 478 men in the Health Professionals Follow‐up Study, who were free of chronic disease in 1986 and followed for ≤24 years. Lifestyle factors were assessed by questionnaires in 1986. In the derivation step, we used the Bayes Information Criterion to create parsimonious 20‐year risk prediction models among a random two thirds of participants in each cohort separately. The scores were validated in the remaining one third of participants in each cohort. Over 24 years, there were 3775 cases of CVD in women and 3506 cases in men. The Healthy Heart Score included age, smoking, body mass index, exercise, alcohol, and a composite diet score. In the validation cohort, the risk score demonstrated good discrimination (Harrell's C‐index, 0.72; 95% confidence interval [CI], 0.71, 0.74 [women]; 0.77; 95% CI, 0.76, 0.79 [men]), fit, and calibration, particularly among individuals without baseline hypertension or hypercholesterolemia.
Conclusions
The Healthy Heart Score accurately identifies individuals at elevated risk for CVD and may serve as an important clinical and public health screening tool for the primordial prevention of CVD.
Keywords: epidemiology, lifestyle, nutrition, prevention, risk assessment
Introduction
Despite declines in cardiovascular (CV) disease (CVD) mortality, CVD remains the leading cause of death in the United States.1 Clinical practice focuses on primary prevention, specifically the prevention of incident CVD among individuals classified at high risk based on clinical risk factors, such as hypertension (HTN) and high cholesterol. Numerous risk prediction tools can estimate an individual's short‐term (ie, 10‐year) risk of CVD2–8 and the American Heart Association (AHA) endorses the use of these tools in the clinical setting9–10 however, because the short‐term risk of developing CVD for the majority of middle‐aged adults is low, yet the long‐term risk is high, these prediction models do not capture the true cumulative burden of CVD in this population.11 Furthermore, more than half of all CVD events occur in individuals who are not classified as high risk on the basis of clinical risk factors.12
Conversely, adults with optimal levels of risk factors at mid‐life have a 70% to 80% lower risk of coronary heart disease (CHD) and CVD mortality.13–15 The absence of established risk factors at the age of 55 is associated with a lifetime risk of CVD of 5% to 8%.16–17 Thus, the prevention of CVD risk factor development, or primordial prevention, is of paramount importance to minimize an individual's long‐term CVD risk. In clinical trials, intensive lifestyle modification significantly improves risk factors, such as blood pressure and lipid profiles.18–20 Furthermore, in long‐term observational epidemiology studies, an overall healthy lifestyle, including prudent diet, not smoking, healthy weight, and physical activity, in mid‐life may prevent the development of CVD risk factors21 and ultimately CVD events.22–24 We sought to develop and validate a risk prediction model based on modifiable lifestyle factors, which may be used as a tool for risk assessment in the primordial prevention setting. We developed this risk model among healthy middle‐aged men and women, who are the ideal population to focus long‐term prevention efforts clinically.
Methods
Study Participants and Endpoint Ascertainment
We derived the Healthy Heart Score, a lifestyle‐based risk score, among women enrolled in the Nurses’ Health Study (NHS), a prospective cohort of 121 700 female nurses ages 30 to 55 years at baseline in 197625 and men in the Health Professionals Follow‐up Study (HPFS), a cohort of 51 529 U.S. male health professionals, ages 40 to 75 years, in 1986.26 Participants in both cohorts provided information on medical history, lifestyle factors, and newly diagnosed diseases on self‐reported questionnaires throughout follow‐up. The institutional review boards at the Harvard School of Public Health (Boston, MA) and Brigham and Women's Hospital (Boston, MA) approved the study protocols and return of the questionnaire implied consent. This analysis included 61 025 women and 34 478 men who provided a complete ascertainment of pertinent lifestyle factors on a questionnaire administered in 1986 and who were free of previously diagnosed CVD (myocardial infarction [MI], angina, stroke, transient ischemic attack, and coronary revascularization) and cancer at baseline. Because diabetes is considered a CHD risk equivalent,27 we also excluded individuals with a history of diabetes at baseline.
Ascertainment of CVD
The outcome for this study was ischemic CVD, which included nonfatal MI, fatal CHD, and ischemic stroke, in line with current AHA recommendation for risk assessment algorithms.28 MI was defined according to World Health Organization criteria29 and strokes were confirmed using the National Survey of Stroke criteria30 and both were adjudicated by study investigators through medical record review. Strokes were classified as ischemic stroke (thrombotic or embolic occlusion of a cerebral artery), hemorrhagic stroke (subarachnoid and intraparenchymal hemorrhage), or stroke of probable or unknown subtype, when the subtype could not be ascertained because of unobtainable medical records. We excluded confirmed hemorrhagic strokes in our endpoint, but included confirmed ischemic and unknown subtypes, because ≈80% of all unknown strokes are ischemic in origin. Fatal CVD events were identified by next of kin, postal authorities, or the National Death Index and confirmed by medical records, autopsy reports, and death certificates with CHD or ischemic stroke listed as the underlying cause.
Ascertainment of Lifestyle Factors
We considered various dietary and lifestyle factors for inclusion into the prediction model. Criteria for consideration included the strength and consistency of association with risk of CVD in the literature and availability of data among study participants. A full list of variables considered in the model can be found in Table 1.
Table 1.
Dietary and Lifestyle Factors Considered for Inclusion in the Healthy Heart Score
| Dietary Factors | Other Lifestyle Factors |
|---|---|
| Fruits | Smoking Never, past, currentNever, quit >10 years ago, quit<10 years ago, currentNever, past, current <15 cigarettes, >15 cigarettes |
| Vegetables | |
| Fish | |
| Dark fish | |
| Red meat | Pack‐years |
| Processed meat | BMI |
| Nuts | Waist circumference |
| Sugar‐sweetened beverages | Exercise Total activity Light intensity only Moderate intensity only Vigorous intensity only Moderate+vigorous intensity |
| Fruit juice | |
| Whole grains | |
| Cereal fiber | |
| Sodium | |
| Added sugar | Sleep duration |
| Saturated fat | TV watching |
| Polyunsaturated fat | |
| Polyunsaturated/saturated fat ratio | |
| Trans fat | |
| Long‐chain n‐3 polyunsaturated fat | |
| Folate | |
| Alcohol | |
| Glycemic index | |
| Glycemic load |
For physical activity, men and women were asked how many hours per week, on average, they engaged in specific activities (walking, jogging, running, bicycling, swimming, tennis, squash/racquetball, rowing, and calisthenics) using a previously validated physical activity questionnaire.31 We calculated the average hours per week spent in moderate (3 to 6 metabolic equivalent tasks [METs]) and vigorous (≥6 METs) activity, which included walking at a pace of 3 mph or greater and other activities. We calculated body mass index (BMI; kg/m2) from self‐reported height and weight; self‐reported weight was highly correlated with directly measured weight (r=0.96).32 Smoking status was defined as never, past, or current, with various definitions of past smokers and current smokers as shown in Table 1.
Information on diet and alcohol was assessed through a validated 131‐item food frequency questionnaire (FFQ).33–34 Total nutrient intake was calculated by multiplying the frequency of consumption of each food item by its nutrient content (from the Harvard University Food Composition Database) of the specified portion and then summing the nutrient values across all contributing foods. We calculated average alcohol intake in g/day, assuming 12.8 g of alcohol in 12 ounces (oz) of beer, 11.0 g of alcohol in 4 oz of wine, and 14.0 g of alcohol in 1.5 oz of liquor.
Statistical Analysis
All analyses were performed separately in the NHS and HPFS cohorts using the structure outlined below. Each participant contributed follow‐up time from the return of the 1986 questionnaire until the date of diagnosis of an ischemic CVD event, date of death, or end of follow‐up (June 2010 in women and February 2010 in men). For each cohort, we randomly assigned two thirds of the study participants to a derivation cohort (n=40 680 women; n=23 026 men), and the remaining one third of the participants were reserved as a validation cohort (n=20 345 women; n=11 452 men). A priori, we decided to create a lifestyle score that included the same risk indicators for both men and women to provide a consistent clinical and public health message about CVD prevention; thus, we included components that met the inclusion criteria in at least 1, but not necessarily both, cohorts. The models were computed with risk at 20 years, because lifestyle factors likely play a greater role in the long‐term, rather than short‐term, prevention of CVD events. Over 99% of men and 89% of women were followed for a minimum of 20 years.
Derivation of a Composite Diet Score
First, we derived a composite diet score within the derivation cohort. To be included in the composite diet score, each food or nutrient component had to meet 2 criteria. First, the dietary component had to be a significant and independent predictor of ischemic CVD risk in multivariable Cox proportional hazards models that included other dietary factors. Second, the addition of the dietary variable had to minimize the model Bayes Information Criterion (BIC).35 The BIC is a likelihood‐based measure where lower values indicate better model fit. Therefore, the model with the lowest BIC is the best‐fitting, most parsimonious model. For all dietary factors, we explored the relation with CVD risk modeled in multiple forms, including as continuous and categorical, examining various cutpoints. To minimize the effect of influential outliers for continuous dietary factors, we truncated the distribution at the 1st and 99th percentiles. The summary diet score was calculated by multiplying each component by its cohort‐specific beta coefficient from the Cox model and summing across all components. We reversed the beta‐coefficients so that higher diet scores would reflect better diet quality.
Derivation of the Lifestyle‐Based CVD Risk Score
We derived the best overall prediction algorithm based on hazard ratios estimated in Cox proportional hazards models within the derivation data set. As with the dietary factors, we explored the relation of each lifestyle factor with CVD risk modeled in multiple forms, including continuous, with higher‐order functions when necessary, and categorical variables. We truncated the distribution of the continuous lifestyle factors at the 1st and 99th percentiles. We included all variables that were independent predictors of CVD risk for inclusion into the prediction model in multivariable models. The final criterion for inclusion into the risk score was minimization of the BIC.
Validation of the Healthy Heart Score
The overall predictive value of the model developed was assessed in the validation cohorts. We assessed model goodness of fit by the Gronnesby‐Borgan test statistic,36 a more robust statistic for survival data compared to Hosmer‐Lemeshow's statistic for calibration. As suggested by D'Agostino and Nam, chi‐square (χ2) values >20 (P<0.01) suggest a lack of adequate fit.37 We used Harrell's C‐index for survival data to assess model discrimination, which measures the ability to distinguish between individuals who experience a CVD event from those who do not.35 Larger values indicate better discrimination. We compared model discrimination of the lifestyle‐based CVD risk score to models with age only. We also assessed discrimination of a prediction model that added self‐reported physician‐diagnosed risk factors at baseline (HTN and hypercholesterolemia or high cholesterol) to this lifestyle‐risk risk score. To assess model calibration, we used calibration plots, plotting the average predicted risk within deciles of predicted risk against the observed risk in that decile. In sensitivity analyses, we examined model performance stratified by presence and absence of baseline clinical risk factors, hypercholesterolemia or high cholesterol and/or HTN, which are key risk factors for CVD and included in most clinically based risk prediction models.
Results
Among 61 025 women who were free of known CVD, diabetes, and cancer at baseline and had a median age of 52 years (interquartile range [IQR], 46 to 58), 3775 CVD cases (57% CHD and 43% ischemic stroke) occurred; among 34 478 apparently healthy men, median age 51 years (IQR, 44 to 59), a total of 3506 CVD cases (79% CHD and 21% ischemic stroke) occurred. The prediction model was derived among 2525 events in women and 2375 in men and validated among 1250 events in women and 1129 in men. Lifestyle characteristics were similar between the derivation and validation cohorts for both men and women (Table 2). The median period of follow‐up was 23.9 (IQR, 23.6, 23.9) years among women and 23.7 (IQR, 23.3, 23.8) among men.
Table 2.
Demographic and Lifestyle Characteristics in the Derivation and Validation Data Sets Among Men and Women at Baseline
| Variables | Women | Men | ||
|---|---|---|---|---|
| Derivation | Validation | Derivation | Validation | |
| N | 40 680 | 20 345 | 23 026 | 11 452 |
| Age, y | 52 (7)* | 52 (7) | 52 (9) | 52 (9) |
| Smoking, % | ||||
| Never | 44 | 45 | 49 | 49 |
| Past | 35 | 35 | 42 | 42 |
| Current | 21 | 20 | 9 | 8 |
| BMI, kg/m2 | 25.1 (4.5) | 25.1 (4.5) | 25.4 (2.9) | 25.4 (2.9) |
| Alcohol, g/day | 6.1 (9.9) | 6.1 (9.8) | 11.1 (14.5) | 11.2 (14.6) |
| Exercise, hours per week | 1.6 (2.0) | 1.6 (2.0) | 2.2 (2.1) | 2.2 (2.2) |
| Dietary components | ||||
| Fruit+vegetables, servings per day | 5.8 (2.6) | 5.8 (2.6) | 4.8 (2.6) | 4.8 (2.6) |
| Sugar‐sweetened beverages, servings per day | 0.23 (0.46) | 0.22 (0.46) | 0.36 (0.56) | 0.35 (0.55) |
| Red and processed meat, servings per day | 0.87 (0.54) | 0.86 (0.54) | 0.97 (0.69) | 0.97 (0.68) |
| Cereal fiber, g/day | 4.3 (2.4) | 4.3 (2.4) | 5.8 (3.2) | 5.7 (3.2) |
| Nuts, servings per day | 0.34 (0.43) | 0.34 (0.44) | 0.46 (0.58) | 0.46 (0.58) |
| Total diet score (points) | 3.6 (1.8) | 3.6 (1.8) | 1.0 (1.7) | 1.0 (1.6) |
Means (SD) for continuous variables. BMI indicates body mass index.
Derivation of the Composite Diet Score and the Lifestyle‐Based CVD Risk Score
Five dietary components, fruits+vegetables, nuts, cereal fiber, red+processed meat, and sugar‐sweetened beverages, which have been associated with CVD previously,38–44 met the inclusion criteria for the composite diet score in at least 1 cohort and were included in the final score (Table 3). Five lifestyle factors, smoking, BMI, moderate‐to‐vigorous exercise, alcohol intake and the diet score, in addition to age, were included in the overall lifestyle‐based risk score (Table 4). Each lifestyle factor was associated with risk of CVD linearly, except alcohol, which had a U‐shaped association.
Table 3.
Multivariable Hazard Ratios (HR) of Cardiovascular Disease for Dietary Components in the Derivation Data Sets (N=40 680 Women and 23 026 Men)
| Dietary Components* | HR (95% CI) | |
|---|---|---|
| Women | Men | |
| ≥3 servings per day fruit+vegetables | 0.77 (0.70, 0.86) | 0.91 (0.83, 0.996) |
| Sugar‐sweetened beverages, servings per day | 1.17 (1.07, 1.27) | 1.18 (1.09, 1.27) |
| Red and processed meats, servings per day | 1.10 (1.02, 1.19) | 1.10 (1.04, 1.17) |
| Cereal fiber, per 5 g/day | 0.84 (0.77, 0.91) | 0.91 (0.85, 0.97) |
| Nuts, servings per day | ||
| 0.1 to 1 | 0.89 (0.80, 0.99) | 1.06 (0.94, 1.20) |
| >1 | 0.80 (0.67, 0.95) | 0.88 (0.74, 1.04) |
Serving sizes: 1 medium piece of fruit, ½ cup of berries, ½ cup of vegetables, 1 cup of green leafy vegetables, 1 can/bottle/glass of sugar‐sweetened beverages, 4 ounces (oz) of unprocessed meat and 1.5 oz of processed meat, and 1 oz of nuts or 1 tablespoon (Tbsp) of nut butter.
Table 4.
Multivariable HR of CVD for Lifestyle Factors in the Derivation Data Sets (N=40 680 Women and 23 026 Men)
| Variables | HR (95% CI) | |
|---|---|---|
| Women | Men | |
| Age, per 5 years | ||
| Linear | 1.73 (1.67, 1.78) | 1.83 (1.46, 2.29) |
| Squared | N/A | 0.99 (0.98, 0.999) |
| Smoking | ||
| Past | 1.17 (1.06, 1.29) | 1.16 (1.06, 1.26) |
| Current | 2.53 (2.30, 2.79) | 1.55 (1.36, 1.78) |
| BMI, kg/m2 | 1.05 (1.04, 1.06) | 1.08 (1.07, 1.10) |
| Alcohol, per 10 g/day* | ||
| Linear | 0.83 (0.75, 0.93) | 0.92 (0.86, 0.99) |
| Squared | 1.04 (1.01, 1.07) | 1.01 (0.99, 1.02) |
| Exercise, per 3 hours per week* | 0.93 (0.87, 0.99) | 0.97 (0.91, 1.03) |
| Diet score, per 1 point | 0.95 (0.93, 0.97) | 0.93 (0.91, 0.95) |
BMI indicates body mass index; CVD, cardiovascular disease; HR, hazards ratio.
12‐oz (ounce) beer=12.8 g of alcohol, 4‐oz wine=11.0 g of alcohol, and 1.5‐oz liquor=14.0 g of alcohol.
Hours per week spent walking (≥3 mph), jogging, running, bicycling, swimming, tennis, squash/racquetball, rowing, and calisthenics.
Assessment of Model Performance in the Validation Data Set
In the validation cohorts, Gronnesby‐Borgan's test statistic indicated adequate model fit and Harrell's C‐statistic suggested good discrimination between cases and controls (Table 5). The lifestyle factors significantly increased the C‐statistic, compared to models with just age alone. Further addition of self‐reported HTN and hypercholesterolemia or high cholesterol to the risk model significantly increased the C‐statistic from 0.72 to 0.73 (95% confidence interval [CI], 0.72, 0.74; Pdiff<0.001) in women and from 0.77 to 0.78 (95% CI, 0.76, 0.79; Pdiff=0.001) in men. Finally, the model was well calibrated for 20‐year CVD risk prediction based on the calibration plots in women (Figure 1A). In men, the prediction model slightly underestimated CVD risk at high predicted risk levels (Figure 1B).
Table 5.
Summary Statistics to Assess Model Performance of the Lifestyle‐Based Risk Score Within the Validation Data Sets (N=20 345 Women and 11 452 Men)
| Population | N | Cases | Goodness of Fit* | Discrimination (Harrell's C‐Statistic [95% CI]) | |||
|---|---|---|---|---|---|---|---|
| χ2 | P Value | Age‐Only | Age+Lifestyle Factors | P Value* | |||
| Women | |||||||
| Total population | 20 345 | 1250 | 11.9 | 0.22 | 0.67 (0.66, 0.74) | 0.72 (0.71, 0.74) | 0.02 |
| No clinical risk factors | 16 508 | 845 | 10.9 | 0.28 | 0.68 (0.66, 0.73) | 0.73 (0.71, 0.74) | 0.01 |
| Presence of clinical risk factors* | 3837 | 405 | 9.6 | 0.38 | 0.60 (0.59, 0.73) | 0.66 (0.64, 0.74) | 0.01 |
| Men | |||||||
| Total population | 11 452 | 1129 | 13.5 | 0.14 | 0.74 (0.73, 0.78) | 0.77 (0.76, 0.79) | 0.01 |
| No clinical risk factors | 8482 | 662 | 10.3 | 0.33 | 0.74 (0.72, 0.78) | 0.77 (0.75, 0.79) | 0.004 |
| Presence of clinical risk factors | 2970 | 467 | 10.4 | 0.32 | 0.72 (0.70, 0.78) | 0.74 (0.72, 0.79) | 0.005 |
CI indicates confidence interval.
Gronnesby‐Borgan's test.
P value, test for difference in C‐statistic comparing model adjusted for age and models adjusted for age+lifestyle factors.
Risk factors included were self‐reported physician‐diagnosed hypertension and high cholesterol.
Figure 1.

Calibration plots of predicted 20‐year cardiovascular disease (CVD) risk within deciles against the observed 20‐year CVD risk in the validation data set (N=20 345 women and 11 452 men). Data are plotted among all women (A: black diamonds), women without CVD risk factors of hypertension and hypercholesterolemia at baseline (A: white circles), and women with risk factors of hypertension and hypercholesterolemia at baseline (A: black circles) and all men (B: black diamonds), men without CVD risk factors of hypertension and hypercholesterolemia at baseline (B: white circles), and men with risk factors of hypertension and hypercholesterolemia at baseline (B: black circles).
Whereas model fit was good among individuals with and without clinical risk factors at baseline (Table 5), model discrimination (Table 5) and calibration (Figure 1A and 1B) were better in the absence of baseline clinical risk factors (HTN and/or hypercholesterolemia or high cholesterol), compared to the presence of either risk factors.
Practical Example of Risk Estimation
Given that the model performed well in the independent validation data set, we combined the derivation and validation data sets in each cohort and refit the final model in the full data set to obtain more‐precise estimates of the coefficients for our lifestyle‐based CVD risk score. The equations for the diet score calculation and the Healthy Heart Score, based on the full data set, are presented in Figure 2.
Figure 2.
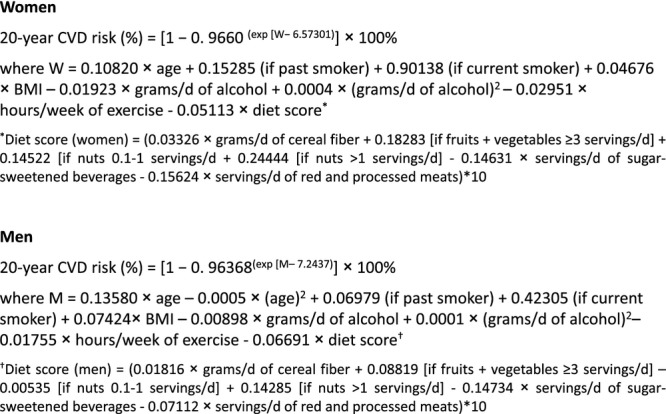
Formula to estimate the 20‐year risk of CVD based on Healthy Heart Score derived in the full data set (N=61 025 women and 34 478 men). Serving sizes: 1 medium piece of fruit; ½ cup of berries; ½ cup of vegetables; 1 cup of green leafy vegetables; 1 can/bottle/glass of sugar‐sweetened beverages; 4 ounces (oz) of unprocessed meat and 1.5 oz of processed meat; and 1 oz nuts or 1 tablespoon (Tbsp) of nut butter.
As a practical example, we estimated the 20‐year risk of CVD, relative to a healthy lifestyle, for individuals with various combinations of ages and lifestyle habits (Figure 3). Compared to a 45‐year‐old individual with very healthy lifestyle habits (nonsmoker, BMI of 23 kg/m2, 3.5 hours per week of moderate‐to‐vigorous physical activity, diet score of 5 points, and moderate alcohol intake [15 g/day in women and 30 g/day in men]), the 20‐year risk of CVD for 45‐year‐old individuals with unhealthy lifestyle habits (current smoker, BMI of 35 kg/m2, no physical activity, diet score of 0 points, and 0 g/day of alcohol) was over 7‐fold higher in women and 6‐fold higher in men.
Figure 3.
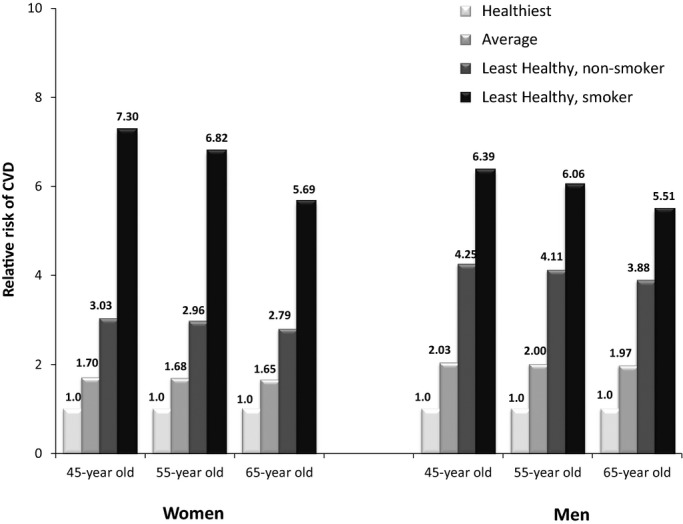
Estimated 20‐year risk of CVD for women (N=61 025) and men (N=34 478) across varying lifestyle habits, relative to the healthiest lifestyle, according to the Healthy Heart Score. Healthiest lifestyle: never smoker, BMI: 23 kg/m2, moderate exercise: 3.5 hours per week, moderate alcohol: 15 g/day in women and 30 g/day in men, diet score: 5 points; average lifestyle: never smoker, BMI: 28 kg/m2, moderate exercise: 1.5 hours per week, moderate alcohol: 5 g/day, diet score: 2.5 points; least healthy lifestyle: never smoker, BMI: 35 kg/m2, moderate exercise: 0 hours per week, moderate alcohol: 0 g/day, diet score: 0 points. BMI indicates body mass index; CVD, cardiovascular disease.
Discussion
In this study, we derived the Healthy Heart Score, an algorithm based on modifiable lifestyle factors that effectively predicts risk of CVD among men and women ≥40 years of age, particularly among individuals without HTN or hypercholesterolemia or high cholesterol. The Healthy Heart Score included smoking status, BMI, physical activity levels, alcohol consumption, and dietary intake and performed well in a validation data set, as demonstrated by goodness of model fit, calibration, and discrimination. To our knowledge, the Healthy Heart Score is the first prediction model to assess CVD risk formally based on healthy lifestyle factors.
Clinical practice focuses on the prevention of CVD through modification and pharmacological treatment of elevated clinical risk factors in an effort to prevent a cardiovascular event. Physicians spend little time assessing or advising patients on healthy lifestyle behaviors, such as physical activity and diet, particularly among patients classified as low‐risk by the Framingham Risk Score (FRS),45 and who are the ideal population to target primordial prevention efforts. The prevalence of healthy behaviors in the United States is low,46–47 and there has been little improvement in prevalence over the past decade.48 Thus, the use of a tool such as the Healthy Heart Score may facilitate clinicians in the assessment of a limited number of critical lifestyle factors in an effort to identify individuals at high risk for CVD. Furthermore, this lifestyle‐based tool may heighten awareness to explore true primordial prevention through interventions on underlying unhealthy behaviors to prevent the development of risk factors initially, rather than treating risk factors only when they become elevated.
The Healthy Heart Score, which identifies individuals at high risk based on lifestyle behaviors, could be used in combination with clinically based primary prevention models. For adults with a high short‐term risk of CVD, guidelines are in place for the optimal course of treatment.9 However, among individuals with low short‐term risk, the Healthy Heart Score may provide additional important information about long‐term CVD risk and overall burden of CVD. The addition of a lifestyle‐based evaluation in the primary care setting may improve risk assessment and may be particularly applicable among middle‐aged adults for whom current prediction models underestimate CVD risk burden.11 Ultimately, research is needed to assess the feasibility and effectiveness of this lifestyle‐only risk assessment tool on health behavior modification, CVD risk factor improvement, and overall CVD risk assessment when incorporated into the clinical care setting, particularly in combination with short‐term, clinically based risk models.
Other risk calculators, which incorporate both clinical and lifestyle factors for CVD risk prediction are available, including MyLifeCheck (based on Life's Simple 7 from the AHA)49 and Your Disease Risk (from Washington University in St Louis, MO).50 Many traditional risk factors are downstream of lifestyle factors and may mediate the effect of lifestyle on CVD risk, therefore diminishing the predictive value of lifestyle factors after the development of clinical risk factors.51 Therefore, it may be more appropriate to develop risk models separately for the primordial and primary prevention of CVD, rather than developing a risk prediction model comprehensive of lifestyle and clinical risk factors. For example, the Healthy Heart Score performed better in the absence of clinical risk factors, which suggests that lifestyle factors provide the most information about CVD risk preceding the development of clinical risk factors. Furthermore, a lack of clinical measurements may increase the applicability of a lifestyle‐only score beyond the clinical setting. As a broader public health screening tool, the risk score could be used to assess and motivate a much larger audience who may not have laboratory‐based measures available because of irregular checkups or lack of health care resources.
Our diet score and final prediction model are not fully inclusive of all lifestyle factors that are predictive of CVD. Adults who have healthy levels of the behaviors included in the lifestyle score likely adhere to other behaviors associated with lower risk of CVD, such as good sleep habits,52 less time spent in sedentary behavior,53 low intake of sodium54 and trans fat,55 and high intake of marine n‐3 fatty acids.56 We created the most parsimonious, rather than comprehensive, model for CVD risk prediction to identify the most critical factors necessary to assess CVD risk. Thus, the physicians need to inquire about only 3 lifestyle factors and 6 dietary components, avoiding the use of a long FFQ and minimizing the burden of data collection on both the patient and clinician.
The Healthy Heart Score predicts total ischemic CVD risk, although the underlying etiology of CHD and stroke differ. Thus, some of the disparities in the model performance between the cohorts may be explained by the different distribution of the CVD endpoints. However, from a public health perspective, the similarities for CHD and stroke prevention provide strong rationale for the prediction of total ischemic CVD,28 rather than developing individual prediction models. The model performance among men was modest, and better in women, likely because some risk factors were more strongly associated with risk among women. Additional studies are warranted to determine whether these differences are an artifact of the population characteristics or true biological difference between genders.
The NHS and HPFS are the ideal populations to develop a lifestyle‐based long‐term CVD prediction algorithm given the long and rigorous follow‐up over 20 years, which is particularly important in the setting of primordial prevention. Furthermore, we have detailed assessment of numerous diet and lifestyle factors across a broad range of values. Given the large sample size, we were able to validate the risk scores in an independent subset of the populations. Additionally, we estimated CVD risk empirically as a direct function of individual lifestyle risk factors, accounting for the impact of all lifestyle factors simultaneously and the gradient in risk across the full distribution of lifestyle factor levels, in contrast to other calculators that were based on risk estimates from the published literature, have not been independently validated in terms of CVD risk prediction and use simple categorization of lifestyle factors.49–50
Our study has limitations that warrant discussion. First, we derived these risk equations using conditional models, and though the relative risks for the lifestyle factors are valid, we recognize that absolute risk in these cohorts may be overestimated. However, in contrast, the absolute risk of CVD among these primarily Caucasian health professionals, within a narrow socioeconomic status (SES) range, is likely lower than the risk of CVD in the general population. To address these concerns, we present the 20‐year risk of CVD, relative to a healthy lifestyle, in Figure 3, as well as in the accompanying online calculator. Second, the prediction models were developed in homogenous populations. Before a risk tool can be used in the clinical setting, it is imperative to evaluate its performance in external populations, particularly in populations with diversity in race, SES, and education. Although we would expect the underlying biology of these lifestyle factors to be similar across these demographics, simple calibration or potential re‐estimation may be required to estimate risk in more‐diverse populations accurately. Importantly, other clinical risk scores, such as the FRS and Reynolds Risk Score, were developed in nonrepresentative populations, yet are commonly used. Additionally, we lack direct measures of clinical risk factors and biomarkers used in other clinical prediction algorithms, and thus we cannot compare directly the predictive ability of the lifestyle model to existing risk models in these populations. Finally, we were unable to develop this primordial prevention risk score among individuals with no clinical risk factors (HTN and hypercholesterolemia or high cholesterol) as a result of the decreased precision with fewer CVD cases.
Conclusion
Despite being the leading cause of mortality and morbidity, CVD is largely preventable through primordial and primary prevention.57 Current clinical practice focuses on the primary prevention of CVD events among asymptomatic, but high‐risk, individuals. The Healthy Heart Score, based on smoking status, BMI, physical activity, dietary intake, and alcohol consumption, could serve as an important tool for the long‐term prevention of CVD, which is needed to achieve optimal population‐wide CV health.
Sources of Funding
Disclosures
None.
Acknowledgments
Dr Chiuve had full access to all of the data in the study and takes responsibility for the integrity of the data and the accuracy of the data analysis.
A user‐friendly calculator to assess the 20‐year risk of CVD based on the Healthy Heart Score is freely accessible at http://www.healthyheartscore.org. The goal of the Web application is to engage website visitors to learn their personal risk of CVD, understand the lifestyle habits that affect their risk of heart attack and stroke, and serve as a cue to action for behavioral change. Upon completion, the patients will receive a summary that is color coded (red, yellow, and green to represent high, medium, or low risk, respectively) and purposely very visual to provide the patient with a quick snapshot of areas that need focused prevention. The user also receives practical tips for maintaining or improving each lifestyle factor and simple explanations for why each factor is important for CVD health. All data are saved as a pdf that can be printed and brought to their clinician's office (if completed at home) or for the patient to take home (if completed in the clinic).
References
- 1.Go AS, Mozaffarian D, Roger VL, Benjamin EJ, Berry JD, Borden WB, Bravata DM, Dai S, Ford ES, Fox CS, Franco S, Fullerton HJ, Gillespie C, Hailpern SM, Heit JA, Howard VJ, Huffman MD, Kissela BM, Kittner SJ, Lackland DT, Lichtman JH, Lisabeth LD, Magid D, Marcus GM, Marelli A, Matchar DB, McGuire DK, Mohler ER, Moy CS, Mussolino ME, Nichol G, Paynter NP, Schreiner PJ, Sorlie PD, Stein J, Turan TN, Virani SS, Wong ND, Woo D, Turner MB. Heart disease and stroke statistics—2013 update: a report from the American Heart Association. Circulation. 2013; 127:e6-e245. [DOI] [PMC free article] [PubMed] [Google Scholar]
- 2.Hippisley‐Cox J, Coupland C, Vinogradova Y, Robson J, May M, Brindle P. Derivation and validation of QRISK, a new cardiovascular disease risk score for the United Kingdom: prospective open cohort study. BMJ. 2007; 335:136. [DOI] [PMC free article] [PubMed] [Google Scholar]
- 3.Conroy RM, Pyorala K, Fitzgerald AP, Sans S, Menotti A, De Backer G, De Bacquer D, Ducimetiere P, Jousilahti P, Keil U, Njolstad I, Oganov RG, Thomsen T, Tunstall‐Pedoe H, Tverdal A, Wedel H, Whincup P, Wilhelmsen L, Graham IM. Estimation of ten‐year risk of fatal cardiovascular disease in Europe: the SCORE project. Eur Heart J. 2003; 24:987-1003. [DOI] [PubMed] [Google Scholar]
- 4.Wilson PW, D'Agostino RB, Levy D, Belanger AM, Silbershatz H, Kannel WB. Prediction of coronary heart disease using risk factor categories. Circulation. 1998; 97:1837-1847. [DOI] [PubMed] [Google Scholar]
- 5.D'Agostino RB, Sr, Vasan RS, Pencina MJ, Wolf PA, Cobain M, Massaro JM, Kannel WB. General cardiovascular risk profile for use in primary care: the Framingham Heart Study. Circulation. 2008; 117:743-753. [DOI] [PubMed] [Google Scholar]
- 6.Ridker PM, Buring JE, Rifai N, Cook NR. Development and validation of improved algorithms for the assessment of global cardiovascular risk in women: the Reynolds Risk Score. JAMA. 2007; 297:611-619. [DOI] [PubMed] [Google Scholar]
- 7.Woodward M, Brindle P, Tunstall‐Pedoe H. Adding social deprivation and family history to cardiovascular risk assessment: the ASSIGN score from the Scottish Heart Health Extended Cohort (SHHEC). Heart. 2007; 93:172-176. [DOI] [PMC free article] [PubMed] [Google Scholar]
- 8.Assmann G, Schulte H, Cullen P, Seedorf U. Assessing risk of myocardial infarction and stroke: new data from the Prospective Cardiovascular Munster (PROCAM) study. Eur J Clin Invest. 2007; 37:925-932. [DOI] [PubMed] [Google Scholar]
- 9.Greenland P, Alpert JS, Beller GA, Benjamin EJ, Budoff MJ, Fayad ZA, Foster E, Hlatky MA, Hodgson JM, Kushner FG, Lauer MS, Shaw LJ, Smith SC, Jr, Taylor AJ, Weintraub WS, Wenger NK, Jacobs AK. 2010 ACCF/AHA guideline for assessment of cardiovascular risk in asymptomatic adults: a report of the American College of Cardiology Foundation/American Heart Association Task Force on Practice Guidelines. Circulation. 2010; 122:e584-e636. [DOI] [PubMed] [Google Scholar]
- 10.Goff DC, Jr, Lloyd‐Jones DM, Bennett G, Coady S, D'Agostino RB, Sr, Gibbons R, Greenland P, Lackland DT, Levy D, O'Donnell CJ, Robinson J, Schwartz JS, Shero ST, Smith SC, Jr, Sorlie P, Stone NJ, Wilson PW. 2013 ACC/AHA guideline on the assessment of cardiovascular risk: a report of the American College of Cardiology/American Heart Association Task Force on Practice Guidelines. Circulation. 2014; 12925 Suppl 2:S49-S73.10.1161/01.cir.0000437741.48606.98 [DOI] [PubMed] [Google Scholar]
- 11.Marma AK, Berry JD, Ning H, Persell SD, Lloyd‐Jones DM. Distribution of 10‐year and lifetime predicted risks for cardiovascular disease in US adults: findings from the National Health and Nutrition Examination Survey 2003 to 2006. Circ Cardiovasc Qual Outcomes. 2010; 3:8-14. [DOI] [PMC free article] [PubMed] [Google Scholar]
- 12.Polonsky TS, Greenland P. CVD screening in low‐risk, asymptomatic adults: clinical trials needed. Nat Rev Cardiol. 2012; 9:599-604. [DOI] [PubMed] [Google Scholar]
- 13.Stamler J, Stamler R, Neaton JD, Wentworth D, Daviglus ML, Garside D, Dyer AR, Liu K, Greenland P. Low risk‐factor profile and long‐term cardiovascular and noncardiovascular mortality and life expectancy: findings for 5 large cohorts of young adult and middle‐aged men and women. JAMA. 1999; 282:2012-2018. [DOI] [PubMed] [Google Scholar]
- 14.Daviglus ML, Stamler J, Pirzada A, Yan LL, Garside DB, Liu K, Wang R, Dyer AR, Lloyd‐Jones DM, Greenland P. Favorable cardiovascular risk profile in young women and long‐term risk of cardiovascular and all‐cause mortality. JAMA. 2004; 292:1588-1592. [DOI] [PubMed] [Google Scholar]
- 15.Yang Q, Cogswell ME, Flanders WD, Hong Y, Zhang Z, Loustalot F, Gillespie C, Merritt R, Hu FB. Trends in cardiovascular health metrics and associations with all‐cause and CVD mortality among US adults. JAMA. 2012; 307:1273-1283. [DOI] [PMC free article] [PubMed] [Google Scholar]
- 16.Berry JD, Dyer A, Cai X, Garside DB, Ning H, Thomas A, Greenland P, Van Horn L, Tracy RP, Lloyd‐Jones DM. Lifetime risks of cardiovascular disease. N Engl J Med. 2012; 366:321-329. [DOI] [PMC free article] [PubMed] [Google Scholar]
- 17.Lloyd‐Jones DM, Leip EP, Larson MG, D'Agostino RB, Beiser A, Wilson PW, Wolf PA, Levy D. Prediction of lifetime risk for cardiovascular disease by risk factor burden at 50 years of age. Circulation. 2006; 113:791-798. [DOI] [PubMed] [Google Scholar]
- 18.Elmer PJ, Obarzanek E, Vollmer WM, Simons‐Morton D, Stevens VJ, Young DR, Lin PH, Champagne C, Harsha DW, Svetkey LP, Ard J, Brantley PJ, Proschan MA, Erlinger TP, Appel LJ. Effects of comprehensive lifestyle modification on diet, weight, physical fitness, and blood pressure control: 18‐month results of a randomized trial. Ann Intern Med. 2006; 144:485-495. [DOI] [PubMed] [Google Scholar]
- 19.Miller ER, III, Erlinger TP, Young DR, Jehn M, Charleston J, Rhodes D, Wasan SK, Appel LJ. Results of the Diet, Exercise, and Weight Loss Intervention Trial (DEW‐IT). Hypertension. 2002; 40:612-618. [DOI] [PubMed] [Google Scholar]
- 20.Knowler WC, Barrett‐Connor E, Fowler SE, Hamman RF, Lachin JM, Walker EA, Nathan DM. Reduction in the incidence of type 2 diabetes with lifestyle intervention or metformin. N Engl J Med. 2002; 346:393-403. [DOI] [PMC free article] [PubMed] [Google Scholar]
- 21.Liu K, Daviglus ML, Loria CM, Colangelo LA, Spring B, Moller AC, Lloyd‐Jones DM. Healthy lifestyle through young adulthood and the presence of low cardiovascular disease risk profile in middle age: the Coronary Artery Risk Development in (Young) Adults (CARDIA) study. Circulation. 2012; 125:996-1004. [DOI] [PMC free article] [PubMed] [Google Scholar]
- 22.Kurth T, Moore SC, Gaziano JM, Kase CS, Stampfer MJ, Berger K, Buring JE. Healthy lifestyle and the risk of stroke in women. Arch Intern Med. 2006; 166:1403-1409. [DOI] [PubMed] [Google Scholar]
- 23.Yusuf S, Hawken S, Ounpuu S, Dans T, Avezum A, Lanas F, McQueen M, Budaj A, Pais P, Varigos J, Lisheng L. Effect of potentially modifiable risk factors associated with myocardial infarction in 52 countries (the INTERHEART study): case‐control study. Lancet. 2004; 364:937-952. [DOI] [PubMed] [Google Scholar]
- 24.Knoops KT, de Groot LC, Kromhout D, Perrin AE, Moreiras‐Varela O, Menotti A, van Staveren WA. Mediterranean diet, lifestyle factors, and 10‐year mortality in elderly European men and women: the HALE project. JAMA. 2004; 292:1433-1439. [DOI] [PubMed] [Google Scholar]
- 25.Willett WC, Green A, Stampfer MJ, Speizer FE, Colditz GA, Rosner B, Monson R, Stason W, Hennekens CH. Relative and absolute excess risks of coronary heart disease among women who smoke cigarettes. N Engl J Med. 1987; 317:1303-1309. [DOI] [PubMed] [Google Scholar]
- 26.Colditz GA, Rimm EB, Giovannucci E, Stampfer MJ, Rosner B, Willett WC. A prospective study of parental history of myocardial infarction and coronary artery disease in men. Am J Cardiol. 1991; 67:933-938. [DOI] [PubMed] [Google Scholar]
- 27.Grundy SM, Cleeman JI, Merz CN, Brewer HB, Jr, Clark LT, Hunninghake DB, Pasternak RC, Smith SC, Jr, Stone NJ. Implications of recent clinical trials for the National Cholesterol Education Program Adult Treatment Panel III guidelines. Circulation. 2004; 110:227-239. [DOI] [PubMed] [Google Scholar]
- 28.Lackland DT, Elkind MS, D'Agostino R, Sr, Dhamoon MS, Goff DC, Jr, Higashida RT, McClure LA, Mitchell PH, Sacco RL, Sila CA, Smith SC, Jr, Tanne D, Tirschwell DL, Touze E, Wechsler LR. Inclusion of stroke in cardiovascular risk prediction instruments: a statement for healthcare professionals from the American Heart Association/American Stroke Association. Stroke. 2012; 43:1998-2027. [DOI] [PubMed] [Google Scholar]
- 29.Alpert JS, Thygesen K, Antman E, Bassand JP. Myocardial infarction redefined—a consensus document of The Joint European Society of Cardiology/American College of Cardiology Committee for the redefinition of myocardial infarction. J Am Coll Cardiol. 2000; 36:959-969. [DOI] [PubMed] [Google Scholar]
- 30.Walker AE, Robins M, Weinfeld FD. The National Survey of Stroke. Clinical findings. Stroke. 1981; 12:I13-I44. [PubMed] [Google Scholar]
- 31.Chasan‐Taber S, Rimm EB, Stampfer MJ, Spiegelman D, Colditz GA, Giovannucci E, Ascherio A, Willett WC. Reproducibility and validity of a self‐administered physical activity questionnaire for male health professionals. Epidemiology. 1996; 7:81-86. [DOI] [PubMed] [Google Scholar]
- 32.Rimm EB, Stampfer MJ, Colditz GA, Chute CG, Litin LB, Willett WC. Validity of self‐reported waist and hip circumferences in men and women. Epidemiology. 1990; 1:466-473. [DOI] [PubMed] [Google Scholar]
- 33.Rimm EB, Giovannucci EL, Stampfer MJ, Colditz GA, Litin LB, Willett WC. Reproducibility and validity of a expanded self‐administered semiquantitative food frequency questionnaire among male health professionals. Am J Epidemiol. 1992; 135:1114-1126. [DOI] [PubMed] [Google Scholar]
- 34.Giovannucci E, Colditz G, Stampfer MJ, Rimm EB, Litin L, Sampson L, Willett WC. The assessment of alcohol consumption by a simple self‐administered questionnaire. Am J Epidemiol. 1991; 133:810-817. [DOI] [PubMed] [Google Scholar]
- 35.Harrell F., Jr Regression Modeling Strategies. 2001New York, NY: Springer‐Verlag [Google Scholar]
- 36.May S, Hosmer DW. A cautionary note on the use of the Gronnesby and Borgan goodness‐of‐fit test for the Cox proportional hazards model. Lifetime Data Anal. 2004; 10:283-291. [DOI] [PubMed] [Google Scholar]
- 37.D'Agostino RB, Nam BH. In: Balakrishnan N, Rao CR. (eds.). Evaluation of the performance of survival analysis models: discrimination and calibration measures. Handbook of Statistics. 2004New York, NY: Elsevier; 1-25. [Google Scholar]
- 38.He FJ, Nowson CA, MacGregor GA. Fruit and vegetable consumption and stroke: meta‐analysis of cohort studies. Lancet. 2006; 367:320-326. [DOI] [PubMed] [Google Scholar]
- 39.He FJ, Nowson CA, Lucas M, MacGregor GA. Increased consumption of fruit and vegetables is related to a reduced risk of coronary heart disease: meta‐analysis of cohort studies. J Hum Hypertens. 2007; 21:717-728. [DOI] [PubMed] [Google Scholar]
- 40.Mozaffarian D, Kumanyika SK, Lemaitre RN, Olson JL, Burke GL, Siscovick DS. Cereal, fruit, and vegetable fiber intake and the risk of cardiovascular disease in elderly individuals. JAMA. 2003; 289:1659-1666. [DOI] [PubMed] [Google Scholar]
- 41.Fung TT, Malik V, Rexrode KM, Manson JE, Willett WC, Hu FB. Sweetened beverage consumption and risk of coronary heart disease in women. Am J Clin Nutr. 2009; 89:1037-1042. [DOI] [PMC free article] [PubMed] [Google Scholar]
- 42.Bernstein AM, de Koning L, Flint AJ, Rexrode KM, Willett WC. Soda consumption and the risk of stroke in men and women. Am J Clin Nutr. 2012; 95:1190-1199. [DOI] [PMC free article] [PubMed] [Google Scholar]
- 43.Bernstein AM, Pan A, Rexrode KM, Stampfer M, Hu FB, Mozaffarian D, Willett WC. Dietary protein sources and the risk of stroke in men and women. Stroke. 2012; 43:637-644. [DOI] [PMC free article] [PubMed] [Google Scholar]
- 44.Bernstein AM, Sun Q, Hu FB, Stampfer MJ, Manson JE, Willett WC. Major dietary protein sources and risk of coronary heart disease in women. Circulation. 2010; 122:876-883. [DOI] [PMC free article] [PubMed] [Google Scholar]
- 45.Mosca L, Linfante AH, Benjamin EJ, Berra K, Hayes SN, Walsh BW, Fabunmi RP, Kwan J, Mills T, Simpson SL. National study of physician awareness and adherence to cardiovascular disease prevention guidelines. Circulation. 2005; 111:499-510. [DOI] [PubMed] [Google Scholar]
- 46.Lloyd‐Jones DM, Hong Y, Labarthe D, Mozaffarian D, Appel LJ, Van Horn L, Greenlund K, Daniels S, Nichol G, Tomaselli GF, Arnett DK, Fonarow GC, Ho PM, Lauer MS, Masoudi FA, Robertson RM, Roger V, Schwamm LH, Sorlie P, Yancy CW, Rosamond WD. Defining and setting national goals for cardiovascular health promotion and disease reduction: the American Heart Association's strategic Impact Goal through 2020 and beyond. Circulation. 2010; 121:586-613. [DOI] [PubMed] [Google Scholar]
- 47.Shay CM, Ning H, Daniels SR, Rooks CR, Gidding SS, Lloyd‐Jones DM. Status of cardiovascular health in US adolescents: prevalence estimates from the National Health and Nutrition Examination Surveys (NHANES) 2005–2010. Circulation. 2013; 127:1369-1376. [DOI] [PubMed] [Google Scholar]
- 48.Huffman MD, Capewell S, Ning H, Shay CM, Ford ES, Lloyd‐Jones DM. Cardiovascular health behavior and health factor changes (1988–2008) and projections to 2020: results from the National Health and Nutrition Examination Surveys. Circulation. 2012; 125:2595-2602. [DOI] [PMC free article] [PubMed] [Google Scholar]
- 49.American Heart Association. My life check. 2012.
- 50.Siteman Cancer Center at Barnes‐Jewish Hospital, Washington University School of Medicine. Your disease risk. 2012.
- 51.Wormser D, Kaptoge S, Di Angelantonio E, Wood AM, Pennells L, Thompson A, Sarwar N, Kizer JR, Lawlor DA, Nordestgaard BG, Ridker P, Salomaa V, Stevens J, Woodward M, Sattar N, Collins R, Thompson SG, Whitlock G, Danesh J. Separate and combined associations of body‐mass index and abdominal adiposity with cardiovascular disease: collaborative analysis of 58 prospective studies. Lancet. 2011; 377:1085-1095. [DOI] [PMC free article] [PubMed] [Google Scholar]
- 52.Cappuccio FP, Cooper D, D'Elia L, Strazzullo P, Miller MA. Sleep duration predicts cardiovascular outcomes: a systematic review and meta‐analysis of prospective studies. Eur Heart J. 2011; 32:1484-1492. [DOI] [PubMed] [Google Scholar]
- 53.Chomistek AK, Manson JE, Stefanick ML, Lu B, Sands‐Lincoln M, Going SB, Garcia L, Allison MA, Sims ST, Lamonte MJ, Johnson KC, Eaton CB. Relationship of sedentary behavior and physical activity to incident cardiovascular disease: results from the Women's Health Initiative. J Am Coll Cardiol. 2013; 61:2346-2354. [DOI] [PMC free article] [PubMed] [Google Scholar]
- 54.Strazzullo P, D'Elia L, Kandala NB, Cappuccio FP. Salt intake, stroke, and cardiovascular disease: meta‐analysis of prospective studies. BMJ. 2009; 339:b4567. [DOI] [PMC free article] [PubMed] [Google Scholar]
- 55.Mozaffarian D, Katan MB, Ascherio A, Stampfer MJ, Willett WC. Trans fatty acids and cardiovascular disease. N Engl J Med. 2006; 354:1601-1613. [DOI] [PubMed] [Google Scholar]
- 56.Kris‐Etherton PM, Harris WS, Appel LJ. Omega‐3 fatty acids and cardiovascular disease: new recommendations from the American Heart Association. Arterioscler Thromb Vasc Biol. 2003; 23:151-152. [DOI] [PubMed] [Google Scholar]
- 57.Weintraub WS, Daniels SR, Burke LE, Franklin BA, Goff DC, Jr, Hayman LL, Lloyd‐Jones D, Pandey DK, Sanchez EJ, Schram AP, Whitsel LP. Value of primordial and primary prevention for cardiovascular disease: a policy statement from the American Heart Association. Circulation. 2011; 124:967-990. [DOI] [PubMed] [Google Scholar]