

Abstract
Background
The rapidly changing landscape of percutaneous coronary intervention provides a unique model for examining disparities over time. Previous studies have not examined socioeconomic inequalities in the current era of drug eluting stents (DES).
Methods and Results
We analyzed 835 070 hospitalizations for acute coronary syndrome (ACS) from the Healthcare Cost and Utilization Project across all insurance types from 2008 to 2011, examining whether quality of care and outcomes for patients with ACS differed by income (based on zip code of residence) with adjustment for patient characteristics and clustering by hospital. We found that lower‐income patients were less likely to receive an angiogram within 24 hours of a ST elevation myocardial infarction (STEMI) (69.5% for IQ1 versus 73.7% for IQ4, P<0.0001, OR 0.79 [0.68 to 0.91]) or within 48 hours of a Non‐STEMI (47.6% for IQ1 versus 51.8% for IQ4, P<0.0001, OR 0.86 [0.75 to 0.99]). Lower income was associated with less use of a DES (64.7% for IQ1 versus 71.2% for IQ4, P<0.0001, OR 0.83 [0.74 to 0.93]). However, no differences were found for coronary artery bypass surgery. Among STEMI patients, lower‐income patients also had slightly increased adjusted mortality rates (10.8% for IQ1 versus 9.4% for IQ4, P<0.0001, OR 1.17 [1.11 to 1.25]). After further adjusting for time to reperfusion among STEMI patients, mortality differences across income groups decreased.
Conclusions
For the most well accepted procedural treatments for ACS, income inequalities have faded. However, such inequalities have persisted for DES use, a relatively expensive and until recently, controversial revascularization procedure. Differences in mortality are significantly associated with differences in time to primary PCI, suggesting an important target for understanding why these inequalities persist.
Keywords: acute coronary syndrome, outcomes, quality, socioeconomic status
Introduction
In recent years, there has been a significant focus on eradicating socioeconomic and racial disparities in healthcare, as evidenced by the stated objectives of the Institute of Medicine and the Healthy People 2020 agenda of the US Department of Health and Human Services.1–2 One area in which such disparities have long been observed has been in surgical and medical procedures, though less so in more routine care.3 Efforts to narrow this gap have not yet met with widespread success.3
Ischemic heart disease is no exception to this rule. It is the leading cause of death among Americans, and prior studies link income inequality to increased mortality.4–5 Many previous studies have identified socioeconomic differences in the use of procedures.6–8 However, the advent of drug‐eluting stents in the last decade provides an opportunity to evaluate how differences in the diagnosis and treatment of ischemic heart disease have persisted or faded over time, and how they are related to the introduction of a new costly but potentially effective technology.
Studies examining DES utilization are limited mostly to evaluations of pre‐2008 data, reflective of a time when there was still significant controversy regarding the risks of DES usage including very late stent thrombosis.9–14 Indeed, racial disparities in DES use varied over time from 2003 to 2007, with no disparities observed during the initial surge in DES usage followed by a subsequent reappearance of disparities similar to those observed in the pre‐DES era.15 Since the widespread establishment of clear risks and benefits for DES usage, there have been few studies examining whether socioeconomic differences are still associated with differences in usage, whether patterns of revascularization have changed, and if so, whether this impacts cardiovascular outcomes.
Given that 2008 was the first year that concerns of late stent thrombosis were mostly settled and overall usage of DES stabilized among the general patient population,16 we chose to examine socioeconomic differences subsequent to this time period. We sought to determine the extent of inequalities by income with regards to quality of care, procedural usage, and in‐hospital outcomes for patients admitted with acute coronary syndrome in the modern era of DES.
Methods
Data Source
We analyzed hospital discharge data from the Healthcare Cost and Utilization Project (HCUP) sponsored by the Agency for Healthcare Research and Quality. HCUP includes the largest collection of longitudinal hospital care data in the United States, with all‐payer, encounter‐level information without selection bias since 1988 and has been widely used in other major studies.17–19 We used state specific data from 4 states (CA, FL, NJ, and NY). We chose to examine data from these select states rather than the national dataset because these state datasets include all patients hospitalized at non‐federal facilities including all insurance types (including Medicare, Medicaid, private insurance, and uninsured), which are not available for the entire national dataset.
Patients
We identified hospitalizations for acute coronary syndrome (ACS, N=835 070), distinguishing the type of ACS (STEMI, Non‐STEMI, or unstable angina) using admission and discharge diagnosis codes from January to December of 2008‐2011. We used ICD codes for myocardial infarction 410.0 through 410.9 (which specifies Non‐STEMI and STEMI), 411.1, 411.8, and 411.89 (unstable angina). We also determined whether certain procedures were performed and their timing relative to admission. For all states, we were able to determine in‐hospital mortality and 30‐day re‐admission rates from the HCUP dataset.
Income
We used HCUP data on income that stratifies patients into 4 income quartiles based on median household state‐specific income for the patient's ZIP Code.
Health Outcomes and Process of Care
We identified health outcomes measures of in‐hospital mortality, length of stay, and 30‐day re‐admission (among patients who survived at least 30 days). As potential quality of care measures, we examined whether a patient with a STEMI as an admitting diagnosis received a cardiac catheterization within 24 hours and whether a patient with a Non‐STEMI (NSTEMI) received a cardiac catheterization within 48 hours. We identified these as quality measures based on the class I indication from the 2004 and 2012 ACCF/AHA STEMI guidelines20–21 and the results of the TACTICS study, which showed that unstable angina and NSTEMI patients treated with a glycoprotein IIb/IIIa inhibitor who received an early invasive strategy with catheterization within 48 hours had a significantly lower incidence of major cardiac events compared to a conservative strategy.22 We also examined other process of care measures, such as the proportion of each income quartile who received revascularization of any kind (percutaneous coronary intervention [PCI] or coronary artery bypass grafting), and if revascularized with PCI, the proportion who received a DES versus bare metal stent (BMS) during their ACS hospitalization. Based on the landmark clinical trials23–24 demonstrating lower rates of major adverse cardiac events for DES over BMS for the treatment of coronary stenosis, we use DES as the normative standard. While it is true that there are select cases in which a BMS may be preferred over DES, we assume that these are rare clinical scenarios, which are evenly distributed across the population so that we should still be able to compare DES usage between socioeconomic groups.
Analytic Methods
We examined differences in patient and hospital characteristics (Table 1) according to income quartile using chi‐square tests for categorical variables and analysis of variance for continuous variables. Multivariate logistic regression was used to adjust for patient characteristics (eg, age, gender, comorbidities, race, insurance payer, geographic state) as well as clustering of patients within hospitals to determine the association of socioeconomic quartile with a number of process and outcome quality measures. To handle clustering, we used generalized estimating equations (SAS, GENMOD procedure) with an independent correlation matrix structure. To determine the sensitivity of the results to different analytic strategies, we also re‐examined procedure use after adjusting for the proportion of low‐income patients admitted to the hospital, as well as including individual hospitals as a fixed effect. To examine if race mediated the effect of income on procedure use and mortality outcomes, we repeated these analyses without adjustment for race as a comparison. Odds ratios for income quartiles were all calculated with income quartile 4 (highest) as the reference. To determine the degree to which differences in health outcomes could be explained by inequalities in process quality of care, we repeated the multivariate analyses with the addition of use (yes/no) of PCI within 24 hours for STEMI. A P value <0.05 was considered statistically significant. To handle missing data, for continuous variables, we imputed the mean. For categorical data, we created a missing category in order to not lose data. There were no missing data for outcomes. All analyses were performed with SAS 9.0 (Cary, NC).
Table 1.
Demographic and Clinical Characteristics by Income Quartile
| Income Quartile | ||||
|---|---|---|---|---|
| 1 (Lowest) | 2 | 3 | 4 (Highest) | |
| n=185 070 | n=181 488 | n=171 783 | n=147 592 | |
| Demographics | ||||
| Male, % | 56.6 (104 715) | 58.6 (106 306) | 59.9 (102 828) | 62.1 (91 632) |
| Age, y | 67.5±14.8 | 68.7±14.7 | 68.8±14.8 | 69.8±14.7 |
| Race/Ethnicity, % | ||||
| White | 54.0 (97 578) | 71.8 (127 253) | 72.9 (122 074) | 79.5 (114 339) |
| Black | 18.3 (33 149) | 7.2 (12 786) | 6.7 (11 130) | 3.4 (4910) |
| Hispanic | 19.8 (35 882) | 13.2 (23 411) | 11.4 (19 071) | 7.7 (11 071) |
| Asian | 3.2 (5688) | 3.6 (6384) | 4.9 (8137) | 5.2 (7469) |
| Native American | 0.2 (358) | 0.2 (432) | 0.2 (399) | 0.2 (282) |
| Other | 4.5 (8164) | 3,9 (6946) | 4.0 (6678) | 4.1 (5840) |
| Patient comorbidities, % | ||||
| CHF | 36.2 (66 963) | 34.9 (63 330) | 33.9 (58 325) | 32.8 (48 377) |
| Atrial fibrillation | 16.6 (30 729) | 18.6 (33 771) | 18.9 (32 529) | 20.2 (29 813) |
| Diabetes | 40.5 (75 029) | 36.9 (66 994) | 34.8 (59 811) | 30.9 (45 571) |
| Renal failure | 22.1 (40 859) | 20.9 (37 929) | 20.7 (35 587) | 19.5 (28 736) |
| CVA | 6.9 (12 695) | 6.6 (12 051) | 6.7 (11 562) | 6.3 (9299) |
| PVD | 1.7 (3115) | 1.9 (3454) | 1.9 (3244) | 1.9 (2835) |
| Malignancy | 2.6 (4729) | 2.8 (5064) | 2.8 (4879) | 3.2 (4668) |
| COPD | 23.1 (42 763) | 21.8 (39 556) | 20.1 (34 595) | 17.6 (25 948) |
| Charlson Score | 2.7±1.8 | 2.6±1.8 | 2.6±1.8 | 2.5±1.8 |
| Clinical presentation, % | ||||
| STEMI (31.5) | 29.3 (54 218) | 31.7 (57 533) | 32.0 (55 027) | 33.4 (49 328) |
| NSTEMI (62.2) | 62.0 (114 748) | 62.0 (112 495) | 62.7 (107 689) | 62.3 (92 051) |
| Unstable angina (6.3) | 8.8 (16 241) | 6.4 (11 547) | 5.3 (9135) | 4.3 (6273) |
| Insurance type, % | ||||
| Medicare | 58.1 (107 500) | 59.1 (107 377) | 58.0 (99 733) | 58.4 (86 194) |
| Medicaid | 12.4 (22 925) | 7.7 (13 948) | 6.2 (10 729) | 3.8 (5560) |
| Private | 18.5 (34 282) | 23.7 (42 960) | 27.2 (46 724) | 31.4 (46 367) |
| Self pay | 6.8 (12 630) | 5.7 (10 322) | 5.0 (8575) | 3.7 (5462) |
| No charge | 0.9 (1724) | 0.7 (1308) | 0.7 (1254) | 0.4 (587) |
| Other | 3.3 (6134) | 3.1 (5651) | 2.8 (4823) | 2.4 (3476) |
| Hospital type, % | ||||
| Public (14.6) | 14.5 (24 359) | 11.8 (19 586) | 11.8 (18 412) | 13.6 (18 702) |
| Non‐profit (69.2) | 65.3 (109 723) | 69.1 (114 373) | 73.2 (114 064) | 70.7 (96 975) |
| Profit (16.2) | 20.3 (34 058) | 19.1 (31 598) | 14.9 (23 273) | 15.69 (21 526) |
| Geographic state, % | ||||
| CA (35.8) | 35.5 (65 714) | 34.3 (62 182) | 36.5 (62 697) | 37.4 (55 245) |
| FL (29.6) | 31.9 (59 114) | 31.0 (56 260) | 28.3 (48 544) | 26.5 (39 051) |
| NY (23.1) | 21.1 (39 036) | 23.0 (41 802) | 23.6 (40 568) | 24.9 (36 774) |
| NJ (11.6) | 11.5 (21 343) | 11.8 (21 331) | 11.7 (20 042) | 11.2 (16 582) |
Gender missing in 20 731. Age missing in 22. Race missing in 37 233. Comorbidity missing in 20 379. Clinical presentation missing in 20 379. Insurance type missing in 20 419. Hospital type missing in 80 015. Geographic state missing in 20 379. All differences in statistics were significant across all 4 income quartiles (P<0.0001). CHF indicates congestive heart failure; COPD, chronic obstructive pulmonary disease; CVA, cerebrovascular accident; NSTEMI, non‐ST elevation myocardial infarction; PVD, peripheral vascular disease; STEMI, ST elevation myocardial infarction.
This study was approved by our institutional review committee.
Results
Patient Characteristics
A total of 835 070 hospitalizations for ACS were identified across the 5 states. Analysis of the demographics (Table 1) of the patient population studied showed that as income quartile increased, age at admission increased and comorbidities decreased (P<0.0001). The percentage of patients presenting with STEMI and NSTEMI increased as income quartile increased (P<0.0001), but those presenting with unstable angina decreased as income quartile increased (P<0.0001).
Procedure Use
We found that as ZIP code income quartile increased, patients were more likely to receive a coronary angiogram when presenting for ACS (60.6% of low income versus 66.0% of high income, P<0.0001 across all income groups) (Table 2). The percentage of those who received revascularization among those who had a prior angiogram also increased with higher socioeconomic status (71.5% for IQ 1, 74.7% for IQ 2, 75.3% for IQ 3, and 77.3% for IQ 4). After adjustment for patient characteristics and clustering by hospital, the odds ratio for receipt of an angiogram for the lowest quartile (1) compared with the highest income quartile (4) was 0.82 (95% CI 0.70 to 0.96) (Figure 1).
Table 2.
Procedures by Income Quartile (%)
| Income Quartile | |||||
|---|---|---|---|---|---|
| 1 | 2 | 3 | 4 | ||
| n=185 207 | n=181 575 | n=171 851 | n=147 652 | ||
| Angiogram | Any | 60.6 | 63.2 | 64.0 | 66.0 |
| Within 24 h if STEMI | 69.5 | 71.1 | 72.1 | 73.7 | |
| Within 48 h if NSTEMI | 47.6 | 49.5 | 49.7 | 51.8 | |
| Revascularization | Any | 43.3 | 47.2 | 48.2 | 51.0 |
| PCI | 35.5 | 38.7 | 39.9 | 42.8 | |
| If PCI, DES | 64.7 | 66.8 | 68.7 | 71.2 | |
| CABG | 8.1 | 8.9 | 8.8 | 8.6 | |
Angiogram, revascularization, PCI, and CABG data missing in 20 379. DES data missing in 7695. Angiogram within 24 hours if STEMI missing in 6000. Angiogram within 48 hours if NSTEMI missing in 12 199. All differences in statistics were significant across all 4 income quartiles (P<0.0001). DES indicates drug eluting stents; NSTEMI, non‐ST elevation myocardial infarction; PCI, percutaneous coronary intervention; STEMI, ST elevation myocardial infarction.
Figure 1.
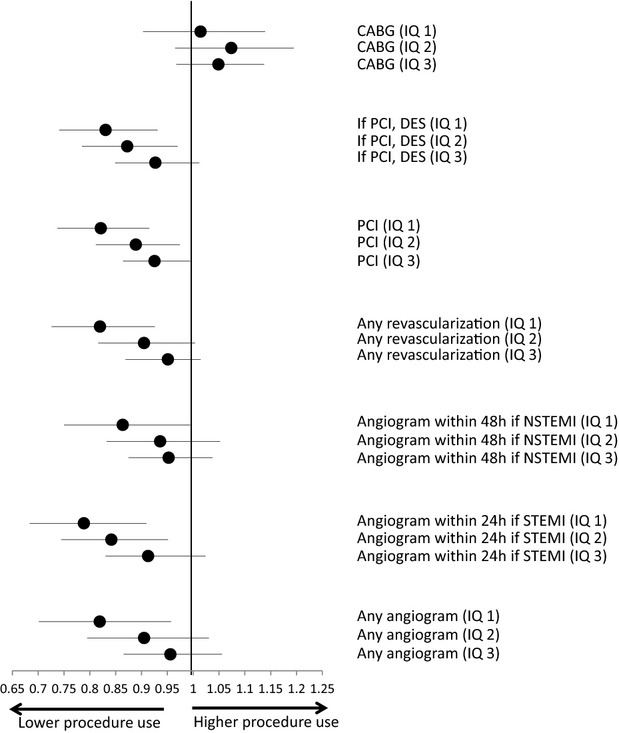
Adjusted procedures by income quartile. Odds ratios for income quartile influencing procedures for patients admitted with ACS from 2008 to 2011, adjusted for age, gender, race, comorbidities, insurance type, and clustering of patients within hospital. The highest income group (quartile 4) was used as the patient reference group. P value for CABG=0.28, P value for DES=0.02, P value for PCI=0.005, P value for any revascularization=0.01, P value for angiogram within 48 hours if NSTEMI=0.18, P value for angiogram within 24 hours if STEMI=0.01, P value for any angiogram=0.07. ACS indicates acute coronary syndrome; CABG, coronary artery bypass graft; DES, drug eluting stents; IQ, income quartile; NSTEMI, non‐ST elevation myocardial infarction; PCI, percutaneous coronary intervention; STEMI, ST elevation myocardial infarction.
Higher‐income ZIP code residents were also more likely (P<0.0001) to receive an angiogram within 24 hours of presentation with a STEMI (69.5% of lowest income versus 73.7% of highest income) and within 48 hours of an NSTEMI (47.6% of lowest income versus 51.8% of highest income). For STEMI patients, the adjusted odds ratio compared with the highest income quartile for receiving an angiogram within 24 hours was 0.79 (95% CI 0.68 to 0.91) for quartile 1. For NSTEMI patients, the adjusted odds ratio compared with the highest income quartile for receiving an angiogram within 48 hours was 0.86 (95% CI 0.75 to 0.99) for quartile 1.
Higher‐income ZIP code residents were also more likely to receive revascularization of any kind during the ACS admission (43.3% among lowest income versus 51.0% of highest income, P<0.0001 across all income groups). The adjusted odds ratio compared to income quartile 4 was 0.82 (95% CI 0.73 to 0.93) for quartile 1. Use of PCI as the method of revascularization was also less in lower‐income groups with an adjusted odds ratio compared to the highest income quartile of 0.82 (95% CI 0.74 to 0.91) for quartile 1. Differences in PCI use by income quartile persisted by geographic state as well (Table A1). However, after adjustment for patient and hospital characteristics, there was no income inequality noted for receiving coronary artery bypass surgery as the method of revascularization.
The inequality pattern persisted for use of a DES among those undergoing PCI. We found that as income quartile increased, patients were more likely to have a DES placed with an adjusted odds ratio compared with the highest income quartile of 0.83 (CI 0.74 to 0.93) for quartile 1. The relationship between higher‐income quartile and more DES use was present for all subgroups examined (race, payer, state). To discern whether the differences in DES versus BMS use may relate to STEMI versus NSTEMI diagnosis, we reanalyzed differences in stent choice by income quartile according to ACS diagnosis. We found that the differences in DES usage by income quartile persisted. Evaluation of temporal trends in DES use demonstrated that the percentage of patients who received a DES increased over the time period from 2008 to 2011 (Figure 2). Overall, higher‐income quartile was associated with higher DES use regardless of year. The relationship between income quartile and DES was also unchanged regardless of insurance status or state (data not shown).
Figure 2.
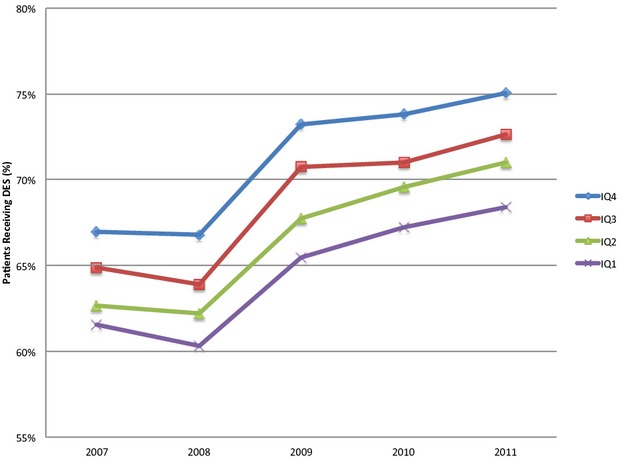
Temporal trends in DES use by income quartile. The percentage of patients who received a DES increased over the time period from 2008 to 2011. Overall, higher‐income quartile was associated with higher DES use regardless of year. DES indicates drug eluting stents; IQ, income quartile.
However, after additionally adjusting for the hospital's proportion of low‐income residents, out of all the procedures we examined, the only remaining significant trends when comparing income quartiles were for the use of a DES if PCI was performed (IQ 1 versus 4 OR 0.83 [CI 0.77 to 0.90, P<0.0001]), which favored the higher‐income patients (Table 3). When we included individual hospitals as a fixed effect, the differences by income were attenuated, but lower income remained significantly associated with less DES use.
Table 3.
Procedures by Income Quartile (OR±CI) Adjusted for Hospital Rate of Low‐income Patients
| 20% Increase in a Hospital's Fraction of Low Income Patients | P Value | Income Quartile | P Value | ||||
|---|---|---|---|---|---|---|---|
| 1 vs 4 | 2 vs 4 | 3 vs 4 | |||||
| Angiogram | Any | 0.90 (0.83 to 0.98) | 0.02 | 0.97 (0.88 to 1.06) | 0.97 (0.85 to 1.09) | 0.98 (0.89 to 1.08) | 0.86 |
| Within 24 h if STEMI | 0.91 (0.84 to 0.99) | 0.02 | 0.91 (0.83 to 1.00) | 0.89 (0.79 to 1.01) | 0.95 (0.85 to 1.05) | 0.20 | |
| Within 48 h if NSTEMI | 0.95 (0.88 to 1.02) | 0.16 | 0.92 (0.85 to 0.99) | 0.94 (0.86 to 1.02) | 0.95 (0.88 to 1.02) | 0.34 | |
| Revascularization | Any | 0.92 (0.86 to 0.99) | 0.02 | 0.93 (0.86 to 1.00) | 0.95 (0.86 to 1.05) | 0.96 (0.89 to 1.04) | 0.05 |
| PCI | 0.92 (0.87 to 0.98) | 0.008 | 0.93 (0.87 to 0.99) | 0.93 (0.82 to 1.00) | 0.95 (0.88 to 1.01) | 0.08 | |
| If PCI, DES | 1.00 (0.93 to 1.07) | 0.99 | 0.83 (0.77 to 0.90) | 0.87 (0.79 to 0.96) | 0.93 (0.85 to 1.01) | <0.0001 | |
| CABG | 1.00 (0.94 to 1.07) | 0.98 | 1.01 (0.93 to 1.10) | 1.07 (0.97 to 1.19) | 1.05 (0.97 to 1.14) | 0.13 | |
Angiogram within 24 hours if STEMI missing in 23 670. Angiogram within 48 hours if NSTEMI data missing in 58 176. DES data missing in 29 159. CABG, any angiogram, PCI, and any revascularization data missing in 92 377. Adjusted for age, gender, race, comorbidities, insurance payer, clustering of patients within hospital, and hospital rate of low‐income patients. Analysis of patients receiving DES was only among patients receiving PCI, thus the comparison was DES vs BMS. BMS indicates bare metal stent; DES, drug eluting stents; NSTEMI, non‐ST elevation myocardial infarction; PCI, percutaneous coronary intervention; STEMI, ST elevation myocardial infarction.
To examine if race mediated the effect of income on procedure use, we repeated these analyses without adjustment for race as a comparison, and found stronger income effects. For example, use of PCI as the method of revascularization without adjustment for race had an odds ratio versus the highest income quartile of 0.76 (95% CI 0.68 to 0.85) (compared with 0.82 [95% CI 0.74 to 0.91] after adjustment for race) for quartile 1.
Outcomes
Outcomes also differed by socioeconomic group (Table 4). As income quartile increased, there was slightly lower mortality for STEMI patients (10.8% for the lowest income versus 9.4% for the highest, P<0.0001 across all income groups).
Table 4.
Outcomes by Income Quartile
| Income Quartile | P Value | |||||
|---|---|---|---|---|---|---|
| 1 | 2 | 3 | 4 | |||
| n=185 201 | n=181 563 | n=171 847 | n=147 647 | |||
| Mortality, % | All ACS | 6.5 | 6.4 | 6.5 | 6.4 | 0.92 |
| STEMI | 10.8 | 10.1 | 9.6 | 9.4 | <0.0001 | |
| NSTEMI | 5.4 | 5.2 | 5.4 | 5.3 | 0.22 | |
| UA | 0.3 | 0.4 | 0.5 | 0.6 | 0.07 | |
| Re‐admission, % | All ACS | 9.9 | 10.1 | 10.2 | 10.4 | 0.02 |
| STEMI | 8.7 | 8.7 | 8.1 | 8.2 | 0.09 | |
| NSTEMI | 11.8 | 11.8 | 12.2 | 12.2 | 0.16 | |
| UA | 3.3 | 4.2 | 4.0 | 6.8 | <0.0001 | |
| Hospital LOS, days | All ACS | 5.5±6.7 | 5.4±6.5 | 5.3±6.3 | 5.3±6.7 | 0.02 |
| STEMI | 5.4±7.4 | 5.2±6.7 | 5.1±6.5 | 5.1±7.2 | 0.03 | |
| NSTEMI | 6.0±6.8 | 5.8±6.6 | 5.7±6.4 | 5.6±6.7 | 0.02 | |
| UA | 2.4±2.3 | 2.2±3.2 | 2.2±2.2 | 2.0±2.2 | 0.03 | |
LOS missing in 100. Re‐admission for all ACS missing in 6802, for STEMI in 1967, for NSTEMI in 4011, for UA in 852. Mortality for all ACS missing in 20 406, for STEMI in 6000, for NSTEMI in 12 442, for UA in 1905. ACS indicates acute coronary syndrome; LOS, length of stay; NSTEMI, non‐ST elevation myocardial infarction; STEMI, ST elevation myocardial infarction; UA, unstable angina.
Thirty‐day re‐admission rates were modestly higher among higher socioeconomic groups (9.9% for lower‐income versus 10.4% for higher‐income groups, P=0.02 across all income groups). Of note, this difference was driven by the unstable angina patients (3.3% re‐admission rate for lower income versus 6.8% among higher‐income, P<0.0001 across all income groups).
In order to assess whether changes in quality or procedural intervention rates might influence the outcomes inequalities seen across income quartiles, we re‐evaluated mortality outcomes after adjusting for use of primary PCI (Figure 3). For the patients presenting with STEMI, after adjustment for comorbidities but before adjustment for primary PCI, we found that as income quartile increased, mortality decreased. Compared to the highest income quartile (4), the OR for income quartile 1 was 1.17 (95% CI 1.11 to 1.25). After adjustment for PCI within 24 hours of STEMI diagnosis, the inequality among income quartiles (relative to the highest income quartile) decreased to an adjusted OR of 1.14 for income quartile 1 versus 4 (95% CI 1.07 to 1.21). Similar patterns were found for the other income quartiles.
Figure 3.
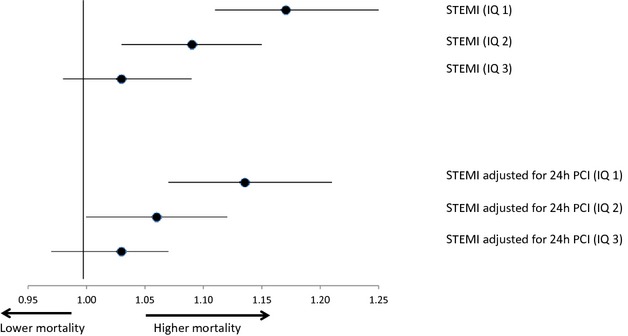
Mortality adjusted for revascularization by income quartile. Odds ratios for income quartile influencing mortality for patients admitted with ACS from 2008 to 2011, adjusted for age, gender, race, comorbidities, insurance type, clustering of patients within hospital, and primary PCI. The highest income group (quartile 4) was used as the patient reference group. P value for STEMI <0.0001, P value for STEMI adjusted for 24 hours PCI=0.0003. ACS indicates acute coronary syndrome; IQ, income quartile; PCI, percutaneous coronary intervention; STEMI, ST elevation myocardial infarction.
To examine if race mediated the effect of income on mortality after STEMI, we repeated these analyses without adjustment for race as a comparison, and in contrast to the effects seen with procedure use, there was no significant effect of race observed with mortality. Mortality after STEMI without adjustment for race had an odds ratio versus the highest income quartile of 1.17 (95% CI 1.10 to 1.24) for quartile 1, compared with 1.17 (95% CI 1.11 to 1.25) after adjustment for race.
Discussion
We found that for the more well‐accepted treatment for coronary artery disease (namely, coronary artery bypass surgery), inequalities attributable to individual neighborhood income have faded. However, for DES use, an expensive and until more recently, controversial revascularization choice, income inequalities have persisted. Our study also confirmed the link between quality of care and outcome inequalities with use of early PCI explaining in part the differences in mortality across income groups. We also found that race appears to explain about 25% of the effect of income on PCI use.
Prior studies have found disparities to be most striking for expensive procedures.25–26 Our data substantiate these findings. However, we demonstrate that bypass surgery was no longer more frequent in higher‐income patients, in contrast to older studies.27–28 One might speculate that since bypass surgery is no longer a novel technique (though still expensive), that it is now more readily adopted for all patients regardless of socioeconomic status and also more readily accessible. However, it is also possible that patients of lower socioeconomic status have more severe and complex coronary disease, especially given their greater comorbidities, making them better surgical than percutaneous coronary intervention candidates. Furthermore, surgery does not involve delivery of stent material that would require post‐procedural strict adherence to a dual antiplatelet regimen. It is also possible that hospitals serving lower‐income patients may abide more closely to the evidence that bypass surgery provides a more established benefit in terms of major adverse cardiac events compared with PCI.29 One older study suggested that inappropriate use of percutaneous transluminal coronary angioplasty was greater than for coronary artery bypass surgery, which raises the question of whether patients of lower socioeconomic groups may be treated equally to those of higher‐income groups only when the indications are extremely clear and deemed necessary.30
In contrast, we find that the recent differences in use of angiography and stenting continue to mirror related studies of income, race, and insurance payer from years ago.14,31–33 For example, when Rose et al6 evaluated myocardial infarction patients from the Atherosclerosis Risk in Communities Study (1993‐2002) stratified by neighborhood‐level income, black patients in the low (OR 0.60, 0.54 to 0.66) and medium (OR 0.70, 0.60 to 0.78) income groups as well as white patients in the low income group (OR 0.83, 0.75 to 0.91) were less likely to receive angiography compared with the highest income tertile. Similarly, Casale et al7 found that the lowest‐income quintile was associated with not undergoing PCI (OR 0.87, 0.80 to 0.94). Regarding our finding of higher use of DES among higher‐income groups, the most obvious explanation may be related to the fact that higher‐income patients are more likely to have insurance to cover a higher cost procedure and subsequent dual antiplatelet therapy. Whether verification of insurance status is actually performed prior to performing PCI is unclear, but the simple perception of this may be enough to influence physician choices. Another important aspect may be the perception of the reliability of the patient to comply with a longer requirement for strict dual antiplatelet therapy post‐PCI, especially given prior studies suggesting lower compliance among patients who have more comorbidities or younger age,34 consistent with the lower socioeconomic groups in our study.
A recent study of Medicare patients showed that income inequality was associated with re‐hospitalization in acute myocardial infarction patients.35 It raised the question of whether differences based on inequality were due to “contextual” factors (not relating to an individual's income) or “compositional” factors (more poverty is found in more unequal societies). One could posit that in a society with more inequality, the patient social support systems or the healthcare delivery options may be worse, which may be unrelated to an individual's actual income.
However, it is important to note that we found the inequalities in DES usage persisted after adjustment for hospital rate of low‐income patients and remained statistically significant after including individual hospitals as a fixed effect. This suggests that even after hospital‐wide standard practices and community resource‐related factors are accounted for, certain individual effects remain. While many observed health disparities are explained by poor patients' poor choice of hospitals,36 our data suggests that the differences in DES usage cannot be entirely explained by this.
The finding that patients of higher socioeconomic status had higher rates of PCI within 24 hours of STEMI diagnosis or 48 hours of NSTEMI diagnosis suggests a further deficiency in basic quality measures for low‐income patients. While door‐to‐balloon times for STEMI have decreased among minorities over time 37 and substantially improved for women and the elderly,38 our data reveals that socioeconomic inequalities persist. There are a number of possible explanations for this. On a strict cost‐based analysis, prior research shows that an early invasive strategy is more costly for the index hospitalization, even if it might be cost‐effective in the long run.39 We can speculate at the clinical factors that may also be at play. If a low‐income patient presents with a STEMI or NSTEMI, treatment may be delayed as the physician may spend more time trying to assess if there are any contraindications to antiplatelet therapy. This may be more difficult to assess if the patient is less educated about his medical history, does not have consistent medical records, or lacks a reliable way to obtain antiplatelet therapy post‐procedure. A lower‐income patient may also not be as well versed at describing his symptoms, nor may he feel empowered enough to self‐advocate. Higher‐income patients may also have higher expectations in terms of reasonable wait times when presenting with chest pain. Since lower‐income groups are composed of more minority patients, conscious or unconscious discrimination could also still be a factor.40–41
Not surprisingly, the differences observed in revascularization, timing, and stent choice, appear to be associated with higher mortality rates, even after adjusting for patient characteristics. However, a somewhat unexpected finding is the lower re‐admission rates among lower‐income groups who present with unstable angina. A similar finding was reported from Canada.42 Rather than suggesting that patients of lower‐income groups have less recurrence of symptoms, our results raise the question of whether patients who deal with unstable angina who are of lower socioeconomic groups are simply less likely to present to the hospital again in a recent time frame, as prior studies suggest.43–44 They may have different expectations from the medical system, poorer understanding of their own condition, or less financial capability to do so. One prior study suggests they may refuse care even when offered.45 This finding is consistent with their lower rates of index admission for unstable angina, despite higher rates of admission for NSTEMI and STEMI. One could argue that poorer patients have a higher threshold for returning to the hospital, which is met by only the latter two conditions.
Another aspect of our analysis was a preliminary inquiry into the effects of race. Race is highly correlated with income.46 In order to determine how much of the income effect was explained by race, we performed analyses both with and without adjustment for race. We found that for use of PCI, there was a 25% contribution of race to the income effect. However, for mortality, there was no clear effect seen. This suggests that depending on the procedure and outcome studied, the contribution of race to the income effect is likely to vary. A full evaluation of these variations is beyond the scope of this analysis, but should be the subject of future studies.
One of our study's main strengths is that it captures data for all hospitalizations for ACS from 2008 to 2011 from the selected states, free from any biases such as insurance status or physician reporting. However, inherent in this kind of dataset is that certain aspects of the admission cannot be reliably discerned, such as rate of thrombolytic use and contraindications to dual antiplatelet therapy. Our study also lacks clinical detail, such as left ventricular function and severity of coronary disease. We are also unable to discern if patients do not receive PCI because they refuse it or are too sick to receive it, or if BMS may be chosen over DES because the patient may not have reliable access to costly dual antiplatelet therapy. This information would be useful for better understanding the nuances of the inequalities observed, but will require further evaluation. Another limitation of the HCUP data is that a single patient would have appeared more than once if he or she had a second acute coronary syndrome during the year. We used patient ZIP code to estimate income, which could result in misclassification as it is an ecologic measure requiring relative homogeneity of household income within a geographic area for it to be a reliable measure of individual socioeconomic status.47 Furthermore, neighborhood income may represent geography and distance to hospitals. However, numerous previous studies have done the same 48–49 and prior evaluation has found disparities at both the ZIP code and individual level of analysis.50 With regards to inequalities in PCI use, it is important to emphasize that we evaluated only patients presenting to the hospital with ACS, which does not include elective or outpatient PCI cases. It is possible that the inequalities we found might be worse among elective PCI patients. We also note that a stronger effect on mortality may have been observed if we were to extend evaluation beyond in‐hospital mortality outcomes. While we adjusted extensively for patient characteristics and hospital factors, it is still possible that unadjusted covariates may persist.
With the implementation of the Affordable Care Act, we may soon encounter larger numbers of lower socioeconomic patients accessing cardiovascular care, making these findings even more important to understand. While our recent data is promising in that socioeconomic inequalities for more common procedures such as coronary artery bypass surgery and BMS use have declined, it is apparent that they still exist for DES usage and PCI timing. These persistent inequalities by income have important implications for cardiovascular outcomes. After adjustment for use of primary PCI in our study, inequalities in mortality across income quartiles decreased. This suggests a sharper focus for our efforts to improve disparities in cardiovascular mortality. While there has been tremendous investment in developing novel techniques and advanced technology for percutaneous intervention in recent years, these arguably offer only incremental gains for improving cardiovascular disease. We may actually stand to gain the most additional benefit for our lowest socioeconomic groups by simply targeting more timely revascularization when appropriate.
Appendix
A1.
PCI (%) by State and Income Quartile (all P Values <0.0001)
| State | Income Quartile | PCI (%) |
|---|---|---|
| CA | IQ1 | 33.59 |
| IQ2 | 37.08 | |
| IQ3 | 38.66 | |
| IQ4 | 43.56 | |
| FL | IQ1 | 39.31 |
| IQ2 | 41.29 | |
| IQ3 | 43.20 | |
| IQ4 | 45.43 | |
| NJ | IQ1 | 34.77 |
| IQ2 | 39.71 | |
| IQ3 | 39.53 | |
| IQ4 | 39.95 | |
| NY | IQ1 | 33.40 |
| IQ2 | 36.89 | |
| IQ3 | 37.84 | |
| IQ4 | 40.10 |
Sources of Funding
Yong is funded by a Merck/ACC Cardiovascular Research Fellowship.
Disclosures
None.
References
- 1.The Institute of Medicine Report. Unequal Treatment: Confronting Racial and Ethnic Disparities in Health Care. 2002Washington, DC: National Academy Press [Google Scholar]
- 2.US Department of Health and Human Services. Healthy people 2020 Available at: www.health.gov/healthypeople. Accessed October 13, 2014. [DOI] [PubMed]
- 3.Jha A, Fisher E, Li Z, Oray EJ, Epstein A. Racial trends in the use of major procedures among the elderly. N Engl J Med. 2005; 353:683-691. [DOI] [PubMed] [Google Scholar]
- 4.Kennedy BP, Kawachi I, Prothrow‐Stith D. Income distribution and mortality: cross sectional ecological study of the Robin Hood index in the United States. BMJ. 1996; 312:1004-1007. [DOI] [PMC free article] [PubMed] [Google Scholar]
- 5.Kondo N, Sembajwe G, Kawachi I, van Dam RM, Subramanian SV, Yamagata Z. Income inequality, mortality, and self rated health: meta‐analysis of multi‐level studies. BMJ. 2009; 339:b4471. [DOI] [PMC free article] [PubMed] [Google Scholar]
- 6.Rose KM, Foraker RE, Heiss G, Rosamond WD, Suchindran CM, Whitsel EA. Neighborhood socioeconomic and racial disparities in angiography and coronary revascularization: the ARIC surveillance study. Ann Epidemiol. 2012; 22:623-629. [DOI] [PMC free article] [PubMed] [Google Scholar]
- 7.Casale SN, Auster CJ, Wolf F, Pei Y, Devereux RB. Ethnicity and socioeconomic status influence use of primary angioplasty in patients presenting with acute myocardial infarction. Am Heart J. 2007; 154:989-993. [DOI] [PubMed] [Google Scholar]
- 8.Philbin EF, McCullough PA, DiSalvo TG, Dec GW, Jenkins PL, Weaver WD. Socioeconomic status is an important determinant of the use of invasive procedures after acute myocardial infarction in New York State. Circulation. 2000; 102:107-115. [DOI] [PubMed] [Google Scholar]
- 9.Kao J, Vicuna R, House J, Rumsfeld JS, Ting HH, Spertus JA. Disparity in drug‐eluting stent utilization by insurance type. Am Heart J. 2008; 156:1133-1140. [DOI] [PubMed] [Google Scholar]
- 10.Vaccarino V, Rathore SS, Wenger NK, Frederick PD, Abramson JL, Barron HV, Manhapra A, Mallik S, Krumholz HMNational Registry of Myocardial Infarction Investigators. Sex and racial differences in the management of acute myocardial infarction, 1994 through 2002. N Engl J Med. 2005; 353:671-682. [DOI] [PMC free article] [PubMed] [Google Scholar]
- 11.Sonel AF, Good CB, Mulgund J, Roe MT, Gibler WB, Smith SC, Jr, Cohen MG, Pollack CV, Jr, Ohman EM, Peterson EDCRUSADE Investigators. Racial variations in treatment and outcomes of black and white patients with high‐risk non‐ST‐elevation acute coronary syndromes: insights from CRUSADE (Can Rapid Risk Stratification of Unstable Angina Patients Suppress Adverse Outcomes With Early Implementation of the ACC/AHA Guidelines?). Circulation. 2005; 111:1225-1232. [DOI] [PubMed] [Google Scholar]
- 12.Asch SM, Kerr EA, Keesey J, Adams JL, Setodji CM, Malik S, McGlynn EA. Who is at greatest risk for receiving poor‐quality health care? N Engl J Med. 2006; 354:1147-1156. [DOI] [PubMed] [Google Scholar]
- 13.Movahed MR, Ramaraj R, Jamal MM, Hashemzadeh M. Nationwide trends in the utilisation of percutaneous coronary intervention (PCI) in the United States of America based on gender and ethnicities. Eurointervention. 2009; 5:343-348. [DOI] [PubMed] [Google Scholar]
- 14.Hannan EL, Racz M, Walford G, Clark LT, Holmes DR, King SB, III, Sharma S. Differences in utilization of drug‐eluting stents by race and payer. Am J Cardiol. 2007; 100:1192-1198. [DOI] [PubMed] [Google Scholar]
- 15.Federspiel JJ, Sterans SC, Reiter KL, Geissler KH, Triplette MA, D'Arey LP, Sheridan BC, Rossi JS. Disappearing and reappearing differences in drug‐eluting stent use by race. J Eval Clin Pract. 2013; 19:256-262. [DOI] [PMC free article] [PubMed] [Google Scholar]
- 16.Roe MT, Chen AY, Cannon CP, Rao S, Rumsfeld J, Magid DJ, Brindis R, Klein LW, Gibler WB, Ohman EM, Peterson EDCRUSADE and ACTION‐GWTG Registry Participants. Temporal changes in the use of drug‐eluting stents for patients with non‐ST segment elevation myocardial infarction undergoing percutaneous coronary intervention from 2006 to 2008: results from the can rapid risk stratification of unstable angina patients suppress ADverse outcomes with early implementation of the ACC/AHA guidelines (CRUSADE) and acute coronary treatment and intervention outcomes network‐get with the guidelines (ACTION‐GWTG) registries. Circ Cardiovasc Qual Outcomes. 2009; 2:414-420. [DOI] [PubMed] [Google Scholar]
- 17.Ritchie JL, Maynard C, Chapko MK, Every NR, Martin DC. Association between percutaneous transluminal coronary angioplasty volumes and outcomes in the Healthcare Cost and Utilization Project 1993–1994. Am J Cardiol. 1999; 83:493-497. [DOI] [PubMed] [Google Scholar]
- 18.Opotowsky AR, Siddiqi OK, Webb GD. Trends in hospitalizations for adults with congenital heart disease in the U.S. J Am Coll Cardiol. 2009; 54:460-467. [DOI] [PubMed] [Google Scholar]
- 19.Owens PL, Barrett ML, Raetzman S, Maggard‐Gibbons M, Steiner CA. Surgical site infections following ambulatory surgery procedures. JAMA. 2014; 311:709-716. [DOI] [PubMed] [Google Scholar]
- 20.Antman EM, Anbe DT, Armstrong PW, Bates ER, Green LA, Hand M, Hochman JS, Krumholz HM, Kushner FG, Lamas GA, Mullany CJ, Ornato JP, Pearle DL, Sloan MA, Smith SC, Jr, Alpert JS, Anderson JL, Faxon DP, Fuster V, Gibbons RJ, Gregoratos G, Halperin JL, Hiratzka LF, Hunt SA, Jacobs AK. ACC/AHA guidelines for the management of patients with ST‐elevation myocardial infarction–executive summary: a report of the American College of Cardiology/American Heart Association Task Force on Practice Guidelines (Writing Committee to Revise the 1999 Guidelines for the Management of Patients With Acute Myocardial Infarction). Circulation. 2004; 110:588-636. [DOI] [PubMed] [Google Scholar]
- 21.O'Gara PT, Kushner FG, Ascheim DD, Casey DE, Jr, Chung MK, de Lemos JA, Ettinger SM, Fang JC, Fesmire FM, Franklin BA, Granger CB, Krumholz HM, Linderbaum JA, Morrow DA, Newby LK, Ornato JP, Ou N, Radford MJ, Tamis‐Holland JE, Tommaso CL, Tracy CM, Woo YJ, Zhao DX. 2013 ACCF/AHA guideline for the management of ST‐elevation myocardial infarction: a report of the American College of Cardiology Foundation/American Heart Association Task Force on Practice Guidelines. Circulation. 2013; 127:362-425. [DOI] [PubMed] [Google Scholar]
- 22.Cannon CP, Weintraub WS, Demopoulos LA, Vicari R, Frey MJ, Lakkis N, Neumann FJ, Robertson DH, DeLucca PT, DiBattiste PM, Gibson CM, Braunwald ETACTICS (Treat Angina with Aggrastat and Determine Cost of Therapy with an Invasive or Conservative Strategy)—Thrombolysis in Myocardial Infarction 18 Investigators. Comparison of early invasive and conservative strategies in patients with unstable coronary syndromes treated with the glycoprotein IIb/IIIa inhibitor tirofiban. N Engl J Med. 2001; 344:1879-1887. [DOI] [PubMed] [Google Scholar]
- 23.Moses JW, Leon MB, Popma JJ, Fitzgerald PJ, Holmes DR, O'Shaughnessy C, Caputo RP, Kereiakes DJ, Williams DO, Teirstein PS, Jaeger JL, Kuntz RESIRIUS Investigators. Sirolimus‐eluting stents versus standard stents in patients with stenosis in a native coronary artery. N Engl J Med. 2003; 349:1315-1323. [DOI] [PubMed] [Google Scholar]
- 24.Stone GW, Ellis SG, Cox DA, Hermiller J, O'Shaughnessy C, Mann JT, Turco M, Caputo R, Bergin P, Greenberg J, Popma JJ, Russell METAXUS‐IV Investigators. One‐year clinical results with the slow‐release, polymer‐based, paclitaxel‐eluting TAXUS stent: the TAXUS‐IV trial. Circulation. 2004; 109:1942-1947. [DOI] [PubMed] [Google Scholar]
- 25.Kressin NR, Petersen LA. Racial differences in the use of invasive cardiovascular procedures: review of the literature and prescription for future research. Ann Intern Med. 2001; 135:352-366. [DOI] [PubMed] [Google Scholar]
- 26.Escarce JJ, Epstein KR, Colby DC, Schwartz JS. Racial differences in the elderly's use of medical procedures and diagnostic tests. Am J Public Health. 1993; 83:948-954. [DOI] [PMC free article] [PubMed] [Google Scholar]
- 27.Petersen LA, Wright SM, Peterson ED, Daley J. Impact of race on cardiac care and outcomes in veterans with acute myocardial infarction. Med Care. 2002; 40:I86-I96. [DOI] [PubMed] [Google Scholar]
- 28.Rothenberg BM, Pearson T, Zwanziger J, Mukamel D. Explaining disparities in access to high‐quality cardiac surgeons. Ann Thorac Sug. 2004; 78:18-24. [DOI] [PubMed] [Google Scholar]
- 29.Serruys PW, Morice M, Kappetein AP, Colombo A, Holmes DR, Mack MJ, Stahle E, Feldman TE, van de Brand M, Bass EJ, Van Dyck N, Leadley K, Dawkins KD, Mohr FWfor the SYNTAX Investigators. Percutaneous coronary intervention versus coronary‐artery bypass grafting for severe coronary artery disease. N Engl J Med. 2009; 360:961-972. [DOI] [PubMed] [Google Scholar]
- 30.Schneider EC, Leape LL, Weissman JS, Piana RN, Gatsonis C, Epstein AM. Racial differences in cardiac revascularization rates: does “overuse” explain higher rates among white patients? Ann Intern Med. 2001; 135:328-337. [DOI] [PubMed] [Google Scholar]
- 31.Sabatine MS, Blake GJ, Drazner MH, Morrow DA, Scirica BM, Murphy SA, McCabe CH, Weintraub WS, Gibson CM, Cannon CP. Influence of race on death and ischemic complications in patients with non‐ST‐elevation acute coronary syndromes despite modern, protocol‐guided treatment. Circulation. 2005; 111:1217-1224. [DOI] [PubMed] [Google Scholar]
- 32.Sada MJ, French WJ, Carlisle DM, Chandra NC, Gore JM, Rogers WJ. Influence of payor on use of invasive cardiac procedures and patient outcome after myocardial infarction in the United States. Participants in the National Registry of Myocardial Infarction. J Am Coll Cardiol. 1998; 31:1474-1480. [DOI] [PubMed] [Google Scholar]
- 33.Chen J, Rathore SS, Radford MJ, Mehta RH, Brogan GX, Jr, Delong ER, Fintel DJ, Gibler WB, Ohman EM, Smith SC, Jr, Peterson ED. Racial differences in the use of cardiac catheterization after acute myocardial infarction. N Engl J Med. 2001; 344:1443-1449. [DOI] [PubMed] [Google Scholar]
- 34.Zhu B, Zhao Z, McCollam P, Anderson J, Bae JP, Fu H, Zettler M, Lenarz L. Factors associated with clopidogrel use, adherence, and persistence in patients with acute coronary syndromes undergoing percutaneous coronary intervention. Curr Med Res Opin. 2011; 27:633-641. [DOI] [PubMed] [Google Scholar]
- 35.Lindenauer PK, Lagu T, Rothberg MB, Avrunin J, Pekow PS, Wang Y, Krumholz HM. Income inequality and 30 day outcomes after acute myocardial infarction, heart failure, and pneumonia: retrospective cohort study. BMJ. 2013; 346:521. [DOI] [PMC free article] [PubMed] [Google Scholar]
- 36.Kahn KL, Pearson ML, Harrison ER, Desmond KA, Rogers WH, Rubenstein LV, Brook RH, Keeler EB. Health care for black and poor hospitalized Medicare patients. JAMA. 1994; 271:1169-1174. [PubMed] [Google Scholar]
- 37.Curtis JP, Herrin J, Bratzler DW, Bradley EH, Krumholz HM. Trends in race‐based differences in door‐to‐balloon times. Arch Intern Med. 2010; 170:992-993. [DOI] [PubMed] [Google Scholar]
- 38.Krumholz HM, Herrin J, Miller LE, Drye EE, Ling SM, Han LF, Rapp MT, Bradley EH, Nallamothu BK, Nsa W, Bratzler DW, Curtis JP. Improvements in door‐to‐balloon time in the United States, 2005 to 2010. Circulation. 2011; 124:1038-1045. [DOI] [PMC free article] [PubMed] [Google Scholar]
- 39.Mahoney EM, Jurkovitz CT, Chu H, Becker ER, Culler S, Kosinski AS, Robertson DH, Alexander C, Nag S, Cook JR, Demopoulos LA, DiBattiste PM, Cannon CP, Weintraub WSTACTICS‐TIMI 18 Investigators. Cost and cost‐effectiveness of an early invasive vs conservative strategy for the treatment of unstable angina and non‐ST‐segment elevation myocardial infarction. JAMA. 2002; 288:1851-1858. [DOI] [PubMed] [Google Scholar]
- 40.Bradley EH, Herrin J, Wang Y, McNamara RL, Webster TR, Magid DJ, Blaney M, Peterson ED, Canto JG, Pollack CV, Jr, Krumholz HM. Racial and ethnic differences in time to acute reperfusion therapy for patients hospitalized with myocardial infarction. JAMA. 2004; 292:1563-1572. [DOI] [PubMed] [Google Scholar]
- 41.Schulman KA, Berlin JA, Harless W, Kerner JF, Sistrunk S, Gersh BJ, Dubé R, Taleghani CK, Burke JE, Williams S, Eisenberg JM, Escarce JJ. The effect of race and sex on physicians' recommendations for cardiac catheterization. N Engl J Med. 1999; 340:618-626. [DOI] [PubMed] [Google Scholar]
- 42.Alter DA, Austin PC, Tu JVCanadian Cardiovascular Outcomes Research Team. Community factors, hospital characteristics and inter‐regional outcome variations following acute myocardial infarction in Canada. Can J Cardiol. 2005; 21:247-255. [PubMed] [Google Scholar]
- 43.Moser DK, Kimble LP, Alberts MJ, Alonzo A, Croft JB, Dracup K, Evenson KR, Go AS, Hand MM, Kothari RU, Mensah GA, Morris DL, Pancioli AM, Riegel B, Zerwic JJ. Reducing delay in seeking treatment by patients with acute coronary syndrome and stroke: a scientific statement from the American Heart Association Council on Cardiovascular Nursing and Stroke Council. Circulation. 2006; 114:168-182. [DOI] [PubMed] [Google Scholar]
- 44.Struthers R, Savik K, Hodge FS. American Indian women and cardiovascular disease: response behaviors to chest pain. J Cardiovasc Nurs. 2004; 19:158-163. [DOI] [PMC free article] [PubMed] [Google Scholar]
- 45.Heidenreich PA, Shlipak MG, Geppert J, McClellan M. Racial and sex differences in refusal of coronary angiography. Am J Med. 2002; 113:200-207. [DOI] [PubMed] [Google Scholar]
- 46.U.S. Bureau of the Census. Income, poverty, and health insurance coverage in the United States. 2011. Available at: www.census.gov. Accessed May 17, 2013.
- 47.Wakefield J. Ecologic studies revisited. Annu Rev Public Health. 2008; 29:75-90. [DOI] [PubMed] [Google Scholar]
- 48.Rao SV, Schulman KA, Curtis LH, Gersh BJ, Jollis JG. Socioeconomic status and outcome following acute myocardial infarction in elderly patients. Arch Intern Med. 2004; 164:1128-1133. [DOI] [PubMed] [Google Scholar]
- 49.Subherwal S, Patel MR, Tang F, Smolderen KG, Jones WS, Tsai TT, Ting HH, Bhatt DL, Spertus JA, Chan PS. Socioeconomic disparities in the use of cardioprotective medications among patients with peripheral artery disease: an analysis of the American College of Cardiology's NCDR PINNACLE Registry. J Am Coll Cardiol. 2013; 62:51-57. [DOI] [PMC free article] [PubMed] [Google Scholar]
- 50.Axelrod DA, Dzebisashvili N, Schnitzler MA, Salvalaggio PR, Segev DL, Gentry SE, Tuttle‐Newhall J, Lentine KL. The interplay of socioeconomic status, distance to center, and interdonor service area travel on kidney transplant access and outcomes. Clin J Am Soc Nephrol. 2010; 5:2276-2288. [DOI] [PMC free article] [PubMed] [Google Scholar]