

Abstract
Background
Socioeconomic status (SES) as reflected by residential zip code status may detrimentally influence a number of prehospital clinical, access‐related, and transport variables that influence outcome for patients with ST‐elevation myocardial infarction (STEMI) undergoing reperfusion. We sought to analyze the impact of SES on in‐hospital mortality, timely reperfusion, and cost of hospitalization following STEMI.
Methods and Results
We used the 2003–2011 Nationwide Inpatient Sample database for this analysis. All hospital admissions with a principal diagnosis of STEMI were identified using ICD‐9 codes. SES was assessed using median household income of the residential zip code for each patient. There was a significantly higher mortality among the lowest SES quartile as compared to the highest quartile (OR [95% CI]: 1.11 [1.06 to 1.17]). Similarly, there was a highly significant trend indicating a progressively reduced timely reperfusion among patients from lower quartiles (OR [95% CI]: 0.80 [0.74 to 0.88]). In addition, there was a lower utilization of circulatory support devices among patients from lower as compared to higher zip code quartiles (OR [95% CI]: 0.85 [0.75 to 0.97]). Furthermore, the mean adjusted cost of hospitalization among quartiles 2, 3, and 4, as compared to quartile 1 was significantly higher by $913, $2140, and $4070, respectively.
Conclusions
Patients residing in zip codes with lower SES had increased in‐hospital mortality and decreased timely reperfusion following STEMI as compared to patients residing in higher SES zip codes. The cost of hospitalization of patients from higher SES quartiles was significantly higher than those from lower quartiles.
Keywords: acute myocardial infarction, mortality, socioeconomic status, STEMI, zip code
Introduction
It is well known that there is an increased burden of cardiovascular disease and its risk factors among patients with lower socioeconomic status (SES).1–3 In the last decade, eliminating disparities in healthcare delivery in the United States has been governed largely by the Healthy People 2010 initiative, which has aimed to improve cardiovascular health among all citizens.4 The ultimate goal of ST‐elevation myocardial infarction (STEMI) care should be to achieve optimal and equitable outcomes for one and all, regardless of their residential status. In this context, a number of cultural, clinical, economic, geographic, and access‐related issues could influence the time from symptom onset to first medical contact. While these variables are difficult to individually quantify, SES measured by zip code is likely a useful surrogate. Several prior studies have validated this approach for imputing individual SES in epidemiologic settings.5–10 Residential zip‐code‐based classification of SES may reflect the aggregate characteristics of its residents and the prevailing healthy and unhealthy habits, which serves to provide an insight into environmental attributes (like available healthcare resources) that may have a direct or indirect impact on its residents' health. Although there has been research demonstrating the negative impact of low SES upon outcomes following acute coronary syndromes, most of these studies belong to the era where primary percutaneous intervention (PCI) was not the mainstay of treatment of STEMI and the emphasis on door‐to‐balloon time optimization was just beginning.11–15 To that end, we aimed to evaluate the disparities and outcomes in patients presenting with STEMI according to the SES, in the contemporary era where expeditious reperfusion forms the mainstay of STEMI management.
Methods
Data Source
Data were obtained from the Nationwide Inpatient Sample (NIS) database from 2003 to 2011. The NIS is sponsored by the Agency for Healthcare Research and Quality as a part of Healthcare Cost and Utilization Projection. The NIS contains discharge level data from ≈8 million hospitalizations annually from about 1000 hospitals across the United States. This database is designed to represent a 20% stratified sample of all hospitals in the country. Criteria used for stratified sampling of hospitals into the NIS include location (urban or rural), teaching status, geographic region, patient volume, and hospital ownership.
Study Population
The NIS database provides up to 15 diagnoses and 15 procedures for each hospitalization record for the years 2003–2009. The number of diagnoses coded in the database was expanded to 25 for the years 2010–2011. All these have been coded using the standard International Classification of Diseases, ninth edition, Clinical Modification (ICD‐9 CM) codes. The first diagnosis in the database is referred to as the “principal diagnosis” and is considered the primary reason for admission to the hospital. All hospitalizations with the principal diagnosis of STEMI were included in our study. These were identified using ICD‐9 CM codes of 410.0x, 410.1x, 410.2x, 410.3x, 410.4x, 410.5x, 410.6x, and 410.8x. We used the Healthcare Cost and Utilization Projection Clinical Classification Software to identify patient comorbidities and procedures.16 Clinical Classification Software has been developed by the Agency for Healthcare Research and Quality for clustering patient diagnoses and procedures into a manageable number of clinically meaningful categories.16 We identified patients undergoing diagnostic coronary angiography with the Clinical Classification Software code of 47 that corresponds to ICD‐9 CM codes of 37.21 to 37.23 and 88.52 to 88.57. Patients undergoing PCI were identified using the Clinical Classification Software code of 45 (corresponding to ICD‐9 CM codes of 00.66, 36.01, 36.02, and 36.05) along with ICD‐9 CM codes of 36.06 and 36.07. Patients undergoing thrombolysis were identified using ICD‐9 CM codes of 99.10 or V45.88. Baseline characteristics available for analysis included age, gender, race, primary source of payment, weekday versus weekend admission, Elixhauser comorbidities defined by Agency for Healthcare Research and Quality along with other clinically relevant comorbidities (smoking, family history of coronary artery disease, prior MI, and dyslipidemia).17–18 Hospital characteristics such as region (Northeast, Midwest, South, West), bed size (small, medium, large), location (rural, urban), and teaching status were also included.
The primary variable of interest was the SES assessed using patient's residential zip code. The NIS has classified each zip code into quartiles based on median household income of each zip code. These quartiles are the following: quartile 1: $1 to $37 999, quartile 2: $38 000 to $47 999, quartile 3: $48 000 to $62 999, quartile 4: $63 000 or more. Residential zip‐code‐based classification of SES is known to reflect aggregate characteristics of its residents and an insight into environmental attributes (such as available healthcare resources) that may have a direct or indirect impact on its residents' health. Although a composite measure of SES that includes several variables such as directly measured household income, education, race, and residential zip code might provide incremental information regarding individual SES, we chose to utilize the residential zip‐code‐based classification. This is because of its successful validation in prior studies along with the fact that it reflects aggregate characteristics over individual characteristics, which often govern healthcare delivery. Besides this, several characteristics that may be useful in defining composite measures of SES such as education and household income were not available in the administrative database of NIS.
Study Outcomes
In‐hospital mortality and timely reperfusion therapy were treated as co‐primary outcomes. Since the time to PCI or thrombolysis was available in calendar days only, all patients who underwent PCI or thrombolysis on “day 0” of the hospitalization were assumed to have undergone “timely reperfusion.” In addition to these primary outcomes, several secondary outcomes were analyzed including utilization of an intra‐aortic balloon pump (IABP) (ICD‐9 CM code: 37.61), percutaneous assist devices (ICD‐9 CM code: 37.68), and Swan Ganz catheterization (ICD‐9 CM codes: 89.64, 37.21, 37.23).
Besides these outcomes, we also analyzed the differences in cost of hospitalization stratified by residential zip code quartile. The NIS database provides the total charges associated with each hospital stay that were claimed by the respective hospital. The total charges of each hospital stay were converted to cost estimates using the group average all‐payer in‐hospital cost and charge information from the detailed reports by hospitals to the Centers of Medicare and Medicaid Services. All costs and charges were converted to projected estimates for the year 2011, after accounting for annual inflation rates based on consumer price index data available from the Bureau of Labor Statistics.19
Sensitivity and Subgroup Analyses
We conducted a sensitivity analysis by comparing the primary outcomes between the study groups after removing all patients who presented as a “transfer” from another healthcare facility. In addition, we compared the primary outcomes between several patient strata including males versus females, whites versus nonwhites, and elderly (age ≥75 years) versus non‐elderly (age <75 years) patients.
Statistical Analysis
Continuous variables are presented as mean±SD, and categorical variables are presented as proportions. For comparing the means of continuous variables between 3 or more categories, we utilized 1‐way ANOVA. In cases of significant differences detected using ANOVA, pairwise comparisons were performed utilizing Bonferroni correction for multiple comparisons. Chi‐square test was utilized for comparison of categorical variables.
Survey statistics traditionally used to analyze complex semirandom survey designs were employed to analyze these data. Since the data from NIS represent a collection of scattered hospital clusters, analysis was structured to account for a complex, multistage, probability sampling. NIS recommends the use of “strata” for constructing analysis clusters, which include geographic census region, hospital ownership, teaching status, urban/rural location, and bed size. Furthermore, the analysis is further stratified into individual hospitals, which serve as primary sampling units for the analysis. In the NIS database, each hospital admission is linked to a “discharge weight” that can be utilized to calculate projected national estimates for all hospital‐related outcomes, after accounting for the hierarchical structure of the dataset.
Multivariable hierarchical logistic regression analysis was utilized to compare outcomes between the zip‐code quartiles. For this analysis, we utilized the variable “nis_straum” as the strata, variable “hospid” as the primary sampling unit (clustering variable), and the variable “discwt” as the sampling weight. The analysis of all primary outcomes has been presented after adjusting for age, gender, race, 29 Elixhauser comorbidities, other relevant comorbidities including smoking, prior MI, dyslipidemia, family history of coronary artery disease, and hospital characteristics. The highest zip‐code quartile (quartile 4) has been used as the reference category for all comparisons. Adjusted logistic regression analysis of secondary outcomes of intra‐aortic balloon pump/percutaneous assist device use and Swan Ganz catheterization was further adjusted for presence of cardiogenic shock, cardiac arrest, and ventricular fibrillation. Furthermore, multivariable logistic regression analysis for comparing cost between the study groups was further adjusted for primary payment source and in‐hospital mortality.
All statistical analyses were performed using the statistical software Stata v 13.0 (StataCorp, College Station, TX). All statistical tests were 2‐tailed; a P<0.05 was considered significant. Due to the de‐identified nature of this publicly available administrative database, an institutional review board review was not necessary for the conduct of this study.
Results
Over a 9‐year period (2003–2011), a total of 372 984 discharges with a principal diagnosis of STEMI were analyzed. Table 1 demonstrates the baseline characteristics of the entire study population, stratified by the SES quartiles. There was a progressive reduction in the proportion of females when moving from the lowest to the highest quartile (P<0.001). Similarly, 70.6% of all STEMI patients residing in the lowest SES quartile were whites as compared to 82.8% of patients in the highest SES quartile (P<0.001). In addition, patients in the highest SES quartile were more likely to have private insurance as the primary payment source as compared to the lower quartiles (P<0.001).
Table 1.
Baseline Characteristics Stratified by Zip‐Code‐Based Socioeconomic Status Quartile
| Characteristics | SES Quartile 1 | SES Quartile 2 | SES Quartile 3 | SES Quartile 4 | P Value |
|---|---|---|---|---|---|
| N | 98 726 | 101 605 | 92 450 | 80 203 | |
| Median household income, USD | 1 to 38 999 | 39 000 to 47 999 | 48 000 to 62 999 | 63 000 or more | |
| Mean (SE) age, y | 63.5 (14.3) | 64.0 (14.4) | 63.8 (14.2) | 64.2 (14.2) | <0.001 |
| Females, % | 35 628 (36.1) | 35 307 (34.8) | 30 489 (33.0) | 24 985 (31.2) | <0.001 |
| Race, %* | <0.001 | ||||
| White | 53 511 (70.6) | 61 885 (82.6) | 56 615 (82.0) | 52 614 (82.8) | |
| Black | 10 391 (13.7) | 4547 (6.1) | 3407 (4.9) | 2460 (3.9) | |
| Others | 11 953 (15.8) | 8464 (11.3) | 9047 (13.1) | 8511 (13.4) | |
| Weekend admission | 26 678 (27.0) | 27 474 (27.0) | 24 853 (26.9) | 21 630 (27.0) | 0.9 |
| Primary expected payer, % | <0.001 | ||||
| Medicare | 47 533 (48.3) | 47 162 (46.5) | 40 215 (43.6) | 33 635 (42.0) | |
| Medicaid | 8754 (8.9) | 5898 (5.8) | 4221 (4.6) | 2491 (3.1) | |
| Private insurance | 27 697 (28.1) | 35 784 (35.3) | 37 844 (41.0) | 37 693 (47.0) | |
| Uninsured | 9848 (10.0) | 8164 (8.1) | 6300 (6.8) | 3821 (4.8) | |
| Other | 4607 (4.7) | 4372 (4.3) | 3691 (4.0) | 2494 (3.1) | |
| Hospital characteristics | |||||
| Region, % | <0.001 | ||||
| Northeast | 12 248 (12.4) | 15 053 (14.8) | 16 771 (18.1) | 22 058 (27.5) | |
| Midwest | 17 720 (18.0) | 28 607 (28.2) | 24 809 (26.8) | 15 597 (19.5) | |
| South | 56 045 (56.8) | 41 210 (40.6) | 30 487 (33.0) | 21 524 (26.8) | |
| West | 12 713 (12.9) | 16 735 (16.5) | 20 383 (22.1) | 21 024 (26.2) | |
| Bed size, % | <0.001 | ||||
| Small | 8175 (8.3) | 9605 (9.5) | 8363 (9.1) | 7154 (8.9) | |
| Medium | 21 466 (21.9) | 22 007 (21.8) | 21 020 (22.8) | 19 339 (24.2) | |
| Large | 68 382 (69.8) | 69 391 (68.7) | 62 710 (68.1) | 53 596 (66.9) | |
| Urban location | 79 981 (81.6) | 88 443 (87.6) | 88 319 (95.9) | 79 172 (98.9) | <0.001 |
| Teaching hospital | 45 959 (46.9) | 45 698 (45.2) | 44 467 (48.3) | 41 128 (51.4) | <0.001 |
| Co‐morbidities | |||||
| Diabetes | 27 251 (28.0) | 25 915 (25.8) | 22 662 (24.7) | 18 036 (22.6) | <0.001 |
| Hypertension | 56 227 (57.7) | 56 428 (56.1) | 51 231 (55.9) | 44 145 (55.4) | <0.001 |
| Smoking | 38 160 (38.7) | 39 321 (38.7) | 34 758 (37.6) | 26 535 (33.1) | <0.001 |
| Alcohol abuse | 3341 (3.4) | 2849 (2.8) | 2436 (2.7) | 1760 (2.2) | <0.001 |
| Drug abuse | 2691 (2.8) | 1750 (1.7) | 1391 (1.5) | 915 (1.2) | <0.001 |
| Obesity | 8784 (8.9) | 9276 (9.1) | 8741 (9.5) | 6836 (8.5) | <0.001 |
| Dyslipidemia | 45 479 (46.1) | 49 796 (49.0) | 47 475 (51.4) | 42 300 (52.7) | <0.001 |
| Family history of CAD | 7172 (7.3) | 7793 (7.7) | 7938 (8.6) | 7265 (9.1) | <0.001 |
| Prior myocardial infarction | 6644 (6.7) | 6872 (6.8) | 6298 (6.8) | 5293 (6.6) | 0.3 |
| Congestive heart failure | 759 (0.8) | 657 (0.7) | 569 (0.6) | 542 (0.7) | 0.04 |
| Peripheral vascular disease | 6989 (7.2) | 7212 (7.2) | 6246 (6.8) | 4962 (6.2) | <0.001 |
| Chronic pulmonary disease | 17 251 (17.7) | 16 602 (16.5) | 13 511 (14.8) | 9926 (12.5) | <0.001 |
| Chronic renal failure | 7615 (7.8) | 7049 (7.0) | 6044 (6.6) | 5265 (6.6) | <0.001 |
| Mean (SD) number of Elixhauser co‐morbidities | 1.9 (1.4) | 1.8 (1.4) | 1.7 (1.4) | 1.6 (1.3) | <0.001 |
All quartiles were based on median household income of the respective zip code. Data are expressed as number (percentage) except where specified. CAD indicates coronary artery disease; SES, socioeconomic status; USD, US dollars.
Data on race were available on 283 405 discharges only.
The differences in the distribution of traditional cardiovascular risk factors between the different SES quartiles are also illustrated in Table 1. There were small but statistically significant decreases in the prevalence of diabetes, hypertension, smoking, peripheral vascular disease, and chronic renal failure when moving up the SES quartile (P<0.001 for all comparisons). In addition, we noted that there was a significantly higher prevalence of alcohol abuse and drug abuse among residents of lower SES quartiles as compared to higher quartiles (P<0.001 for both comparisons).
Figure 1 demonstrates the incidence and adjusted odds ratio for the primary outcomes across the SES quartiles. The incidence of in‐hospital mortality was 7.8%, 7.5%, 7.0%, and 7.1% across quartiles 1 to 4, respectively (P‐trend<0.001). On adjusted analysis, there were significantly higher odds of in‐hospital mortality among the lowest SES quartile as compared to the highest quartile (odds ratio [95% CI]: 1.11 [1.06 to 1.17]). Similarly, there was a highly significant trend indicating a progressively reduced timely reperfusion among patients from lower SES quartiles, as compared to those from higher quartiles. The utilization of thrombolysis across the 4 SES quartiles was 3.4%, 3.7%, 3.7%, and 3.6%, respectively (P‐trend=0.44). Although the utilization of thrombolysis was similar across the SES quartiles, there was a significantly greater utilization of PCI in the higher SES quartiles as compared to the lower SES quartiles. The prevalence of timely PCI across the 4 SES quartiles was 47.0%, 49.6%, 53.6%, and 56.1%, respectively (P‐trend<0.001).
Figure 1.
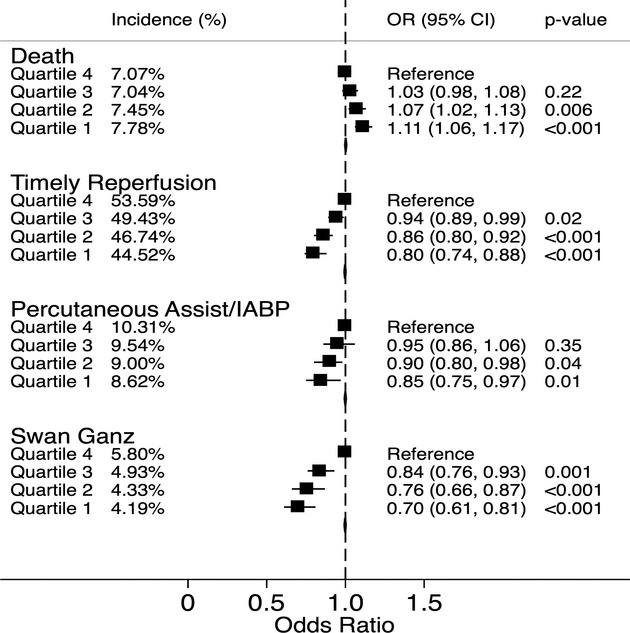
The figure demonstrates the percent incidence and adjusted odds ratio (OR) for in‐hospital mortality, timely reperfusion, use of percutaneous assist devices/intra‐aortic balloon pump (IABP), and Swan Ganz catheterization, stratified by zip‐code‐based socioeconomic quartiles. All quartiles were based on median household income of the respective zip code. All comparisons were drawn with reference to the highest quartile. Quartile 1: $1 to $37 999, quartile 2: $38 000 to $47 999, quartile 3: $48 000 to $62 999, quartile 4: $63 000 or more.
Sensitivity analysis was performed by comparing the primary outcomes between the study groups after removing all patients who presented as a “transfer” from another healthcare facility. There was no significant change in the trend of the incidence of the primary outcomes across the SES quartiles with this sensitivity analysis (Figure 2). Figure 1 also demonstrates the utilization of percutaneous assist/intra‐aortic balloon pump and Swan Ganz catheterization, stratified by SES quartiles. As seen in this figure, there was a progressively reduced utilization of both modalities among patients from lower SES quartiles as compared to higher quartiles. The incidence of cardiogenic shock accompanying STEMI in SES quartiles 1 to 4 was similar at 8.4%, 8.3%, 8.4%, and 8.8%, respectively (P‐trend: 0.08).
Figure 2.
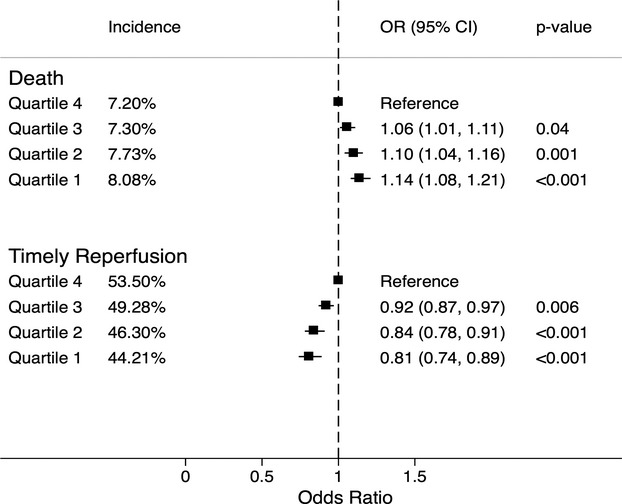
The percent incidence and adjusted odds ratio (OR) for in‐hospital death and timely reperfusion, stratified by zip‐code‐based socioeconomic quartiles after eliminating all patients who were transferred from an outside healthcare facility. All quartiles were based on median household income of the respective zip code. All comparisons were drawn with reference to the highest quartile. Quartile 1: $1 to $37 999, quartile 2: $38 000 to $47 999, quartile 3: $48 000 to $62 999, quartile 4: $63 000 or more.
The impact of timely reperfusion on in‐hospital mortality and long hospital stay was investigated by stratifying these outcomes according to the timeliness of the reperfusion therapy. Figure 3 demonstrates the incidence and adjusted odds ratio for in‐hospital mortality across the SES quartiles, stratified by timeliness of reperfusion. The incidence of in‐hospital mortality was significantly higher among patients who had delayed or no reperfusion therapy as compared to those who underwent timely reperfusion (P<0.001). However, there was no significant difference in the incidence of in‐hospital mortality across the SES quartiles among those who did not undergo timely reperfusion. On the contrary, among those who underwent timely reperfusion, the incidence of in‐hospital death was significantly higher for the lower SES quartiles as compared to the higher quartiles.
Figure 3.
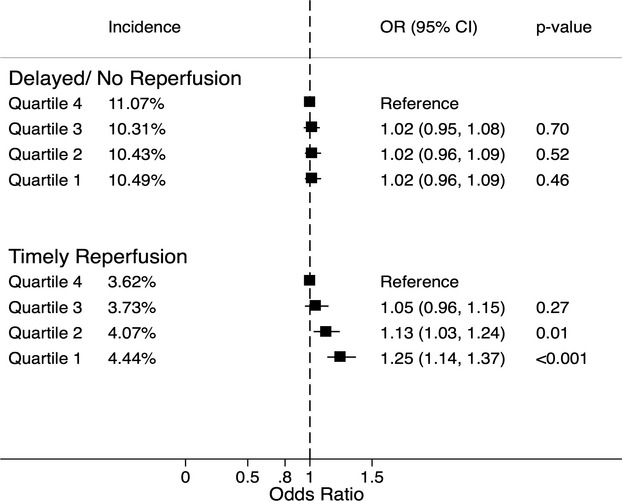
The percent incidence and adjusted odds ratio (OR) for in‐hospital death for various socioeconomic quartiles stratified by the timing of reperfusion therapy. Patients undergoing delayed/no reperfusion are shown in the top panel and those undergoing timely reperfusion are shown in the bottom panel. All comparisons were drawn with reference to the highest quartile. Quartile 1: $1 to $37 999, quartile 2: $38 000 to $47 999, quartile 3: $48 000 to $62 999, quartile 4: $63 000 or more.
The mean (SD) cost of hospitalization was $23 529 ($22 983), $23 999 ($23 625), $25 800 ($25 391), and $28 060 ($28 657) among SES quartiles 1 to 4, respectively. After adjustment for baseline demographic and clinical characteristics including primary payment source, the adjusted costs of hospitalization of patients from SES quartiles 2, 3, and 4 were significantly higher when compared to the cost of hospitalization of patients from SES quartile 1 (P≤0.001 for all comparisons). As compared to quartile 1, mean adjusted cost of hospitalization for patients from quartile 4 was higher by $4070 (95% CI: $2877 to $5263). Similarly, the mean adjusted cost of hospitalization for patients from quartiles 2 and 3 were higher by $913 (95% CI: $380 to $1447) and $2140 (95% CI: $1391 to $2888) as compared to the costs of hospitalization of patients from SES quartile 1.
Subgroup analyses demonstrating the differential impact of gender, race, and age on in‐hospital death and timely reperfusion have been demonstrated in Tables 2 and 3, respectively. The in‐hospital mortality rates were noted to be significantly higher among females as compared to males for all SES quartiles (P<0.001 for all comparisons). In addition, the in‐hospital mortality among females as well as males from the lowest SES was significantly higher than their counterparts in the higher SES quartiles. Furthermore, males and females from the lower SES quartiles were significantly less likely to undergo timely reperfusion as compared to their counterparts from the higher SES quartiles.
Table 2.
Percent Incidence and Odds Ratio for In‐Hospital Death According to Zip‐Code‐Based Socioeconomic Quartiles Stratified by Gender, Race, or Age
| Zip Code Quartile | N | Percent Incidence | Odds Ratio (95% CI) | P Value |
|---|---|---|---|---|
| Males | ||||
| Quartile 4 | 55 157 | 5.29 | Reference | |
| Quartile 3 | 61 897 | 5.41 | 1.02 (0.96 to 1.08) | 0.52 |
| Quartile 2 | 66 223 | 5.95 | 1.12 (1.06 to 1.19) | <0.001 |
| Quartile 1 | 63 023 | 6.18 | 1.19 (1.12 to 1.27) | <0.001 |
| Females | ||||
| Quartile 4 | 24 970 | 11.04 | Reference | |
| Quartile 3 | 30 453 | 10.39 | 1.03 (0.96 to 1.09) | 0.42 |
| Quartile 2 | 35 277 | 10.28 | 1.02 (0.95 to 1.08) | 0.62 |
| Quartile 1 | 35 587 | 10.65 | 1.09 (1.03 to 1.16) | 0.005 |
| Whites | ||||
| Quartile 4 | 52 582 | 7.26 | Reference | |
| Quartile 3 | 56 564 | 7.23 | 1.04 (0.99 to 1.09) | 0.17 |
| Quartile 2 | 61 831 | 7.52 | 1.06 (1.02 to 1.12) | 0.01 |
| Quartile 1 | 53 453 | 7.87 | 1.14 (1.09 to 1.20) | <0.001 |
| Non‐whites | ||||
| Quartile 4 | 10 965 | 6.90 | Reference | |
| Quartile 3 | 12 450 | 6.82 | 0.99 (0.88 to 1.12) | 0.91 |
| Quartile 2 | 13 002 | 7.63 | 1.13 (1.01 to 1.26) | 0.03 |
| Quartile 1 | 22 316 | 8.13 | 1.17 (1.05 to 1.31) | 0.004 |
| Age ≥75 y | ||||
| Quartile 4 | 21 170 | 16.38 | Reference | |
| Quartile 3 | 23 663 | 15.40 | 0.95 (0.89 to 1.01) | 0.08 |
| Quartile 2 | 26 566 | 16.05 | 0.98 (0.92 to 1.04) | 0.44 |
| Quartile 1 | 24 455 | 16.25 | 0.98 (0.92 to 1.04) | 0.44 |
| Age <75 y | ||||
| Quartile 4 | 58 972 | 3.74 | Reference | |
| Quartile 3 | 68 701 | 4.17 | 1.11 (1.03 to 1.19) | 0.005 |
| Quartile 2 | 74 947 | 4.41 | 1.19 (1.11 to 1.27) | <0.001 |
| Quartile 1 | 74 169 | 5.01 | 1.34 (1.25 to 1.44) | <0.001 |
All quartiles were based on the median household income of the respective zip code. All comparisons were drawn with reference to the highest quartile. Quartile 1: $1 to $38 999; quartile 2: $39 000 to $47 999; quartile 3: $48 000 to 63 000; quartile 4: $63 000 or more.
Table 3.
Percent Incidence and Odds Ratio for Timely Reperfusion Therapy According to Zip‐Code‐Based Socioeconomic Quartiles Stratified by Gender, Race, or Age
| Zip Code Quartile | N | Percent Incidence | Odds Ratio (95% CI) | P Value |
|---|---|---|---|---|
| Males | ||||
| Quartile 4 | 55 185 | 57.98 | Reference | |
| Quartile 3 | 61 944 | 53.22 | 0.90 (0.85 to 0.95) | <0.001 |
| Quartile 2 | 66 273 | 50.54 | 0.78 (0.73 to 0.84) | <0.001 |
| Quartile 1 | 63 072 | 48.43 | 0.71 (0.65 to 0.77) | <0.001 |
| Females | ||||
| Quartile 4 | 24 985 | 43.99 | Reference | |
| Quartile 3 | 30 489 | 42.00 | 0.94 (0.88 to 1.01) | 0.06 |
| Quartile 2 | 35 307 | 39.92 | 0.83 (0.77 to 0.90) | <0.001 |
| Quartile 1 | 35 628 | 37.57 | 0.75 (0.69 to 0.81) | <0.001 |
| Whites | ||||
| Quartile 4 | 52 614 | 57.62 | Reference | |
| Quartile 3 | 56 615 | 55.92 | 0.91 (0.86 to 0.96) | 0.001 |
| Quartile 2 | 61 885 | 52.73 | 0.80 (0.75 to 0.86) | <0.001 |
| Quartile 1 | 53 511 | 50.37 | 0.71 (0.66 to 0.78) | <0.001 |
| Nonwhites | ||||
| Quartile 4 | 10 971 | 57.57 | Reference | |
| Quartile 3 | 12 454 | 55.09 | 0.90 (0.82 to 0.98) | 0.02 |
| Quartile 2 | 13 011 | 51.15 | 0.77 (0.69 to 0.85) | <0.001 |
| Quartile 1 | 22 344 | 48.58 | 0.71 (0.64 to 0.80) | <0.001 |
| Age ≥75 y | ||||
| Quartile 4 | 21 189 | 36.15 | Reference | |
| Quartile 3 | 23 705 | 33.31 | 0.95 (0.89 to 1.02) | 0.18 |
| Quartile 2 | 26 601 | 30.44 | 0.82 (0.75 to 0.89) | <0.001 |
| Quartile 1 | 24 498 | 28.63 | 0.77 (0.70 to 0.84) | <0.001 |
| Age <75 y | ||||
| Quartile 4 | 58 996 | 58.89 | Reference | |
| Quartile 3 | 68 742 | 55.11 | 0.90 (0.86 to 0.95) | <0.001 |
| Quartile 2 | 74 992 | 52.67 | 0.80 (0.74 to 0.85) | <0.001 |
| Quartile 1 | 74 216 | 49.75 | 0.71 (0.66 to 0.78) | <0.001 |
All quartiles were based on the median household income of the respective zip code. All comparisons were drawn with reference to the highest quartile. Quartile 1: $1 to $38 999; quartile 2: $39 000 to $47 999; quartile 3: $48 000 to 63 000; quartile 4: $63 000 or more.
On stratification of the study population into whites and nonwhites, we did not observe any significant differences in the incidence of in‐hospital mortality and timely reperfusion between these 2 racial groups. In both racial strata, we observed a statistically significant trend of an increase in in‐hospital mortality and a reduction in timely reperfusion among patients belonging to lower SES quartiles as compared to higher SES quartiles. Furthermore, the incidence of in‐hospital mortality and delayed/no reperfusion therapy was significantly higher among elderly patients (≥75 years) as compared to their younger counterparts (P<0.001 for all comparisons). Although in‐hospital mortality among the elderly did not seem to be affected by the SES quartile, elderly from the 2 lowest SES quartiles were less likely to undergo a timely reperfusion (Table 3). In the younger cohort, there was a significantly higher incidence of in‐hospital mortality and a reduced incidence of timely reperfusion among patients from lower SES as compared to those from higher SES quartiles. There were several differences in the baseline characteristics between the elderly patients and their younger counterparts, which could potentially explain these differences (Table 4).
Table 4.
Comparison of Baseline Characteristics of Young (<75 y) and Old (≥75 y) Patients from the Lowest Socioeconomic Status
| Characteristics | SES Quartile 1 <75 Y | SES Quartile 2 ≥75 Y | P Value |
|---|---|---|---|
| N | 74 216 | 24 498 | |
| Females, % | 21 896 (29.5) | 13 731 (56.1) | <0.001 |
| Race, % | <0.001 | ||
| White | 39 008 (68.5) | 14 501 (76.8) | |
| Black | 8467 (14.9) | 1924 (10.2) | |
| Others | 9506 (16.7) | 2446 (13.0) | |
| Weekend admission | 20 315 (27.4) | 6360 (26.0) | <0.001 |
| Primary expected payer, % | <0.001 | ||
| Medicare | 24 922 (33.7) | 22 629 (92.5) | |
| Medicaid | 8489 (11.5) | 263 (1.1) | |
| Private insurance | 26 499 (35.8) | 1193 (4.9) | |
| Uninsured | 9705 (13.1) | 141 (0.6) | |
| Other | 4363 (5.9) | 243 (1.0) | |
| Co‐morbidities | |||
| Diabetes | 20 639 (28.1) | 6610 (27.4) | 0.04 |
| Hypertension | 41 474 (56.6) | 14 749 (61.2) | <0.001 |
| Smoking | 34 985 (47.1) | 3172 (13.0) | <0.001 |
| Alcohol abuse | 3176 (4.3) | 164 (0.7) | <0.001 |
| Drug abuse | 2673 (3.6) | 18 (0.1) | <0.001 |
| Obesity | 8034 (10.8) | 750 (3.1) | <0.001 |
| Dyslipidemia | 36 997 (49.9) | 8480 (34.6) | <0.001 |
| Family history of CAD | 6629 (8.9) | 543 (2.2) | <0.001 |
| Prior myocardial infarction | 5086 (6.8) | 1557 (6.4) | 0.009 |
| Congestive heart failure | 430 (0.6) | 329 (1.4) | <0.001 |
| Peripheral vascular disease | 4592 (6.3) | 2397 (10.0) | <0.001 |
| Chronic pulmonary disease | 12 449 (17.0) | 4800 (19.9) | <0.001 |
| Chronic renal failure | 4261 (5.8) | 3354 (13.9) | <0.001 |
| Mean (SD) number of Elixhauser co‐morbidities | 1.8 (1.4) | 2.2 (1.4) | <0.001 |
Data are expressed as number (percentage) except where specified. CAD indicates coronary artery disease; SES, socioeconomic status.
Discussion
We have evaluated the impact of residential zip‐code‐based classification of SES upon adverse events following STEMI utilizing a large representative nationwide sample in the United States. We observed a progressive increase in the absolute and adjusted in‐hospital mortality after STEMI with a progressive decline in the median household income of a patient's residential zip code. Besides this, there was a highly significant trend indicating a progressively reduced timely reperfusion among patients from lower SES quartiles, as compared to those from higher quartiles. We did not observe any significant difference in the in‐hospital mortality among patients who did not undergo timely reperfusion therapy. However, the mortality among these patients was significantly higher than those who underwent timely reperfusion in all SES strata.
Despite a higher occurrence of in‐hospital mortality among patients from a lower SES quartile, there was a progressively reduced utilization of mechanical circulatory support among patients from lower SES quartiles as compared to higher quartiles. In addition, the cost of hospitalization of patients from the lower SES quartiles was less as compared to those from higher SES quartiles. Whether this represents an underutilization of resources for patients from lower SES zip codes or this represents an overutilization of resources for patients from higher SES zip codes is not completely clear from this analysis. However, our analysis has demonstrated a significant disparity in both in‐hospital outcomes as well as resource utilization for STEMI patients, depending on residential zip code.
The differences in SES have been consistently associated with variations in cardiovascular‐related morbidity and mortality.20–21 Individuals residing in neighborhoods with a lower SES have a higher prevalence of cardiovascular risk factors such as hypertension, diabetes, obesity, and smoking accounting for the observed association between the contextual factors and outcomes following STEMI. Similar trends were noted in our analysis. However, these statistically significant yet clinically underwhelming differences in cardiovascular risk factors are unlikely to be a sole explanation for differences in clinical outcomes. In addition, the differences in clinical outcomes between the SES quartiles persist despite adjustment for baseline cardiovascular risk factors, suggesting that other factors in healthcare access and delivery likely play a role. Lower SES has been demonstrated to limit access to medical care and to bias these patients to present to smaller, low‐volume hospitals without invasive cardiac procedures and with lower utilization of evidence‐based therapies.22–25 The differences in outcome in our analysis, however, persisted despite adjustment for hospital characteristics. It is possible that an unmeasured prehospital variable clustered by SES may account for the mortality differences noted. These include timely activation and performance characteristics of the local emergency medical services systems, inappropriate triage, and transport to nonreperfusion hospitals. Other novel variables including functional capacity and autonomic functions such as heart rate recovery have been previously shown to differentially impact outcomes according to SES.26
There is a large body of literature that has evaluated the existence and impact of racial disparities on outcomes following acute MI.23,27–31 Although we found a significant higher proportion of nonwhites in the lower socioeconomic strata, “socioeconomic disparity” and “racial disparity” are hardly interchangeable terms. It has been demonstrated that if all patients with STEMI were treated with an identical protocol for primary PCI, there would be no racial disparity in clinical outcomes.32 Hence, although it is convenient to label patients by race, factors that relate to SES such as income, education, housing, and social awareness are probably more important in health‐related outcomes. Socioeconomic position has been speculated to be a greater impediment to optimal cardiovascular health rather than “biologically implausible surrogates of race and sex.”33
Despite a breadth of evidence spanning the relationship of racial disparities with adverse cardiovascular outcomes, relatively fewer studies have exclusively evaluated the role of SES on cardiovascular outcomes following STEMI.11,13–14 Using administrative data from Canada, Alter et al demonstrated that a progressive improvement in the SES, measured using neighborhood median income level, predicted a greater use of coronary angiography, shorter waiting times for heart catheterization, and lower short‐term mortality following acute MI.11 These findings from this seminal study published 15 years ago are likely not easily extrapolated to the current US population, where there may be greater disparities in the distribution and the utilization of healthcare resources along with a greater degree of economic segregation as compared to Canada.12,15 Furthermore, these studies belong to an era when primary PCI was not the mainstay of treatment of STEMI and the emphasis on door‐to‐balloon time optimization was just beginning.
Over the last decade, we have made remarkable progress in the delivery of optimal reperfusion for patients with STEMI. There is ample evidence to demonstrate a major reduction in door‐to‐needle times and door‐to‐balloon times over the past few years.34–35 However, the time between the symptom onset and the first medical contact among STEMI patients has hardly changed.34,36 This delay could be expected to result in adverse outcomes in our patients. We believe that socioeconomic parameters have a small impact on the door‐to‐balloon times after a patient presents to a healthcare facility. However, a greater degree of impact of SES probably occurs on the duration between symptom onset and first medical contact. Several socioeconomic and sociocultural factors including education, access to healthcare resources, income, and awareness might play important roles in determining the overall total ischemic time following STEMI, thereby directly impacting the outcome. The impact of surrounding environment becomes highly significant in this context. Further, one could argue that the impact of environment, substituted by an aggregate zip code income, might provide a greater degree of insight into society–health dynamics and interactions than individual household income.
In addition to detailed perspective on relationship of SES with adverse outcomes after STEMI, our study also provides some additional data that might form the basis of future studies. We observed a significant interaction of gender with outcome across the various socioeconomic strata. This is in keeping with earlier findings from multiple studies.37–38 Whether these gender‐based outcome differences reflect true biological differences or are more indicative of differing socioeconomic profiles that render female gender a surrogate for poor outcome is a matter of speculation at this time. Similarly, elderly patients with STEMI have been traditionally believed to possess a guarded prognosis due to multiple comorbidities, more delay in seeking care, atypical presentations, and a higher degree of hemodynamic compromise compared to younger patients. We observed that the SES mortality association was stronger for the younger population than the elderly. This is in conjunction with earlier findings where the association between SES and cardiovascular mortality appeared to be less marked among older patients.26,39 Although the mechanisms underlying these associations are not completely clear, potential hypotheses include improved coping skills among elderly, perhaps attributable to having lived longer under adverse socioeconomic circumstances along with an increased access to healthcare resources due to public insurance programs available to older individuals.
Limitations
Our study has a few limitations. First, NIS is an administrative database, which may be subject to errors in coding of diseases or procedures. However, in administrative databases, the diagnosis of acute MI using ICD‐9 CM coding has been demonstrated to possess a specificity of 99.5%, sensitivity of 72.4%, negative predictive value of 96.1%, and a positive predictive value of 95.9%.40 Second, this is a retrospective observational study, which may be subject to traditional biases of observational studies such as selection bias. However, these limitations might be partially compensated for, due to a large size of NIS database and a uniform representation of all regions of the United States. Third, the definition of timely reperfusion included all patients who underwent reperfusion on “day 0” of admission to the hospital, due to lack of availability of hourly data. This definition might lend itself to slight overinclusion of patients who may not have undergone timely reperfusion by strict STEMI standards. A further limitation might result from the fact that we utilized median household income of the entire zip code to “impute” the SES of each patient. The capability of an individual measure like the median household income of the residential zip code, rather than a composite measure, to directly relate to the SES of each patient may be somewhat limited. However, the inaccuracy resulting from the misclassification of personal SES based on SES of the surrounding neighborhood (so called “ecologic fallacy”) may be completely offset by the lack of occurrence of an “individualistic fallacy,” whereby there is an incorrect assumption that the health of an individual subject is not affected by the neighborhood that they reside in.11 In addition, in‐hospital mortality may be affected by numerous variables including availability of PCI facilities with relevant expertise, provider volume, hospital infrastructure, and surgical back‐up, which are not always available consistently in the NIS database.
Conclusions
There was a higher incidence of in‐hospital death among patients residing in low SES zip codes, as compared to those who live in high SES zip codes. Besides this, there was a reduced prevalence of timely reperfusion among patients from low SES zip codes. The use of mechanical circulatory support devices was paradoxically lower among those who belonged to the low SES zip codes as compared to the higher SES zip codes, despite a higher mortality in the low SES quartiles. Furthermore, the absolute as well as adjusted cost of hospitalization was significantly higher for those who belonged to a high SES zip code as compared to those who belonged to low SES zip code. These data suggest that there are widespread differences in timely access and provision of optimal STEMI care based on socioeconomic differences, which may be responsible for adverse health outcomes in those that reside in low SES areas.
Disclosures
None.
References
- 1.Bonow RO, Grant AO, Jacobs AK. The cardiovascular state of the union: confronting healthcare disparities. Circulation. 2005; 111:1205-1207. [DOI] [PubMed] [Google Scholar]
- 2.Mensah GA, Mokdad AH, Ford ES, Greenlund KJ, Croft JB. State of disparities in cardiovascular health in the United States. Circulation. 2005; 111:1233-1241. [DOI] [PubMed] [Google Scholar]
- 3.Winkleby MA, Kraemer HC, Ahn DK, Varady AN. Ethnic and socioeconomic differences in cardiovascular disease risk factors: findings for women from the Third National Health and Nutrition Examination Survey, 1988–1994. JAMA. 1998; 280:356-362. [DOI] [PubMed] [Google Scholar]
- 4.Smedley BD, Stith AY, Nelson AR. Unequal Treatment: Confronting Racial and Ethnic Disparities in Health Care. 2002Washington, DC: National Academy Press; [PubMed] [Google Scholar]
- 5.Geronimus AT, Bound J, Niedert L. On the Validity of Using Census Geocode Characteristics to Proxy Economic Status. 1993Ann Arbor, MI: Population Studies Center, University of Michigan [Google Scholar]
- 6.Geronimus AT, Bound J, Niedert L. On the validity of using census geocode characteristics to proxy individual socioeconomic characteristics, Technical working paper 189. Cambridge, MA: National Bureau of Economic Research; 1995. [Google Scholar]
- 7.Mcbean AM, Hebert P. Comparison of income information in the 1990 census with information in the Medicare current beneficiary survey. Baltimore, MD: Health Care Financing Administration; 1995. (HCFA contract no. HCFAx201095x20100265). [Google Scholar]
- 8.Carr‐Hill R, Rice N. Is enumeration district level an improvement on ward level analysis in studies of deprivation and health? J Epidemiol Community Health. 1995; 49suppl 2:S28-S29. [DOI] [PMC free article] [PubMed] [Google Scholar]
- 9.Krieger N. Overcoming the absence of socioeconomic data in medical records: validation and application of a census‐based methodology. Am J Public Health. 1992; 82:703-710. [DOI] [PMC free article] [PubMed] [Google Scholar]
- 10.Smith GD, Hart C, Watt G, Hole D, Hawthorne V. Individual social class, area‐based deprivation, cardiovascular disease risk factors, and mortality: the Renfrew and Paisley Study. J Epidemiol Community Health. 1998; 52:399-405. [DOI] [PMC free article] [PubMed] [Google Scholar]
- 11.Alter DA, Naylor CD, Austin P, Tu JV. Effects of socioeconomic status on access to invasive cardiac procedures and on mortality after acute myocardial infarction. N Engl J Med. 1999; 341:1359-1367. [DOI] [PubMed] [Google Scholar]
- 12.Marmot M. The influence of income on health: views of an epidemiologist. Health Aff. 2002; 21:31-46. [DOI] [PubMed] [Google Scholar]
- 13.Rao SV, Kaul P, Newby LK, Lincoff AM, Hochman J, Harrington RA, Mark DB, Peterson ED. Poverty, process of care, and outcome in acute coronary syndromes. J Am Coll Cardiol. 2003; 41:1948-1954. [DOI] [PubMed] [Google Scholar]
- 14.Rathore SS, Berger AK, Weinfurt KP, Feinleib M, Oetgen WJ, Gersh BJ, Schulman KA. Race, sex, poverty, and the medical treatment of acute myocardial infarction in the elderly. Circulation. 2000; 102:642-648. [DOI] [PubMed] [Google Scholar]
- 15.Ross NA, Wolfson MC, Dunn JR, Berthelot JM, Kaplan GA, Lynch JW. Relation between income inequality and mortality in Canada and in the United States: cross sectional assessment using census data and vital statistics. BMJ. 2000; 320:898-902. [DOI] [PMC free article] [PubMed] [Google Scholar]
- 16.Elixhauser A, Steiner C, Palmer L. Clinical Classification Software (CCS), US Agency for Healthcare Research and Quality; 2014. Available at http://www.hcup-us.ahrq.gov/toolssoftware/ccs.ccs.jsp. Accessed January 12, 2014. [Google Scholar]
- 17.Healthcare Cost and Utilization Project (HCUP). HCUP Comorbidity Software: 1‐14‐2013. Rockville, MD: Agency for Healthcare Research and Quality; 2013. [PubMed] [Google Scholar]
- 18.Elixhauser A, Steiner C, Harris DR, Coffey RM. Comorbidity measures for use with administrative data. Med Care. 1998; 36:8-27. [DOI] [PubMed] [Google Scholar]
- 19. Consumer Price Index – Guide to CPI data. United States Department of Labor. Bureau of Labor Statistics; 2009. Available at http://www.bls.gov/cpi/cpifact8.htm (Accessed May 10, 2014). [Google Scholar]
- 20.Capewell S, MacIntyre K, Stewart S, Chalmers JW, Boyd J, Finlayson A, Redpath A, Pell JP, McMurray JJ. Age, sex, and social trends in out‐of‐hospital cardiac deaths in Scotland 1986–95: a retrospective cohort study. Lancet. 2001; 358:1213-1217. [DOI] [PubMed] [Google Scholar]
- 21.Wolfson M, Kaplan G, Lynch J, Ross N, Backlund E. Relation between income inequality and mortality: empirical demonstration. BMJ. 1999; 319:953-955. [DOI] [PMC free article] [PubMed] [Google Scholar]
- 22.Barnato AE, Lucas FL, Staiger D, Wennberg DE, Chandra A. Hospital‐level racial disparities in acute myocardial infarction treatment and outcomes. Med Care. 2005; 43:308-319. [DOI] [PMC free article] [PubMed] [Google Scholar]
- 23.Bradley EH, Herrin J, Wang Y, McNamara RL, Webster TR, Magid DJ, Blaney M, Peterson ED, Canto JG, Pollack CV, Jr, Krumholz HM. Racial and ethnic differences in time to acute reperfusion therapy for patients hospitalized with myocardial infarction. JAMA. 2004; 292:1563-1572. [DOI] [PubMed] [Google Scholar]
- 24.Skinner J, Chandra A, Staiger D, Lee J, McClellan M. Mortality after acute myocardial infarction in hospitals that disproportionately treat black patients. Circulation. 2005; 112:2634-2641. [DOI] [PMC free article] [PubMed] [Google Scholar]
- 25.Trivedi AN, Sequist TD, Ayanian JZ. Impact of hospital volume on racial disparities in cardiovascular procedure mortality. J Am Coll Cardiol. 2006; 47:417-424. [DOI] [PubMed] [Google Scholar]
- 26.Shishehbor MH, Litaker D, Pothier CE, Lauer MS. Association of socioeconomic status with functional capacity, heart rate recovery, and all‐cause mortality. JAMA. 2006; 295:784-792. [DOI] [PubMed] [Google Scholar]
- 27.Cohen MG, Fonarow GC, Peterson ED, Moscucci M, Dai D, Hernandez AF, Bonow RO, Smith SC., Jr Racial and ethnic differences in the treatment of acute myocardial infarction: findings from the Get With the Guidelines‐Coronary Artery Disease program. Circulation. 2010; 121:2294-2301. [DOI] [PubMed] [Google Scholar]
- 28.Goff DC, Jr, Nichaman MZ, Ramsey DJ, Meyer PS, Labarthe DR. A population‐based assessment of the use and effectiveness of thrombolytic therapy. The Corpus Christi Heart Project. Ann Epidemiol. 1995; 5:171-178. [DOI] [PubMed] [Google Scholar]
- 29.Mehta RH, Marks D, Califf RM, Sohn S, Pieper KS, Van de Werf F, Peterson ED, Ohman EM, White HD, Topol EJ, Granger CB. Differences in the clinical features and outcomes in African Americans and whites with myocardial infarction. Am J Med. 2006; 119:e1-e8. [DOI] [PubMed] [Google Scholar]
- 30.Meshack AF, Goff DC, Chan W, Ramsey D, Linares A, Reyna R, Pandey D. Comparison of reported symptoms of acute myocardial infarction in Mexican Americans versus non‐Hispanic whites (the Corpus Christi Heart Project). Am J Cardiol. 1998; 82:1329-1332. [DOI] [PubMed] [Google Scholar]
- 31.Syed M, Khaja F, Rybicki BA, Wulbrecht N, Alam M, Sabbah HN, Goldstein S, Borzak S. Effect of delay on racial differences in thrombolysis for acute myocardial infarction. Am Heart J. 2000; 140:643-650. [DOI] [PubMed] [Google Scholar]
- 32.Jacobi JA, Parikh SV, McGuire DK, Delemos JA, Murphy SA, Keeley EC. Racial disparity in clinical outcomes following primary percutaneous coronary intervention for ST elevation myocardial infarction: influence of process of care. J Interv Cardiol. 2007; 20:182-187. [DOI] [PubMed] [Google Scholar]
- 33.Koch CG, Li L, Kaplan GA, Wachterman J, Shishehbor MH, Sabik J, Blackstone EH. Socioeconomic position, not race, is linked to death after cardiac surgery. Circ Cardiovasc Qual Outcomes. 2010; 3:267-276. [DOI] [PubMed] [Google Scholar]
- 34.Fournier S, Muller O, Ludman AJ, Lauriers N, Eeckhout E. Influence of socioeconomic factors on delays, management and outcome amongst patients with acute myocardial infarction undergoing primary percutaneous coronary intervention. Swiss Med Wkly. 2013; 143:w13817. [DOI] [PubMed] [Google Scholar]
- 35.Schiele F, Hochadel M, Tubaro M, Meneveau N, Wojakowski W, Gierlotka M, Polonski L, Bassand JP, Fox KA, Gitt AK. Reperfusion strategy in Europe: temporal trends in performance measures for reperfusion therapy in ST‐elevation myocardial infarction. Eur Heart J. 2010; 31:2614-2624. [DOI] [PubMed] [Google Scholar]
- 36.Naegeli B, Radovanovic D, Rickli H, Erne P, Seifert B, Duvoisin N, Pedrazzini G, Urban P, Bertel O. Impact of a nationwide public campaign on delays and outcome in Swiss patients with acute coronary syndrome. Eur J Cardiovasc Prev Rehabil. 2011; 18:297-304. [DOI] [PubMed] [Google Scholar]
- 37.Benamer H, Tafflet M, Bataille S, Escolano S, Livarek B, Fourchard V, Caussin C, Teiger E, Garot P, Lambert Y, Jouven XSpaulding C Investigators C‐AR. Female gender is an independent predictor of in‐hospital mortality after STEMI in the era of primary PCI: insights from the greater Paris area PCI Registry. EuroIntervention. 2011; 6:1073-1079. [DOI] [PubMed] [Google Scholar]
- 38.Khera S, Kolte D, Palaniswamy C, Mujib M, Aronow WS, Singh T, Gotsis W, Silverman G, Frishman WH. ST‐elevation myocardial infarction in the elderly: temporal trends in incidence, utilization of percutaneous coronary intervention and outcomes in the United States. Int J Cardiol. 2013; 168:3683-3690. [DOI] [PubMed] [Google Scholar]
- 39.Avendano M, Kunst AE, Huisman M, Lenthe FV, Bopp M, Regidor E, Glickman M, Costa G, Spadea T, Deboosere P, Borrell C, Valkonen T, Gisser R, Borgan JK, Gadeyne S, Mackenbach JP. Socioeconomic status and ischaemic heart disease mortality in 10 Western European populations during the 1990s. Heart. 2006; 92:461-467. [DOI] [PMC free article] [PubMed] [Google Scholar]
- 40.Quan H, Li B, Saunders LD, Parsons GA, Nilsson CI, Alibhai A, Ghali WAInvestigators I. Assessing validity of ICD‐9‐CM and ICD‐10 administrative data in recording clinical conditions in a unique dually coded database. Health Serv Res. 2008; 43:1424-1441. [DOI] [PMC free article] [PubMed] [Google Scholar]