

Abstract
Background
Brain lipoprotein metabolism is dependent on lipoprotein particles that resemble plasma high‐density lipoproteins but that contain apolipoprotein (apo) E rather than apoA‐I as their primary protein component. Astrocytes and microglia secrete apoE but not apoA‐I; however, apoA‐I is detectable in both cerebrospinal fluid and brain tissue lysates. The route by which plasma apoA‐I enters the central nervous system is unknown.
Methods and Results
Steady‐state levels of murine apoA‐I in cerebrospinal fluid and interstitial fluid are 0.664 and 0.120 μg/mL, respectively, whereas brain tissue apoA‐I is ≈10% to 15% of its levels in liver. Recombinant, fluorescently tagged human apoA‐I injected intravenously into mice localizes to the choroid plexus within 30 minutes and accumulates in a saturable, dose‐dependent manner in the brain. Recombinant, fluorescently tagged human apoA‐I accumulates in the brain for 2 hours, after which it is eliminated with a half‐life of 10.3 hours. In vitro, human apoA‐I is specifically bound, internalized, and transported across confluent monolayers of primary human choroid plexus epithelial cells and brain microvascular endothelial cells.
Conclusions
Following intravenous injection, recombinant human apoA‐I rapidly localizes predominantly to the choroid plexus. Because apoA‐I mRNA is undetectable in murine brain, our results suggest that plasma apoA‐I, which is secreted from the liver and intestine, gains access to the central nervous system primarily by crossing the blood–cerebrospinal fluid barrier via specific cellular mediated transport, although transport across the blood–brain barrier may also contribute to a lesser extent.
Keywords: ApoA‐I, central nervous system, cerebrovascular endothelium, choroid plexus, transport
Introduction
Plasma high‐density lipoprotein (HDL) is an extremely heterogeneous class of lipoproteins that comprises >200 individual lipid species and >80 different proteins in normolipidemic plasma.1–2 HDL is best known for its pivotal role in reverse cholesterol transport, in which cholesterol is removed from peripheral tissues and transported back to the liver for excretion into the bile. HDL and its principal protein component, apolipoprotein (apo) A‐I, also possess several potent vasoprotective properties, including stimulating endothelial repair, inhibiting inflammation, suppressing endothelial cell apoptosis and platelet aggregation, and preventing lipid oxidation.3
Despite composing only 2.5% of body mass, the highly vascularized brain consumes 20% of the body's cardiac output, 20% of oxygen consumption, and 25% of glucose consumption.4 Cerebrovascular dysfunction is increasingly recognized as contributing to the pathogenesis of several neurological disorders, including Alzheimer disease (AD). Most AD patients have biochemical, morphological, and functional changes to the cerebrovasculature, including accumulation of amyloid in cerebral blood vessels, which is known as cerebral amyloid angiopathy, in addition to the parenchymal amyloid plaques and neurofibrillary tangles that define AD.4–5 Furthermore, several comorbidities that increase AD risk, including hypertension, stroke, hypercholesterolemia, cardiovascular disease, and type 2 diabetes mellitus, all converge on vascular dysfunction.6–7 Intriguingly, HDL function is also impaired in many of these comorbidities.8–9
ApoA‐I has previously been implicated in cerebrovascular and central nervous system (CNS) function5; deleting apoA‐I from the APP/PS1 mouse model of AD exacerbates cognitive deficits and selectively increases cerebral amyloid angiopathy.10 In contrast, transgenic mice that overexpress human apoA‐I 2‐fold from its endogenous promoter exhibit improved cognitive performance, decreased cerebral amyloid angiopathy, and reduced CNS inflammation.11 In vitro, apoA‐I can bind β‐amyloid (Aβ) and reduce Aβ‐induced cytotoxicity.10,12 In ABCA1−/− mice, CNS apoE levels are reduced by ≈80%,13 whereas apoA‐I levels are reduced up to 50% in brain tissue despite an 85% decrease in plasma apoA‐I.14 Intriguingly, apoA‐I levels are dramatically increased in both brain and cerebrospinal fluid (CSF) in brain‐specific ABCA1−/− mice, whereas CNS apoE levels are reduced.15 In contrast, brain‐selective overexpression of ABCA1 in PDAPP mice does not alter CNS apoE or apoA‐I levels.16 Finally, treatment of APP/PS1 mice with GW3965, a liver X receptor agonist that stimulates systemic ABCA1 expression, increases apoA‐I levels by 250% in brain tissue and 300% in CSF without significantly altering plasma or liver apoA‐I levels.14 Together, these observations suggest that the CNS may have mechanisms to alter apoA‐I levels in response to fluctuating plasma concentrations.
This study was performed specifically to characterize the route by which circulating apoA‐I gains access to the CNS, filling a substantial gap in our understanding of apoA‐I metabolism in the brain. Although in vitro cultures of porcine brain capillary endothelial cells have been reported to express and secrete apoA‐I,17 it is not clear whether this occurs in other species. In this study, we used lipid‐free human apoA‐I (hapoA‐I), both recombinant and serum derived, to investigate the transport of peripheral apoA‐I into the CNS. Following intravenous injection in C57Bl/6 mice, the vast majority of hapoA‐I in the CNS is present within the choroid plexus and is undetectable in the brain microvasculature. In vitro, however, hapoA‐I can be specifically bound, internalized, and transported across confluent monolayers of primary human choroid plexus epithelial cells as well as primary human brain microvascular endothelial cells. Our results suggest that, in vivo, the preferred route of entry of hapoA‐I into the brain is likely across the blood–CSF barrier (BCSFB), although we cannot rule out some contribution of hapoA‐I transport across the blood–brain barrier (BBB).
Materials and Methods
Animals
Three‐ to five‐month‐old female C57Bl/6 and apoA‐I−/− mice (Jackson Laboratory, Bar Harbor, ME, USA) were maintained on a chow diet (PMI LabDiet 5010; LabDiet). All animal procedures were approved by the Canadian Council of Animal Care and the University of British Columbia Committee on Animal Care (A10‐0231, A09 0916).
Recombinant HapoA‐I Production and Labeling
Recombinant hapoA‐I (rhapoA‐I) was expressed in Escherichia coli from plasmids encoding full‐length hapoA‐I containing an N‐terminal histidine tag and 1 of 5 C‐terminal cysteine substitution mutations (S231C, K239C, L240C, T242C, or Q243C). Protein was purified with a His‐trap chelating column (GE Healthcare), equimolar amounts of each mutant were pooled, and endotoxin was removed using an EndoTrap red endotoxin removal column (Hyglos). Final endotoxin levels were <10 endotoxin units/mg., as measured by the Limulus Amebocyte Lysate Kinetic‐QCL Assay (Lonza Bioscience). RhapoA‐I was labeled using Alexa Fluor 647 C2 malemide (Alexa647–rhapoA‐I), following the manufacturer's instructions (A‐20347; Invitrogen) at a molar ratio of 1:1.
Purification of Serum‐Derived HapoA‐I and Labeling
Purified lipid‐poor hapoA‐I derived from healthy human serum was generously provided by CSL Behring. For in vitro experiments, hapoA‐I was labeled with Alexa Fluor 488 carboxylic acid tetrafluorophenyl ester, according to the manufacturer's instructions (A‐10235; Invitrogen).
Intravenous Injection and CSF, Plasma, and Tissue Collection
Alexa647–rhapoA‐I or saline as vehicle was injected into the tail vein of C57Bl/6 mice at concentrations ranging from 7.5 to 120 mg/kg. Tissues were collected 30 minutes to 24 hours after injection. Mice were anesthetized with 20 mg/kg xylazine (Bayer) and 150 mg/kg ketamine (Bimeda‐MTC) intraperitoneally. CSF was isolated as described,14 and only samples that contained <20 red blood cells per cubic millimeter were used for subsequent analyses. EDTA blood was collected via cardiac puncture, centrifuged at 21 000g for 10 minutes at 20°C and stored at −80°C. Animals were perfused for 7 minutes at 8 mL/min with phosphate‐buffered saline containing 2500 U/L heparin. Tissues (liver, kidney, and brain) were removed, weighed, and frozen at −80°C. Half of the brain was fixed in 10% neutral buffered formalin followed by cryoprotection in 30% sucrose prior to cryostat sectioning for histological analysis.
Interstitial Fluid Collection
In vivo microdialysis was performed in 3‐ to 4‐month‐old C57Bl/6 mice, as described previously.18 All microdialysis procedures were performed in accordance with guidelines established by the animal studies committee at Washington University. Mice were anesthetized using 1.5% to 2.5% isoflurane then mounted onto a manipulator arm–equipped small animal stereotaxic apparatus (David Kopf Instruments). A bore hole (≈1 mm diameter) was then created above the left hippocampus (bregma 3.1 mm, 2.5 mm lateral; dura mater 1.2 mm). A second bore hole (0.75 mm) was placed in the right anterior quadrant of the skull for placement of an anchoring bone screw. An AtmosLM guide cannula (PEG‐X; Eicom) was then stereotactically inserted and cemented into the left hippocampal formation (12° angle, dura mater 1.2 mm). The wound was closed using surgical adhesive, and the animal was placed into a clean cage and provided with access to food and water ad libitum. Next, 1000‐kDa microdialysis probes (AtmosLM microdialysis probe, PEP‐X‐0Y; Eicom) were flushed with artificial CSF.19 Mice were then briefly anesthetized with isoflurane, and probes were inserted into the hippocampus through the guide cannula. Mice were then placed into a Raturn stand‐alone caging system (BASi). The flow rate was a constant 1.1 μL/min inlet and 1.0 μL/min outlet using a MAB20 dual‐channel peristaltic pump (SciPro). The microdialysis probe equilibrated in brain for 12 hours before sample collection started. Samples were collected every 2 hours for 12 hours using a refrigerated fraction collector (Univentor 820 Microsampler; SciPro). At the end of each experiment, samples were aliquoted and then immediately frozen at −80°C and stored for future analysis.
Intravenous Injection of Evans Blue
A 2% solution of Evans blue dye (Sigma‐Aldrich) in saline was injected at 4 mL/kg into the tail vein 30 minutes prior to sacrifice in mice injected with 7.5 or 120 mg/kg saline or Alexa647– rhapoA‐I 1.5 hours earlier. Pictures of liver, kidney, brain, and plasma were taken to illustrate the distribution and uptake of Evans blue, which binds to plasma albumin. Because Evans blue is also fluorescent, images of intact half brains were acquired using the Maestro fluorescent imager with the same conditions as those detailed below.
mRNA Extraction and Quantitative Reverse Transcriptase Polymerase Chain Reaction
RNA was extracted from tissues and cells using TRIzol (Invitrogen) and treated with DNase I prior to cDNA synthesis. The cDNA was generated using oligo(dT) primers and TaqMan reverse transcription reagents (Applied Biosystems). Primers were designed using Primer Express software (Applied Biosystems). Sequences are murine apoA‐I forward (5′ GACCTGCGCCATAGTCTGATG 3′) and reverse (5′ TCAGAGTCTCGCTGGCCTTG 3′), murine β‐actin forward (5′ ACGGCCAGGTCATCACTATTG 3′) and reverse (5′ CAAGAAGGAAGGCTGGAAAAG 3′), human apoA‐I forward (5′ ACCACGCCAAGGCCACCGAG 3′) and reverse (5′ CTCGAGCGCTCAGGAAGCT 3′), and human GAPDH forward (5′CCTGCACCACCAACTGCTTA 3′) and reverse (5′CATGAGTCCTTCCACGATACCA 3′). Quantitative reverse transcriptase polymerase chain reaction was done with SYBR Green reagents (Applied Biosystems) on a StepOnePlus system (Applied Biosystems). Cycling conditions were 50°C for 2 minutes, 95°C for 10 minutes, then 40 cycles at 95°C for 15 seconds and 60°C for 1 minute, followed by dissociation at 95°C for 15 seconds, 60°C for 20 seconds, and 95°C for 15 seconds. Each sample was assayed at least in duplicate, normalized to β‐actin or GAPDH, and analyzed with Applied Biosystems 7000 system SDS software v1.2, using the relative standard curve method.
Protein Extraction
For murine apoA‐I, tissues were homogenized in 8 volumes of ice‐cold RIPA buffer, sonicated at 20% output for 10 seconds, and then centrifuged at 8600g for 10 minutes at 4°C. For hapoA‐I ELISAs, tissues were homogenized in 2 volumes of ice‐cold PBS containing a cOmplete protease inhibitor cocktail tablet (Roche Diagnostics), and sonicated at 20% output for 10 seconds. Protein concentrations were determined using the BCA Protein Assay (Pierce).
Immunoblot
Equal volumes of CSF (5 μL), plasma (1 to 5 μL), interstitial fluid (ISF; 20 μL), and tissue lysate (150 to 200 μg) were subjected to immunoblotting, as described.14 The following antibodies were used: rabbit anti‐mouse apoA‐I (1:500‐1:2000, K23001R; Meridian), mouse anti‐albumin (0.2 to 0.5 mg/mL, A90‐134; Bethyl Laboratories), and mouse anti‐GAPDH (0.2 mg/mL, MAB374; Millipore), followed by horseradish peroxidase–conjugated secondary antibodies. Each sample was analyzed at least in duplicate on independent gels.
ELISA Measurement of ApoA‐I
Endogenous murine apoA‐I levels in plasma, CSF, and ISF were measured by commercial ELISA (MBS2019017; MyBioSource) following the manufacturer's instructions. RhapoA‐I levels were quantified by ELISA (A70101; ALerCHEK). Background absorption from saline‐injected controls were subtracted prior to calculation of rhapoA‐I concentration. For tissue, rhapoA‐I concentration was normalized to total protein.
Imaging and Histology
Image cubes of intact fixed half brains were collected using an excitation filter of 575 to 605 nm, an emission filter of 645 nm, and acquisition settings of 630 to 850 nm collected in 10‐nm steps (Maestro imaging system; PerkinElmer). Images were unmixed using real component analysis and quantified using threshold segmentation.
For immunohistochemical analysis, 3 to 4 sagittal sections of 25 to 40 μm and spaced 500 μm apart were analyzed per animal. Floating sections were blocked for 1 hour with 5% normal goat serum in PBS, stained with Cy3 anti‐mouse IgG (1:100, 715‐165‐150; Jackson Laboratory) for 36 to 48 hours at 4°C, washed with PBS, and stained overnight with fluorescein‐conjugated tomato lectin (0.2 mg/mL, FL1171; Vector Laboratories) to visualize endothelial and epithelial cells. Sections were washed with PBS and mounted on Superfrost Plus glass slides (Fisher Scientific) using Vectashield Hard Set mounting medium (Vector Laboratories). Images were taken using a BX61 fluorescent microscope (Olympus) and quantified using Image‐Pro software (Media Cybernetics) with the following filters: Alexa Fluor 488 for fluorescein, TexRed for Cy3, and Cy5 for Alexa Fluor 647. The automated OxPlow program within InVivo software (Media Cybernetics) was used to visualize the entirety of the sagittal section. A rectangular border encompassing the section was defined in OxPlow, and the microscope was instructed to take sequential images following a “snake‐like” pattern. For each section, ≈150 to 200 individual images were taken per channel. Individual images were tiled together using Image‐Pro. Confocal images were taken with a Leica SP5 microscope using the following settings: Fluorescein was excited with an argon laser at 458 nm, emission 500 to 560 nm; Cy3 was excited with an HeNe laser at 545 nm, emission 550 to 650 nm; Alexa647 was excited with an HeNe laser at 633 nm, emission collected 650 to 720 nm. Images were analyzed using LAS AF Lite software (Leica).
Human Choroid Plexus Epithelial Cell and Human Brain Microvascular Endothelial Cell Culture; In Vitro HapoA‐I Uptake, Binding, Transport, and Degradation Assays
Primary human choroid plexus epithelial cells (hCEpiCs) and human brain microvascular endothelial cells (hBMECs; ScienCell Research Laboratories) were cultivated using either complete epithelial or endothelial cell medium containing the provided supplements (ScienCell Research Laboratories) and used between passages 4 to 8. For uptake and colocalization assays, hCEpiCs and hBMECs were seeded at 5×10⁴ cells per well onto rat‐tail collagen‐coated cover slips and grown until confluent. On the assay day, cells were incubated with 50 μg/mL each of Alexa647–rhapoA‐I and Alexa Fluor 488–labeled hapoA‐I in DMEM containing 0.2% bovine serum albumin and 10 mmol/L HEPES for 1 hour at 37°C. To determine whether hapoA‐I colocalizes with the lysosome, cells were seeded as above and incubated with 200‐nm LysoTracker Green DND‐26 (Invitrogen) and 50 μg/mL Alexa647–rhapoA‐I for 1 hour at 37°C. Following incubation, cells were washed twice with PBS, fixed in 3.75% paraformaldehyde for 30 minutes, and washed with 0.5 mol/L Tris HCl, pH 8. After 2 additional PBS washes, cells were mounted in 0.1 mol/L Tris‐HCL, pH 9.5, and glycerol (3:7) containing 50 mg/mL n‐propyl gallate as an antifading reagent containing DAPI (1 ng/mL; Sigma‐Aldrich) onto Superfrost Plus glass slides.20
Radiolabeling, cell binding, and transport assays were performed as described.21 Briefly, 1 mg of hapoA‐I was incubated with 1 mCi of sodium iodide and 2 iodobeads (Pierce) for 15 minutes at room temperature. Proteins were separated from free iodine 125 (125I) using a Sephadex G‐25 (Sigma‐Aldrich) column followed by an intensive dialysis against 7.5 mol/L NaCl and 15 mmol/L EDTA to remove free 125I. For cellular binding, hCEpiCs and hBMECs were seeded at 8×10⁴ cells per well in 12‐well dishes in growth media and grown until confluent (≈2 days). On the assay day, cells were washed once, incubated on ice cold assay medium (DMEM with 0.2% lipid‐free bovine serum albumin and 10 mmol/L HEPES) for 30 minutes, and then incubated at 4°C for 1 hour with 5 μg/mL 125I‐labeled hapoA‐I alone or competed with 40‐fold excess of nonlabeled hapoA‐I in assay medium. For transport assays, hCEpiCs and hBMECs were seeded at 6 to 8×10⁴ cells per well onto rat‐tail collagen‐coated 0.3‐cm2, 0.4‐μm transwell inserts (353095; Corning) in growth media. Barrier formation was confirmed by measuring permeability to 4‐kDa FITC‐dextran (average cellular permeability 3.1 ×10− 6± 3.0×10⁻⁷ cm/s hCEpiCs, 1.7 × 10⁻⁶ ± 9.9 ×10⁻⁷cm/s hBMECs). On the assay day, cells were incubated at 37°C for 1 hour with 5 μg/mL 125I‐labeled hapoA‐I alone or competed with 40‐fold excess of nonlabeled hapoA‐I in assay medium. After 1 hour, cells were washed once with Tris wash buffer (50 mmol/L Tris–HCl, 0.15 mol/L NaCl, pH 7.4) containing 2 mg/mL bovine serum albumin, followed by 2 quick washes with Tris wash buffer without bovine serum albumin. Cells were then lysed in 0.1 mol/L NaOH for 30 minutes at room temperature. Radioactivity in the cell lysate or basolateral media was measured using a Beckman γ‐counter. For binding assays, the concentration of 125I‐labeled hapoA‐I per well was normalized to total protein concentration (ng/mg) and then expressed relative to cells treated with 125I‐labeled hapoA‐I alone for each experiment. For transport assays, raw count‐per‐minute data were expressed relative to cells treated with 125I‐labeled hapoA‐I alone for each experiment.
In addition to LysoTracker colocalization experiments, potential degradation of hapoA‐I by hCEpiCs and hBMECs was assessed using both radioactivity and denaturing immunoblotting. The radioactive degradation assay was performed as described previously.21 Briefly, cells were seeded at 8×10⁴ cells per well in 12‐well dishes and grown until confluent. On the day of the assay, the cells or control empty wells were incubated with 5 μg/mL 125I‐labeled hapoA‐I in the absence or presence of 40‐fold excess of nonlabeled hapoA‐I in assay medium. After incubation for 4 hours at 37°C, the amount of 125I‐labeled apoA‐I degradation products released into the medium was measured. The proteins in the incubation medium were precipitated with trichloroacetic acid. To distinguish cellular degradation products from free iodine in solution after trichloroacetic acid precipitation, the supernatant was oxidized by hydrogen peroxide and free iodine was extracted with trichloroethane. The radioactivity in the aqueous phase containing cellular degradation products was measured using a Perkin Elmer γ‐counter. In the denaturing immunoblotting experiments, hCEpiCs and hBMECs were seeded in transwell inserts, as detailed above, grown until confluent, and then incubated for 1 hour at 37°C with 0.5 mg/mL hapoA‐I in assay medium. The basolateral media was collected, concentrated 10‐fold using a 3‐kDa cutoff filter, and subjected to denaturing immunoblotting using 4% to 12% NuPAGE Bis‐Tris gradient gels (Invitrogen) and a human‐specific apoA‐I antibody (1:1000; Brookwood Biomedical).
Kinetic Modeling
The half‐life of hapoA‐I in plasma was determined by fitting the experimental data to a 2‐compartment decay model using the following equation: P=Ae−αt+Be−βt. For tissue, data were normalized to initial values except for brain, which peaked at 2 hours, and the first‐order elimination half‐lives were determined from the slopes of lines fitted to the natural logarithm of normalized experimental data at different time points. The fitting of the equation to experimental data was done using Origin 7.0 (OriginLab).
Statistics
Data were analyzed either by Student unpaired t test for normally distributed data or Mann–Whitney test for nonparametric data. Normality was assessed using the D'Agostino Pearson normality test. All analyses were performed by GraphPad Prism v5.0.
Results
In mice, steady‐state endogenous apoA‐I levels in CSF, ISF, and perfused brain tissue are, respectively, 0.018%, 0.0036%, and ≈10% to 15% of levels in plasma and liver.
We started by quantifying the steady‐state levels of endogenous murine apoA‐I in peripheral versus CNS compartments in 3‐ to 4‐month‐old female C57Bl/6 mice. Consistent with previous reports, we were unable to detect apoA‐I mRNA in cortical tissue obtained from C57Bl/6 mice or primary human epithelial and endothelial cell lines derived from the choroid plexus and brain microvasculature, respectively, indicating that the apoA‐I we detect in the CNS is most likely derived exclusively from the circulation following expression by the liver and intestine (Figure 1A). Commercially available highly sensitive ELISAs were used in conjunction with denaturing immunoblotting to determine the absolute and relative concentrations of apoA‐I protein in the CNS compared with the periphery (Figure 1B through 1F). By ELISA, apoA‐I measured 3932±265 μg/mL in plasma, 0.664±0.046 μg/mL in CSF, and 0.140±0.018 μg/mL in hippocampal ISF microdialysis samples (Figure 1B). Densitometric analysis of denaturing immunoblots of serially diluted plasma, used to generate a standard curve, and CSF (Figure 1C) or ISF (Figure 1D) confirmed that the relative levels of murine apoA‐I in CSF (0.012±0.003%) and hippocampal ISF (0.0016±0.0003%) are comparable to those determined by ELISA (0.0181±0.0016% for CSF and 0.00367±0.0005% for hippocampal ISF) (Figure 1E). Because the ELISA signal‐to‐noise ratio was too low to provide accurate quantitation in tissue lysates, the relative proportion of apoA‐I in brain tissue was determined by denaturing immunoblotting. Liver lysates were similarly diluted and compared with lysates from cortex, hippocampus, and cerebellum of well‐perfused C57Bl/6 and apoA‐I−/− mice (Figure 1F). Densitometric analysis shows that brain levels of murine apoA‐I are ≈10% to 15% of liver levels across 3 brain regions (Figure 1G).
Figure 1.
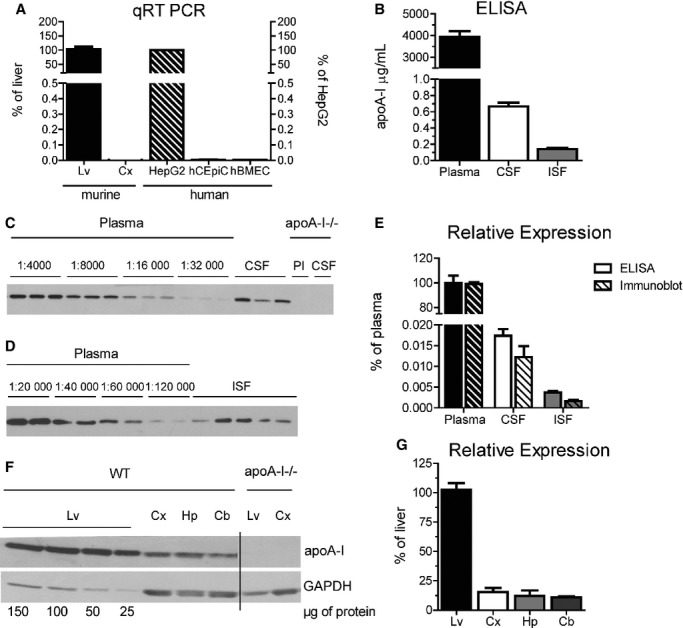
Steady‐state endogenous apoA‐I levels in 3‐ to 4‐month‐old female C57Bl/6 mice. A, ApoA‐I mRNA levels were quantified using qRT‐PCR. Murine apoA‐I (solid bars) was measured in cortical tissue and expressed relative to liver samples taken from matched C57Bl/6 mice. Tissue from apoA‐I−/− mice was used as a background control. Human apoA‐I (diagonal stripes) was measured in primary hCEpiCs and primary hBMECs and expressed relative to HepG2. Graphs represent mean±SEM with n=2 (cell lines), n=3 (cortical tissue), or n=4 (liver tissue) per group. B, ApoA‐I was measured in plasma, CSF, and ISF microdialysis samples taken from C57Bl/6 mice by commercial ELISA. Hippocampal ISF microdialysis samples were collected at a constant flow rate of 1.0 μL/min. Plasma and CSF samples from apoA‐I−/− mice were used as background controls. Graphs represent mean±SEM with n=6 (ISF) or n=9 (plasma and CSF) per group. C, Representative denaturing apoA‐I immunoblot of plasma (Pl) and CSF from 3 individual C57Bl/6 and apoA‐I−/− mice. We subjected 5 µL diluted plasma (1:4000 to 1:32 000) and undiluted CSF to denaturing gel electrophoresis followed by immunoblotting with a murine specific apoA‐I antibody. D, Representative denaturing apoA‐I immunoblot of plasma and ISF from 5 individual C57Bl/6 mice. We subjected 20 µL diluted plasma (1:20 000 to 1:120 000) and undiluted ISF to denaturing gel electrophoresis followed by immunoblotting with a murine specific apoA‐I antibody. E, Relative apoA‐I concentration as determined by ELISA (solid bars) or denaturing immunoblotting followed by densitometry (striped bars) expressed relative to plasma. Graphs represent mean±SEM with n=5 (ISF by immunoblot), n=6 (ISF by ELISA), n=7 (plasma by immunoblot), n=8 (CSF by immunoblot), or n=9 (plasma and CSF by ELISA) per group. F, We subjected 25 to 150 μg of liver and 150 μg of cortex, hippocampus and cerebellum lysates from C57Bl/6 mice to denaturing gel electrophoresis followed by immunoblotting against apoA‐I. Tissue samples from apoA‐I−/− mice were used as a negative control. G, Relative tissue apoA‐I levels were determined by densitometry and expressed relative to liver apoA‐I. Graphs represent mean±SEM with n=4. Apo indicates apolipoprotein; Cb, cerebellum; CSF, cerebrospinal fluid; Cx, cortex; hBMEC, human brain microvascular endothelial cells; hCEpiC, human choroid plexus epithelial cells; HepG2, immortalized hepatocytes; Hp, hippocampus; ISF, interstitial fluid; Lv, liver; qRT‐PCR, quantitative reverse transcriptase polymerase chain reaction; WT, wild‐type.
Elimination of Intravenously Injected RhapoA‐I From the CNS
To study the uptake, turnover, and elimination of plasma‐derived apoA‐I in the CNS, mice were injected intravenously via the tail vein with 60 mg/kg of lipid‐free Alexa647–rhapoA‐I, and samples were collected 30 minutes to 24 hours after injection. Tissues collected from well‐perfused mice were homogenized, and the levels of rhapoA‐I were quantified by ELISA (Figure 2A through 2E). RhapoA‐I measured 1577±192 μg/mL in plasma taken 1 minute after injection, in agreement with the theoretical maximum of 1250 μg/mL, given the total milligrams of rhapoA‐I injected and the theoretical plasma volume based on body weight (Figure 2A). Using a 2‐compartment decay model, the half‐life of plasma rhapoA‐I during the short distribution phase was calculated to be 0.9 hour, after which turnover slowed with an elimination half‐life of 10.9 hours. Peak rhapoA‐I concentrations in liver, 0.027±0.005 μg/mg, and kidney, 0.326±0.174 μg/mg, were detected at the earliest assessed time point, after which they were eliminated by first‐order decay for the first 2 hours with half‐lives of 14.3 hours (R2=0.998) in liver and 2.1 hours (R2=0.939) in kidney (Figure 2B and 2C). In contrast, rhapoA‐I concentrations in total brain lysates reached maximum levels 2 hours after injection, at 2.96±0.56 ng/mg, after which it was also eliminated by first‐order decay with a half‐life of 10.3 hours between 2 and 24 hours (R2=0.976) (Figure 2D). In the CSF, maximal rhapoA‐I levels were detected 30 minutes after injection, at 0.088±0.004 μg/mL, after which they subtly declined to 0.068±0.024 μg/mL 6 hours after injection and were undetectable 24 hours after injection (Figure 2E). These concentrations equate to 0.008% to 0.012% of plasma levels, similar to the 0.0181% ratio determined for steady‐state endogenous murine apoA‐I (Figure 1). By 24 hours after injection, the levels of rhapoA‐I in plasma, liver, kidney, and brain were 9.4%, 14.1%, 1.9%, and 11.9% of their maximum concentrations, respectively.
Figure 2.
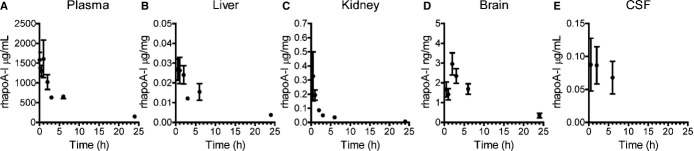
Alexa647‐rhapoA‐I accumulates in the CNS for up to 2 hours prior to elimination. Mice were injected with saline or 60 mg/kg of Alexa647‐rhapoA‐I. After 0.5, 1, 2, 3, 6, or 24 hours, mice were perfused, and the concentrations of rhapoA‐I in (A) plasma, (B) liver, (C) kidney, (D) brain, and (E) CSF were determined by commercial ELISA and normalized to total protein concentration in tissues. Graphs represent mean±SEM, with n=2 (3 hours), n=3 (0.5 hour), n=4 (1 hour, 2 hours), or n=5 (6 and 24 hours) for tissue and n=3 to 5 for CSF samples. Alexa647 indicates Alexa Fluor 647 labeled; CNS, central nervous system; CSF, cerebrospinal fluid; rhapoA‐I, recombinant human apolipoprotein A‐I.
We also determined the regional distribution of Alexa647–rhapoA‐I within the CNS in our elimination experiments using semiquantitative imaging. Maestro fluorescent imaging of intact half brains showed detectable ventricular fluorescence within 30 minutes of injection, peak intensity between 2 and 6 hours after injection, and a decline of signal intensity thereafter, in accordance with our ELISA observations for brain tissue (Figure 3).
Figure 3.
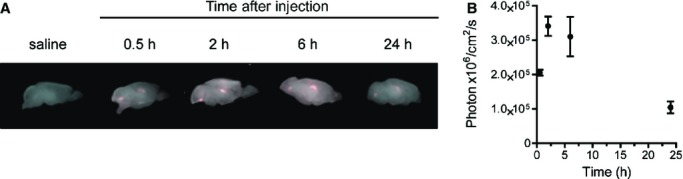
Alexa647‐rhapoA‐I is retained in cerebral ventricles up to 6 hours after a single injection. A, Representative Maestro fluorescent images of perfused intact half brains 0.5 to 24 hours following intravenous injection with saline or 60 mg/kg of Alexa647‐rhapoA‐I. B, Quantification of fluorescence in photon×106/cm2 per second was measured for each mouse and plotted following subtraction of background signal found in controls. Graphs represent mean±SEM, with n=2 (0.5 hour), n=4 (2 hours), and n=5 (6 and 24 hours). Alexa647 indicates Alexa Fluor 647 labeled; rhapoA‐I, recombinant human apolipoprotein A‐I.
Intravenously Injected RhapoA‐I Shows Dose‐Dependent Uptake in Brain
To test for dose‐dependent uptake of plasma‐derived apoA‐I uptake into the CNS, mice were injected intravenously via the tail vein with 7.5 to 120 mg/kg Alexa647–rhapoA‐I, and tissue samples were collected 2 hours after injection, when the brain shows maximal rhapoA‐I uptake. Levels of rhapoA‐I in plasma and lysates from liver, kidney, and brain tissue of well‐perfused mice were quantified by ELISA (Figure 4). As expected, plasma levels of rhapoA‐I increased with increasing injected dose (Figure 4A). In liver, the concentration of rhapoA‐I rapidly increased between 7.5 and 60 mg/kg and began to plateau at 120 mg/kg (Figure 4B). In kidney, rhapoA‐I levels again showed a direct relationship with injected dose, reflecting the role of the kidney in clearing lipid‐poor apoA‐I (Figure 4C). Because only a small proportion of injected rhapoA‐I reaches the brain, the dose‐dependency curve is more variable than for other tissues. Nevertheless, we observed that brain levels of rhapoA‐I reached roughly 1.5 to 2.5 ng/mg for animals injected at 15, 30, and 60 mg/kg, whereas injection at 120 mg/kg led to a further increase to 5.95±1.08 ng/mg (Figure 4D). Peak concentrations of rhapoA‐I after injection with 120 mg/kg reached 1260±72 μg/mL in plasma, 0.083±0.009 μg/mg in liver, and 0.142±0.028 μg/mg in kidney (Figure 2A through 2C). Importantly, rhapoA‐I levels in brain are ≈5% to 15% of those found in liver, comparable to the relative steady‐state levels for endogenous murine apoA‐I (Figure 1).
Figure 4.
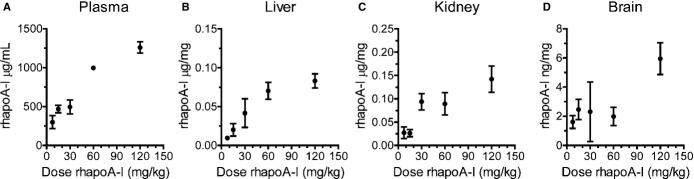
Dose‐dependent increase of Alexa647‐rhapoA‐I in plasma, liver, kidney, and brain. Mice were injected with 7.5 to 120 mg/kg Alexa647‐rhapoA‐I. At 2 hours after injection, tissue lysates were prepared from perfused mice. RhapoA‐I concentrations in (A) plasma and in perfused (B) liver, (C) kidney, and (D) brain were determined by ELISA and normalized to total protein concentration for tissues. Graphs represent mean±SEM, with n=2 (30 mg/kg), n=4 (7.5 mg/kg), n=5 (15 mg/kg), and n=6 (60 and 120 mg/kg). Alexa647 indicates Alexa Fluor 647 labeled; rhapoA‐I, recombinant human apolipoprotein A‐I.
Intravenously Injected Alexa647–RhapoA‐I Rapidly Localizes to Cerebral Ventricles and the Choroid Plexus
We next determined the regional distribution of Alexa647–rhapoA‐I within the CNS using semiquantitative imaging. Maestro fluorescent imaging of intact half brains demonstrates dose‐dependent accumulation of fluorescence within the cerebral ventricles between 7.5 and 120 mg/kg (Figure 5A and 5B). To visualize the regional distribution of Alexa647–rhapoA‐I in entire brain sections at high magnification, 40‐μm sagittal sections were generated and imaged at ×100 magnification using fluorescent microscopy. Using specialized computer software, ≈150 to 200 images were taken per section and stitched together to yield a high‐resolution image of the complete sagittal section (Figure 6). This technique confirmed that after injection into the bloodstream, Alexa647–rhapoA‐I is located almost exclusively in the choroid plexus of the lateral and fourth ventricles and is virtually undetectable in the brain vasculature (Figure 6). The pattern of Alexa647–rhapoA‐I distribution appeared the same in mice injected at all doses of hapoA‐I used (data not shown). As with Maestro imaging, we also observed a dose‐dependent increase of Alexa647–rhapoA‐I within the choroid plexus when sagittal sections were examined (Figure 7A and 7B). Endogenous IgG is also visible within the choroid plexus but does not show the dose‐dependent accumulation observed for hapoA‐I (Figure 7C and 7D). Furthermore, because we observed no IgG extravasation around the cerebrovasculature or choroid vessels in treated mice (data not shown), our results indicate that neither the BCSFB nor the BBB is compromised, even at the highest dose of Alexa647–rhapoA‐I used.
Figure 5.
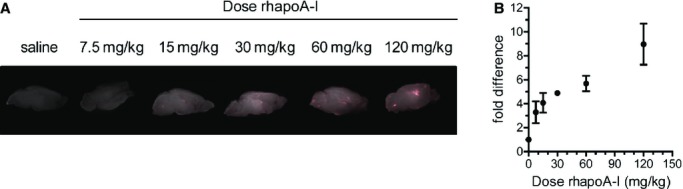
Dose‐dependent accumulation of Alexa Fluor 647‐labeled rhapoA‐I in cerebral ventricles and the choroid plexus: Mice were injected intravenously with saline or 7.5 to 120 mg/kg of Alexa Fluor 647‐labeled rhapoA‐I. At 2 hours after injection, mice were perfused and half brains were fixed. A, Maestro fluorescent imaging of the intact fixed half brain. B, Quantification of fluorescence using Maestro imaging. Raw signal was measured in photon×106/cm2 per second for each mouse and subsequently converted to fold difference with the saline injected control set to 1, allowing for combination of data from 2 independent experiments. Graphs represent mean±SEM, with n=2 (30 mg/kg), n=3 (7.5 mg/kg), n=5 (15, 60, and 120 mg/kg), or n=6 (saline control). Alexa647 indicates Alexa Fluor 647 labeled; rhapoA‐I, recombinant human apolipoprotein A‐I.
Figure 6.
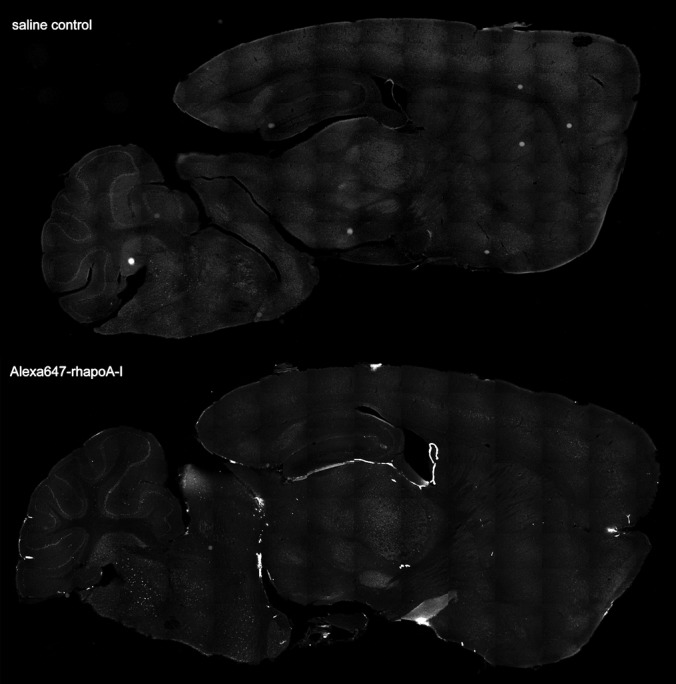
Intravenously injected Alexa647‐rhapoA‐I strongly localizes to the choroid plexus. Representative tiled fluorescent images of 40‐μm sagittal sections generated from mice injected intravenously with saline (top panel) or 7.5 mg/kg Alexa647‐rhapoA‐I (bottom panel) taken using the Cy5 filter to detect the Alexa Fluor 647 tag. For each section, ≈150 to 200 individual fluorescent images were taken in a sequential fashion and stitched together using automated software (Olympus). Alexa647‐rhapoA‐I indicates Alexa Fluor 647‐labeled recombinant human apolipoprotein.
Figure 7.

Dose‐dependent accumulation of Alexa647‐rhapoA‐I but not plasma IgG in the choroid plexus of mice injected with saline or increasing doses of Alexa647‐rhapoA‐I. Mice were injected intravenously with saline or 7.5 to 120 mg/kg Alexa647‐rhapoA‐I in saline. Sagittal sections were generated from fixed, perfused half brains taken 2 hours after injection for microscopic analysis. A, Representative ×100 fluorescent images showing accumulation of Alexa Fluor 647 fluorescence in the choroid plexus of the lateral ventricle. Scale bar represents 500 μm. B, Graphical representation of percent area covered by Alexa647‐rhapoA‐I in the choroid plexus quantified by Image‐Pro software. Graph represent mean±SEM for n=2 (7.7, 30, 60, 120 mg/kg) or n=3 (15 mg/kg) mice. C, Representative ×100 fluorescent images showing immunohistochemical detection of IgG in the choroid plexus using a Cy3‐conjugated antibody against murine IgG. Scale bar represents 500 μm. D, Graphical representation of percentage of area covered by IgG quantified using Image‐Pro software. Graph represents mean±SEM of n=2 (30 and 60 mg/kg), n=3 (7.5 and 120 mg/kg) or n=4 (15 mg/kg) mice. Alexa647 indicates Alexa Fluor 647 labeled; CP, choroid plexus; rhapoA‐I, recombinant human apolipoprotein.
We then performed confocal microscopy to determine the precise localization of Alexa647–rhapoA‐I compared with plasma IgG in the choroid plexus. In both saline and Alexa647–rhapoA‐I–injected mice, IgG staining is most intense within the vasculature, with only faint extravascular staining visible (Figure 8A and 8B). In contrast, the Alexa Fluor 647 signal is intensely localized within the epithelial cells of the choroid plexus of mice injected with Alexa647–rhapoA‐I (Figure 8B and 8C), suggesting its cellular uptake.
Figure 8.
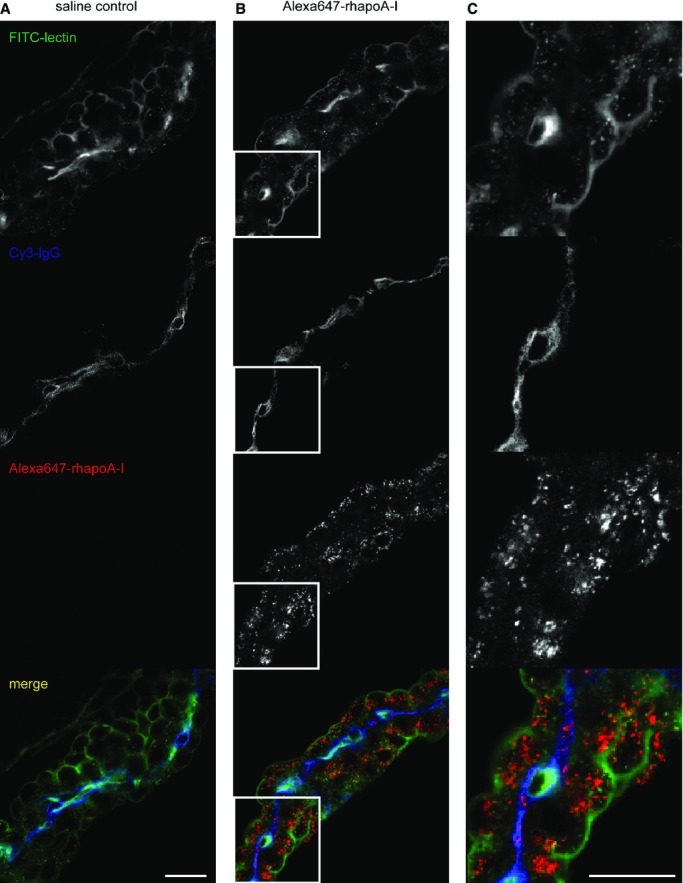
Alexa647‐rhapoA‐I is internalized by choroid plexus epithelial cells, whereas plasma IgG is retained within the vascular endothelium supplying the choroid plexus. Representative confocal images of the choroid plexus taken at ×400 magnification from mice injected with (A) saline or (B) 60 mg/kg Alexa647‐rhapoA‐I at 30 minutes after injection. Sagittal sections were costained with lectin (green) to visualize endothelial and epithelial cells and Cy3‐conjugated IgG (blue) as a plasma marker. The Alexa Fluor 647 signal from rhapoA‐I is shown in red. C, Enlarged view of (B) shown at full size for a selected region of each channel as depicted by the white box outline. Scale bar represents 25 μm. Alexa647 indicates Alexa Fluor 647 labeled; rhapoA‐I, recombinant human apolipoprotein.
We also confirmed barrier integrity by coinjecting Evans blue dye into a subgroup of animals 30 minutes prior to sacrifice. As expected, plasma, liver, and kidney samples stain deep blue, indicating the uptake of Evans blue dye bound to albumin (Figure 9A), yet the brain remains pale, indicating that hapoA‐I treatment did not compromise barrier integrity (Figure 9B). Evans blue dye is visible within the lateral ventricle when half brains are visualized using fluorescent imaging, reflecting the known transport of ≈0.1% to 0.3% of plasma albumin into the CSF under normal circumstances (Figure 9C).22 Taken together, these observations suggest that circulating hapoA‐I may gain access to CSF via transport across the choroid plexus.
Figure 9.
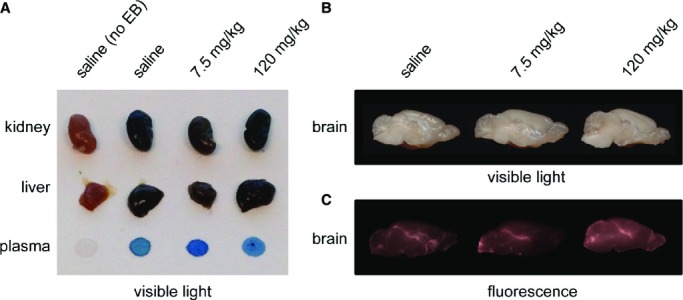
Abundant Evans blue dye uptake in the liver, kidney, and plasma but not brain in rhapoA‐I treated mice. At 30 minutes prior to sacrifice, mice were coinjected with a 2% solution of Evans blue dye (EB) in addition to a previous injection of either saline or Alexa647‐rhapoA‐I. Following perfusion, tissue samples were removed and photographed to compare the relative uptake of Evans blue dye, which binds to circulating albumin. A, Scanned image of kidney, liver, and plasma showing abundant dark blue staining in those mice injected with Evans blue dye, regardless of Alexa647‐rhapoA‐I. B, Scanned image of brains taken from corresponding mice. C, Fluorescent imaging of the same half brains depicted above revealing minimal and expected uptake of Evans blue dye–labeled plasma albumin into the ventricular system. Alexa647 indicates Alexa Fluor 647 labeled; rhapoA‐I, recombinant human apolipoprotein A‐I.
In Vitro, Cultured Primary Human Choroid Plexus Epithelial and Primary Human Brain Microvascular Endothelial Cells Show Similar ApoA‐I Binding, Internalization, and Transport Activities
Intravenously injected hapoA‐I clearly gains access to the choroid plexus, CSF, and brain tissue in mice, but whether this may occur in humans is not known. Consequently, we performed in vitro experiments using monotypic cultures of primary hCEpiCs and primary hBMECs. Although we did not detect noticeable fluorescence from Alexa647–rhapoA‐I within or around the brain microvasculature in treated mice, we cannot rule out that a fraction of hapoA‐I may also be transported across the endothelium of the BBB, as has been previously reported in porcine monotypic in vitro cell culture systems.23 HapoA‐I internalization, binding, and transport by hCEpiCs and hBMECs were characterized using hapoA‐I labeled with an Alexa fluorophore or 125I (Figures 10 and 11).
Figure 10.
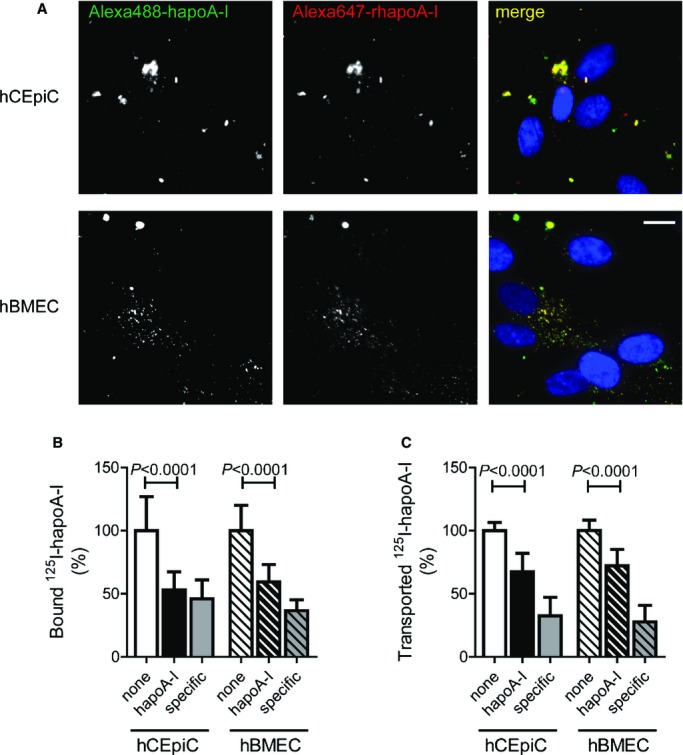
In vitro uptake, binding, cell association, and transport of hapoA‐I by primary monotypic hCEpiCs and hBMECs. A, Representative fluorescent images taken at ×400 magnification of hCEpiCs (top row) and hBMECs (bottom row) coincubated with 50 μg/mL each of Alexa488‐hapoA‐I (green) and Alexa647‐rhapoA‐I (red) for 1 hour, depicting DAPI‐stained nuclei (blue). Scale bar represents 25 μm. B, Specific binding (4°C) and (C) transport (37°C) of hapoA‐I by hCEpiCs and hBMECs was measured by incubating 5 μg/mL iodine 125–labeled hapoA‐I in the absence or presence of a 40‐fold excess unlabeled hapoA‐I for 1 hour at the indicated temperature. Values were calculated as counts per minute per well for transport and counts per minute per well per milligram of total protein for binding. Specific binding and transport were determined by subtracting the value obtained in the presence of excess unlabeled hapoA‐I from the total for each well. Values were then expressed relative to control hCEpiC and hBMEC wells to pool experiments. Graphs represent mean±SD from 4 independent experiments and a total of 12 wells per condition. Statistics were calculated using an unpaired Student t test for normally distributed data (binding hBMECs, transport hCEpiCs and hBMECs), or a Mann–Whitney test (binding hCEpiCs). Alexa488 indicates Alexa Fluor 488 labeled; Alexa647, Alexa Fluor 647 labeled; hBMEC indicates human brain microvascular endothelial cell; hCEpiC, human choroid plexus epithelial cell; hapoA‐I, human apolipoprotein A‐I; 125I, iodine 125 labeled; rhapoA‐I, recombinant human apolipoprotein.
Figure 11.
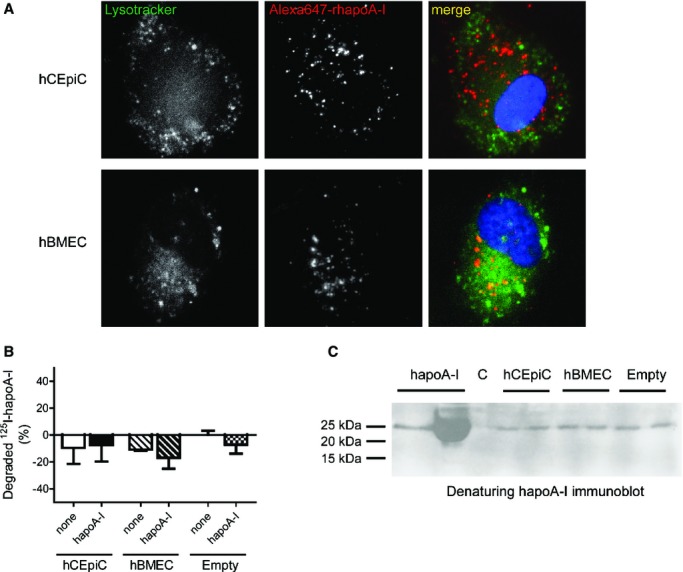
Internalized and transported hapoA‐I is not degraded by primary hCEpiCs and hBMECs in vitro. A, Representative fluorescent images taken at ×400 magnification of hCEpiCs (top row) and hBMECs (bottom row) coincubated with 200 nmol/L LysoTracker and 100 μg/mL of Alexa Fluor 647‐labeled rhapoA‐I (red) for 1 hour, depicting DAPI‐stained nuclei (blue). Scale bar represents 25 μm. B, hCEpiCs (solid) and hBMECs (striped) were seeded in flat‐bottom tissue culture plates and incubated with 5 μg/mL 125I‐hapoA‐I in the absence or presence of a 40‐fold excess unlabeled hapoA‐I for 4 hours at 37°C. Empty wells (checkered) were used as a control. After incubation, the amount of 125I‐hapoA‐I degradation products released into the medium was measured. The proteins in the incubation medium were precipitated with TCA. To distinguish the cellular degradation products from the free iodine in solution after TCA precipitation, the supernatant was oxidized by hydrogen peroxide and the free iodine extracted with chloroform. The degradation products in the aqueous phase were subsequently measured. Data is expressed such that the control empty well is zero. Graphs represent mean±SD, with n=3 (hBMEC), n=5 (empty control), or n=7 (hCEpiC) wells per condition from 1 to 2 independent experiments. C, hCEpiCs and hBMECs were seeded in a transwell insert and grown until a confluent monolayer formed. Cells were incubated with control serum‐free media or 0.5 mg/mL hapoA‐I for 1 hour. Empty inserts (far right) were used as a control. After incubation, the basolateral media was collected and concentrated using a 3‐kDa cutoff filter and subjected to denaturing immunoblotting with a human‐specific apoA‐I antibody. Purified apoA‐I, unconcentrated (0.5 mg/mL) and concentrated stocks (far left), were run as comparative input controls. C indicates control; hBMEC, human brain microvascular endothelial cell; hCEpiC, human choroid plexus epithelial cell; hapoA‐I, human apolipoprotein A‐I; 125I, iodine 125 labeled; rhapoA‐I, recombinant human apolipoprotein; TCA, trichloroacetic acid.
Using fluorescent microscopy, internalized Alexa‐labeled hapoA‐I was located in perinuclear vesicles, with strong colocalization occurring between recombinant Alexa647–rhapoA‐I (red) and serum‐derived Alexa Fluor 488‐labeled hapoA‐I (green), suggesting that epithelial and endothelial uptake is not altered by the point mutations present in the recombinant Alexa647–rhapoA‐I protein (Figure 10A). For binding and transport assays, cells were incubated with 125I‐labeled hapoA‐I alone or in the presence of 40‐fold excess of unlabeled hapoA‐I as a specific competitor. Specific binding and transport were determined by subtracting the counts obtained in the presence of excess cold hapoA‐I from the total counts and expressed relative to control hCEpiCs or hBMECs (Figure 10B and 10C). Binding of 125I‐labeled hapoA‐I, measured at 4°C to prevent internalization, was significantly decreased from 100±26.9% to 53.1±14.4% in hCEpiCs (P<0.0001) and from 100±20.1% to 59.5±13.7% in hBMECs (P<0.0001) when competed with excess cold hapoA‐I (Figure 10B). We then measured the ability of cells grown on transwell inserts to transport 125I‐labeled hapoA‐I from the apical to basolateral compartment. Transport of 125I‐labeled hapoA‐I was decreased significantly in hCEpiCs, from 100±6.4% to 67.4±14.7% (P<0.0001), and from 100±8.3% to 72.2±13.0% (P<0.0001) in hBMECs when competed with excess cold hapoA‐I (Figure 10C). Importantly, competition with of 125I‐labeled hapoA‐I with bovine serum albumin did not alter the binding or transport of 125I‐labeled hapoA‐I in either cell type (data not shown), suggesting that both hCEpiCs and hBMECs can bind, internalize, and transport hapoA‐I via specific cellular mechanisms.
Last, we sought to determine whether hapoA‐I is degraded by either hCEpiCs or hBMECs (Figure 11). Using fluorescent microscopy, we observed no significant colocalization of Alexa647–rhapoA‐I with a lysosomal marker in either cell type (Figure 11A). Fragments of hapoA‐I, indicating degradation, were not detected in conditioned media using highly sensitive trichloroacetic acid precipitation assays or via denaturing immunoblotting (Figure 11B and 11C). Taken together, these results support the hypothesis that internalized hapoA‐I is not routed for degradation following internalization at the apical side of primary hCEpiCs or hBMECs but may be transported through the polarized cell for eventual secretion from the basolateral side.
Discussion
Potential roles for apoA‐I‐containing HDL in cerebrovascular health and AD pathogenesis are emerging from both epidemiological and animal studies.5 The levels and, more important, the cholesterol efflux capacity and vasoprotective properties of HDL decrease during aging24 and decrease even more so with comorbid conditions such as cardiovascular disease and type 2 diabetes mellitus8–9 that are associated with increased AD risk.6–7 Higher levels of circulating plasma apoA‐I at midlife25 and HDL‐C later in life26 are associated with significantly reduced AD risk, even after adjusting for APOE genotype and other vascular risk factors. Plasma apoA‐I is reduced by 20% to 30% in patients with mild AD compared with age‐matched nondemented controls.27–30 In patients with AD, plasma levels of apoA‐I are positively correlated with measures of cognitive function, such as the Cognitive Abilities Screening Instrument and the Mini‐Mental State Examination,29–30 and negatively correlated with measures of brain atrophy.31 Intriguingly, low plasma HDL‐C was recently associated with and predicted higher amyloid binding, as measured using Pittsburgh compound B positron emission tomography of cognitively normal subjects and elderly subjects with mild cognitive impairment, independent of APOE4.32 Within the CNS, alterations to apoA‐I are less clear, potentially due to the small sample sizes of existing studies: ApoA‐I levels in brain tissue and CSF33–35 of AD subjects have been reported to be decreased, although 2 other studies36–37 found no difference in CNS apoA‐I levels. Because apoA‐I is found in the CSF of many species, despite being synthesized only in liver and intestine,5 this study was designed to explore the mechanisms by which circulating apoA‐I accesses the CNS. Our findings suggest that injected hapoA‐I gains access to the CNS via preferential uptake by the epithelial cells of the choroid plexus via a specific cellular mechanism that remains to be defined. Choroid epithelial cells may retain a portion of internalized rhapoA‐I and secrete internalized rhapoA‐I into the CSF, where it can be exchanged into the ISF. Although we did not observe localization of injected rhapoA‐I in the cerebral vasculature in vivo, in vitro monotypic cultures of human choroidal epithelial and vascular endothelial cells both demonstrated the ability to bind, internalize, and transport hapoA‐I in a specific manner. As such, we cannot rule out the possibility that a portion of hapoA‐I is also transported across the BBB. Given that the surface area of the BBB for transport of molecules is ≈5000 times larger than that of the choroid plexus epithelium, even a small contribution of apoA‐I transport across BBB endothelial cells may have a large effect in vivo. Further experiments will be required to determine whether the differences between our in vivo and in vitro observations are due to species differences or to the use of monotypic cultures with behavior in culture that may not be fully representative of internalization and transport activities of corresponding cell types in vivo.
With a few exceptions, transport into and out of the CNS is tightly regulated by a set of barriers, namely, the BCSFB, between the blood and the CSF, and the BBB, between the blood and brain tissue. Previous studies examining apoA‐I entry into the CNS have focused primarily on endothelial transport. Protamine‐oligonucleotide nanoparticles, or proticles, coated with apoA‐I exhibited increased uptake and transcytosis across in vitro primary porcine brain capillary endothelial cells cultured on transwells.23 Increased delivery of apoA‐I–coated proticles to astrocytes cocultured on the basolateral side of the transwell insert was also observed, although 93% to 94% of these proticles were degraded.23 Incubation with an anti‐SR‐BI antibody blocked apoA‐I–induced increase in proticle transport,23 consistent with SR‐BI mediating the uptake of HDL‐associated cholesterol esters38 and phosphatidylcholine39 in porcine brain capillary endothelial cells in vitro. That we observed virtually no degradation of hapoA‐I in our transport assays suggests that proticle transport may be fundamentally different than transport of free hapoA‐I or that cultured human cells may behave differently than porcine cells with respect to transport. In mice, Zensi et al observed that human serum albumin nanoparticles covalently linked to apoE40 or apoA‐I41 were detected within the endothelial cells of the BBB and brain parenchyma by transmission electron microscopy 15 to 30 minutes following intravenous injection. Taken together, these results suggest that apoA‐I may facilitate uptake of exogenous particles across the BBB. However, the behavior of free apoA‐I or apoA‐I within HDL, as it is normally found, may differ from apoA‐I when it is coupled to cargo destined for CNS uptake.
The novelty of our study lies in the fact that we used both in vitro and in vivo methods to examine the question of apoA‐I transport into the CNS. Although the apoA‐I we injected was initially lipid‐free, apoA‐I is known to quickly acquire lipids and associate with endogenous HDL once in circulation.42 In vivo, transport across the murine BCSFB is clearly observed, whereas—to our surprise—we could find no evidence of rhapoA‐I within the cerebral vasculature of treated mice, although we note that our methods may not have sufficient sensitivity to detect rhapoA‐I within the cerebrovasculature. In vitro, primary hCEpiCs and hBMECs are able to bind, internalize, and transport intact hapoA‐I with virtually identical efficiency (Figures 10 and 11). Consequently, the largest issue raised by our results is to explain the difference between the in vivo and in vitro observations. Potential species differences between murine and human cells is one clear possibility, and others include factors related to the conditions used for monotypic cell culture. The primary human cells used for our in vitro experiments were derived from separate donors, and the specific passage number could also influence protein expression and activity. Most likely is that monotypic cultures do not replicate the in vivo microenvironment in which these cell types normally reside. Further experiments will be required to improve the culture conditions so they are more representative of in vivo conditions for the eventual identification of the transport mechanisms involved. Last, specialized areas of the brain called the circumventricular organs, located in the walls of the third and fourth ventricle, are similar to the BCSFB in that they contain highly permeable fenestrated endothelial cells.43 Because they lack a formal BBB, circumventricular organs allow for rapid exchange and communication between the circulation and the regional neurons that regulate the release of neurohormones and uptake of circulating metabolites.43 Recent research has demonstrated the presence of a restrictive tight‐junction–expressing barrier between the circumventricular organs and the CSF formed by tanycyte‐like ependymal cells that form the ventricular wall, similar to the epithelial cells of the choroid plexus.44 Notably, we did not observe marked uptake of hapoA‐I in circumventricular organs in whole sagittal sections of treated mice.
Endothelial and epithelial cells may have distinct mechanisms by which apoA‐I transport is regulated. In aortic endothelial cells, ABCA1 and the ectopic β‐ATPase mediate cell‐surface internalization and transport of lipid‐free apoA‐I.45–46 In the kidney, apoA‐I is filtered by epithelial cells in the renal proximal tubule by a combination of the multiligand endocytic receptors cubilin, megalin, and amnionless.47 Endocytosis of cubilin complexed to apoA‐I is triggered by binding to megalin, also known as low‐density lipoprotein receptor related protein 2 (LRP2), which delivers cubilin and associated ligands to the lysosome for degradation.47 Megalin is expressed at the apical membrane in the choroid plexus of multiple species,22 whereas cubilin has been found in the choroid plexus of the developing rat up to embryonic day 15,48 although its expression patterns within the adult CNS are unknown. Although megalin and cubilin function in kidney epithelium as canonical endocytic/catabolic receptors,47 megalin at the choroid plexus may participate in receptor‐mediated transcytosis of a variety of ligands including insulin‐like growth factor,49 leptin,50 and apoJ.51 Furthermore, cerebrovascular endothelial cells express tight and adherens junction proteins to form the BBB, whereas endothelial cells in the capillaries that supply the choroid plexus are fenestrated, a common feature of nonsinusoidal fenestrated microvasculature found in other tissues such as the proximal tubules of the kidney, pancreas, and adrenal cortex.22 Barrier properties are derived from the choroidal epithelium, which, in addition to actively producing CSF, expresses apical belt‐like tight junctions to form the BCSFB. The BCSFB expresses a multitude of specific transporters and receptors that govern the entry and exit of many compounds into and out of the CSF.22 Whether megalin, cubilin, or other transporters may participate in apoA‐I transcytosis across the BCSFB is not yet known. Further delineating the specific transport mechanisms and potential receptor involvement will be a critical next step.
There are several caveats for our study. First, the majority of in vivo experiments used rhapoA‐I containing C‐terminal cysteine mutations to facilitate Alexa labeling; however, we observed strong colocalization between recombinant and serum‐derived hapoA‐I in hCEpiCs and hBMECs (Figure 10) and a similar peak brain concentration (2 to 3 ng/mg) following intravenous injection of 60 mg/kg serum‐derived hapoA‐I (data not shown). These observations suggest that CNS transport is similar between these 2 hapoA‐I preparations. A second caveat is the measurement of apoA‐I, both endogenous and exogenous, in whole‐brain tissue lysates, which retain both choroid plexus and vascular structures. Third, despite perfusion of at least 70 mL of saline into experimental animals, it is possible that a minor proportion of circulating hapoA‐I may remain in the vessel lumen or bound to vascular endothelial cells, thus overestimating the actual brain hapoA‐I concentration. Further experiments will be needed to determine whether the apoA‐I levels measured in whole‐brain tissue reflect hapoA‐I that has actually crossed either the BBB or BCSFB.
One of the aims of this study was to establish the steady‐state levels of murine apoA‐I in the CNS compared with peripheral tissues in young healthy C57Bl/6 mice. The plasma level of apoA‐I in C57Bl/6 mice has been estimated to be 1.1±0.1 mg/mL based on protein mass quantitation following single radial immunodiffusion.52 Comparatively, by ELISA, we report murine apoA‐I to be 2.5 to 3.5 times this value, at 3.8±0.2 mg/mL. This discrepancy may be explained in part by the difference in techniques and the greater sensitivity of ELISA. ApoA‐I uptake into the CSF may also be influenced by species, age, and barrier integrity status in addition to steady‐state plasma levels. The concentration and ratio of CSF apoA‐I, for example, varies greatly between species: 0.07±0.055 μg/mL (0.01% of plasma) in rats,53 1.3±0.18 μg/mL (0.1% of plasma) in macaques,54 3.7±0.8 μg/mL (0.26% of plasma) in humans,55 and 8.0±1.5 μg/mL (0.5% of plasma) in dogs.56 HapoA‐I in the CSF of 12‐month‐old APP/PS1 mice crossed to hapoA‐I transgenic mice, in which plasma hapoA‐I measures 2.43±0.96 mg/mL,52 reaches 3±1 μg/mL, representing ≈0.12% of plasma levels,11 or nearly 10‐fold the CSF levels measured in this study; however, these 12‐month‐old transgenic AD mice may also have a compromised BBB and/or BCSFB compared with the 3‐ to 5‐month‐old C57Bl/6 mice used in this study. To our knowledge, apoA‐I levels in ISF have not been measured before. In a recent study, the concentration of apoE in hippocampal ISF microdialysis samples from young C57Bl/6 mice, also collected at a flow rate of 1.0 μL/min, was reported as 0.0101±0.0018 μg/mL, whereas total CSF apoE measured 6.024±0.152 μg/mL.18 The reported value of apoA‐I in hippocampal ISF microdialysis samples measured in this study, 0.140±0.018 μg/mL, is significantly higher than that reported for apoE, as is the ratio of ISF:CSF (apoA‐I [21%] or apoE [0.17%]). Ulrich et al made the important observation that the concentration of ISF apoE was inversely related to the flow rate at which it was collected; by using a range of flow rates for collection, they determined that the total amount of exchangeable apoE in ISF was 0.1112±0.0144 μg/mL, 10‐fold higher than the mean concentration measured at 1.0 μL/min.18 Whether apoA‐I behaves in a similar fashion or how the interchange of apoA‐I among plasma, CSF, and ISF occurs remains unknown and may provide further insight into the differences observed.
Like the cerebrovasculature, the choroid plexus develops structural and functional damage in AD.57 In aging and even more so in AD, epithelial cell atrophy contributes to a ≥50% decrease in CSF production, which, in conjunction with increased ventricular volume, results in lower flow and turnover of CSF.57 Concomitantly, the concentration of potentially toxic peptides and metabolites increases, and the ventricular sink action that draws catabolites from the ISF into the CSF via a concentration gradient is markedly decreased.57 Because LRP1‐mediated clearance of Aβ across the BBB is compromised in AD,4 the brain may depend more heavily on reabsorption of ISF Aβ by CSF for transport across the BCSFB.57 Together, multiple mechanisms may lead to increased Aβ deposition in the choroid plexus, confirmed histologically at post mortem in patients with AD and in APP/PS1 transgenic AD mice.58–59 Aβ deposition is associated with a reduction in mitochondrial activity, increased generation of reactive oxygen species, and expression of caspases 3 and 9, ultimately leading to increased apoptosis.58–59 Interestingly, apoA‐II exhibited increased oxidative damage in the choroid plexus of patients with AD, further suggesting that HDL metabolism at the choroid plexus may be impaired in advanced AD.58
Both HDL levels and cholesterol efflux capacity decline with age.24 It is not known whether the onset of age‐related dysfunction in either cerebrovascular endothelial cells or choroid epithelial cells correlate with age‐related reductions in HDL or apoA‐I levels. Although HDL and apoA‐I have demonstrated beneficial functions in promoting endothelial cell health,5 it is not known whether these effects may extend to cerebrovascular endothelial cells or choroid epithelial cells. The in vivo and in vitro data shown in this paper support the conclusion that circulating hapoA‐I can be transported through choroid epithelial cells into the CNS. That cellular binding and transport can be competed by an excess of unlabeled hapoA‐I suggests that specific transport pathways exist, and future studies will determine whether these pathways are similar to those that regulate transport of apoA‐I through endothelial cells in the periphery. HDL may represent a key interface between peripheral metabolism and CNS health.
Sources of Funding
This work was supported by operating funding from the Canadian Institutes of Health Research (CIHR) and the Alzheimer's Society of Canada to Wellington and a CIHR Vanier Scholarship to Stukas. Robert holds an Early Postdoctoral Mobility fellowship from the Swiss National Science Foundation (P2ZHP3_155048). Kizhakkedathu holds a Career Investigator Scholar award from the Michael Smith Foundation for Health Research (MSFHR). Chapanian acknowledges CIHR‐CBS and MSFHR postdoctoral fellowships.
Disclosures
None.
Acknowledgments
Serum‐derived hapoA‐I was generously provided by Dr Samuel Wright (CSL Behring).
References
- 1.Shah AS, Tan L, Long JL, Davidson WS. Proteomic diversity of high density lipoproteins: our emerging understanding of its importance in lipid transport and beyond. J Lipid Res. 2013; 54:2575-2585. [DOI] [PMC free article] [PubMed] [Google Scholar]
- 2.Kontush A, Lhomme M, Chapman MJ. Unraveling the complexities of the HDL lipidome. J Lipid Res. 2013; 54:2950-2963. [DOI] [PMC free article] [PubMed] [Google Scholar]
- 3.Mineo C, Shaul PW. Novel biological functions of high‐density lipoprotein cholesterol. Circ Res. 2012; 111:1079-1090. [DOI] [PMC free article] [PubMed] [Google Scholar]
- 4.Zlokovic BV. Neurovascular pathways to neurodegeneration in Alzheimer's disease and other disorders. Nat Rev Neurosci. 2011; 12:723-738. [DOI] [PMC free article] [PubMed] [Google Scholar]
- 5.Stukas S, Robert J, Wellington CL. High density lipoproteins and cerebrovasular integrity in Alzheimer's disease. Cell Metab. 2014; 19:574-591. [DOI] [PubMed] [Google Scholar]
- 6.Mayeux R, Stern Y. Epidemiology of Alzheimer disease. Cold Spring Harb Perspect Med. 2012; 2:a006239. [DOI] [PMC free article] [PubMed] [Google Scholar]
- 7.Duron E, Hanon O. Vascular risk factors, cognitive decline, and dementia. Vasc Health Risk Manag. 2008; 4:363-381. [DOI] [PMC free article] [PubMed] [Google Scholar]
- 8.Sorrentino SA, Besler C, Rohrer L, Meyer M, Heinrich K, Bahlmann FH, Mueller M, Horvath T, Doerries C, Heinemann M, Flemmer S, Markowski A, Manes C, Bahr MJ, Haller H, von Eckardstein A, Drexler H, Landmesser U. Endothelial‐vasoprotective effects of high‐density lipoprotein are impaired in patients with type 2 diabetes mellitus but are improved after extended‐release niacin therapy. Circulation. 2010; 121:110-122. [DOI] [PubMed] [Google Scholar]
- 9.Riwanto M, Rohrer L, Roschitzki B, Besler C, Mocharla P, Mueller M, Perisa D, Heinrich K, Altwegg L, von Eckardstein A, Luscher TF, Landmesser U. Altered activation of endothelial anti‐ and proapoptotic pathways by high‐density lipoprotein from patients with coronary artery disease: role of high‐density lipoprotein‐proteome remodeling. Circulation. 2013; 127:891-904. [DOI] [PubMed] [Google Scholar]
- 10.Lefterov I, Fitz NF, Cronican AA, Fogg A, Lefterov P, Kodali R, Wetzel R, Koldamova R. Apolipoprotein A‐I deficiency increases cerebral amyloid angiopathy and cognitive deficits in APP/PS1DeltaE9 mice. J Biol Chem. 2010; 285:36945-36957. [DOI] [PMC free article] [PubMed] [Google Scholar]
- 11.Lewis TL, Cao D, Lu H, Mans RA, Su YR, Jungbauer L, Linton MF, Fazio S, LaDu MJ, Li L. Overexpression of human apolipoprotein A‐I preserves cognitive function and attenuates neuroinflammation and cerebral amyloid angiopathy in a mouse model of Alzheimer disease. J Biol Chem. 2010; 285:36958-36968. [DOI] [PMC free article] [PubMed] [Google Scholar]
- 12.Paula‐Lima AC, Tricerri MA, Brito‐Moreira J, Bomfim TR, Oliveira FF, Magdesian MH, Grinberg LT, Panizzutti R, Ferreira ST. Human apolipoprotein A‐I binds amyloid‐beta and prevents Abeta‐induced neurotoxicity. Int J Biochem Cell Biol. 2009; 41:1361-1370. [DOI] [PubMed] [Google Scholar]
- 13.Hirsch‐Reinshagen V, Zhou S, Burgess BL, Bernier L, McIsaac SA, Chan JY, Tansley GH, Cohn JS, Hayden MR, Wellington CL. Deficiency of ABCA1 impairs apolipoprotein E metabolism in brain. J Biol Chem. 2004; 279:41197-41207. [DOI] [PubMed] [Google Scholar]
- 14.Stukas S, May S, Wilkinson A, Chan J, Donkin J, Wellington CL. The LXR agonist GW3965 increases apoA‐I protein levels in the central nervous system independent of ABCA1. Biochim Biophys Acta. 2012; 1821:536-546. [DOI] [PubMed] [Google Scholar]
- 15.Karasinska JM, Rinninger F, Lutjohann D, Ruddle P, Franciosi S, Kruit JK, Singaraja RR, Hirsch‐Reinshagen V, Fan J, Brunham LR, Bissada N, Ramakrishnan R, Wellington CL, Parks JS, Hayden MR. Specific loss of brain ABCA1 increases brain cholesterol uptake and influences neuronal structure and function. J Neurosci. 2009; 29:3579-3589. [DOI] [PMC free article] [PubMed] [Google Scholar]
- 16.Wahrle SE, Jiang H, Parsadanian M, Kim J, Li A, Knoten A, Jain S, Hirsch‐Reinshagen V, Wellington CL, Bales KR, Paul SM, Holtzman DM. Overexpression of ABCA1 reduces amyloid deposition in the PDAPP mouse model of Alzheimer disease. J Clin Invest. 2008; 118:671-682. [DOI] [PMC free article] [PubMed] [Google Scholar]
- 17.Mockel B, Zinke H, Flach R, Weiss B, Weiler‐Guttler H, Gassen HG. Expression of apolipoprotein A‐I in porcine brain endothelium in vitro. J Neurochem. 1994; 62:788-798. [DOI] [PubMed] [Google Scholar]
- 18.Ulrich JD, Burchett JM, Restivo JL, Schuler DR, Verghese PB, Mahan TE, Landreth GE, Castellano JM, Jiang H, Cirrito JR, Holtzman DM. In vivo measurement of apolipoprotein e from the brain interstitial fluid using microdialysis. Mol Neurodegener. 2013; 8:13. [DOI] [PMC free article] [PubMed] [Google Scholar]
- 19.Cirrito JR, May PC, O'Dell MA, Taylor JW, Parsadanian M, Cramer JW, Audia JE, Nissen JS, Bales KR, Paul SM, DeMattos RB, Holtzman DM. In vivo assessment of brain interstitial fluid with microdialysis reveals plaque‐associated changes in amyloid‐beta metabolism and half‐life. J Neurosci. 2003; 23:8844-8853. [DOI] [PMC free article] [PubMed] [Google Scholar]
- 20.Robert J, Weber B, Frese L, Emmert MY, Schmidt D, von Eckardstein A, Rohrer L, Hoerstrup SP. A three‐dimensional engineered artery model for in vitro atherosclerosis research. PLoS One. 2013; 8:e79821. [DOI] [PMC free article] [PubMed] [Google Scholar]
- 21.Rohrer L, Cavelier C, Fuchs S, Schluter MA, Volker W, von Eckardstein A. Binding, internalization and transport of apolipoprotein A‐I by vascular endothelial cells. Biochim Biophys Acta. 2006; 1761:186-194. [DOI] [PubMed] [Google Scholar]
- 22.Strazielle N, Ghersi‐Egea JF. Physiology of blood‐brain interfaces in relation to brain disposition of small compounds and macromolecules. Mol Pharm. 2013; 10:1473-1491. [DOI] [PubMed] [Google Scholar]
- 23.Kratzer I, Wernig K, Panzenboeck U, Bernhart E, Reicher H, Wronski R, Windisch M, Hammer A, Malle E, Zimmer A, Sattler W. Apolipoprotein A‐I coating of protamine‐oligonucleotide nanoparticles increases particle uptake and transcytosis in an in vitro model of the blood‐brain barrier. J Control Release. 2007; 117:301-311. [DOI] [PMC free article] [PubMed] [Google Scholar]
- 24.Walter M. Interrelationships among HDL metabolism, aging, and atherosclerosis. Arterioscler Thromb Vasc Biol. 2009; 29:1244-1250. [DOI] [PubMed] [Google Scholar]
- 25.Saczynski JS, White L, Peila RL, Rodriguez BL, Launer LJ. The relation between apolipoprotein A‐I and dementia: the Honolulu‐Asia aging study. Am J Epidemiol. 2007; 165:985-992. [DOI] [PubMed] [Google Scholar]
- 26.Reitz C, Tang MX, Schupf N, Manly JJ, Mayeux R, Luchsinger JA. Association of higher levels of high‐density lipoprotein cholesterol in elderly individuals and lower risk of late‐onset Alzheimer disease. Arch Neurol. 2010; 67:1491-1497. [DOI] [PMC free article] [PubMed] [Google Scholar]
- 27.Kawano M, Kawakami M, Otsuka M, Yashima H, Yaginuma T, Ueki A. Marked decrease of plasma apolipoprotein AI and AII in Japanese patients with late‐onset non‐familial Alzheimer's disease. Clin Chim Acta. 1995; 239:209-211. [DOI] [PubMed] [Google Scholar]
- 28.Kuriyama M, Takahashi K, Yamano T, Hokezu Y, Togo S, Osame M, Igakura T. Low levels of serum apolipoprotein A I and A II in senile dementia. Jpn J Psychiatry Neurol. 1994; 48:589-593. [DOI] [PubMed] [Google Scholar]
- 29.Merched A, Xia Y, Visvikis S, Serot JM, Siest G. Decreased high‐density lipoprotein cholesterol and serum apolipoprotein AI concentrations are highly correlated with the severity of Alzheimer's disease. Neurobiol Aging. 2000; 21:27-30. [DOI] [PubMed] [Google Scholar]
- 30.Shih YH, Tsai KJ, Lee CW, Shiesh SC, Chen WT, Pai MC, Kuo YM. Apolipoprotein C‐III is an amyloid‐beta‐binding protein and an early marker for Alzheimer's disease. J Alzheimers Dis. 2014; 41:855-865. [DOI] [PubMed] [Google Scholar]
- 31.Hye A, Riddoch‐Contreras J, Baird AL, Ashton NJ, Bazenet C, Leung R, Westman E, Simmons A, Dobson R, Sattlecker M, Lupton M, Lunnon K, Keohane A, Ward M, Pike I, Zucht HD, Pepin D, Zheng W, Tunnicliffe A, Richardson J, Gauthier S, Soininen H, Kloszewska I, Mecocci P, Tsolaki M, Vellas B, Lovestone S. Plasma proteins predict conversion to dementia from prodromal disease. Alzheimers Dement. 2014 [DOI] [PMC free article] [PubMed] [Google Scholar]
- 32.Reed B, Villeneuve S, Mack W, DeCarli C, Chui HC, Jagust W. Associations between serum cholesterol levels and cerebral amyloidosis. JAMA Neurol. 2014; 71:195-200. [DOI] [PMC free article] [PubMed] [Google Scholar]
- 33.Puchades M, Hansson SF, Nilsson CL, Andreasen N, Blennow K, Davidsson P. Proteomic studies of potential cerebrospinal fluid protein markers for Alzheimer's disease. Brain Res Mol Brain Res. 2003; 118:140-146. [DOI] [PubMed] [Google Scholar]
- 34.Castano EM, Roher AE, Esh CL, Kokjohn TA, Beach T. Comparative proteomics of cerebrospinal fluid in neuropathologically‐confirmed Alzheimer's disease and non‐demented elderly subjects. Neurol Res. 2006; 28:155-163. [DOI] [PubMed] [Google Scholar]
- 35.Roher AE, Maarouf CL, Sue LI, Hu Y, Wilson J, Beach TG. Proteomics‐derived cerebrospinal fluid markers of autopsy‐confirmed Alzheimer's disease. Biomarkers. 2009; 14:493-501. [DOI] [PMC free article] [PubMed] [Google Scholar]
- 36.Harr SD, Uint L, Hollister R, Hyman BT, Mendez AJ. Brain expression of apolipoproteins E, J, and A‐I in Alzheimer's disease. J Neurochem. 1996; 66:2429-2435. [DOI] [PubMed] [Google Scholar]
- 37.Song H, Saito K, Seishima M, Noma A, Urakami K, Nakashima K. Cerebrospinal fluid apo E and apo A‐I concentrations in early‐ and late‐onset Alzheimer's disease. Neurosci Lett. 1997; 231:175-178. [DOI] [PubMed] [Google Scholar]
- 38.Balazs Z, Panzenboeck U, Hammer A, Sovic A, Quehenberger O, Malle E, Sattler W. Uptake and transport of high‐density lipoprotein (HDL) and HDL‐associated alpha‐tocopherol by an in vitro blood‐brain barrier model. J Neurochem. 2004; 89:939-950. [DOI] [PubMed] [Google Scholar]
- 39.Sovic A, Balazs Z, Hrzenjak A, Reicher H, Panzenboeck U, Malle E, Sattler W. Scavenger receptor class B, type I mediates uptake of lipoprotein‐associated phosphatidylcholine by primary porcine cerebrovascular endothelial cells. Neurosci Lett. 2004; 368:11-14. [DOI] [PubMed] [Google Scholar]
- 40.Zensi A, Begley D, Pontikis C, Legros C, Mihoreanu L, Wagner S, Buchel C, von Briesen H, Kreuter J. Albumin nanoparticles targeted with Apo E enter the CNS by transcytosis and are delivered to neurones. J Control Release. 2009; 137:78-86. [DOI] [PubMed] [Google Scholar]
- 41.Zensi A, Begley D, Pontikis C, Legros C, Mihoreanu L, Buchel C, Kreuter J. Human serum albumin nanoparticles modified with apolipoprotein A‐I cross the blood‐brain barrier and enter the rodent brain. J Drug Target. 2010; 18:842-848. [DOI] [PubMed] [Google Scholar]
- 42.Kingwell BA, Chapman MJ, Kontush A, Miller NE. HDL‐targeted therapies: progress, failures and future. Nat Rev Drug Discov. 2014; 13:445-464. [DOI] [PubMed] [Google Scholar]
- 43.Duvernoy HM, Risold PY. The circumventricular organs: an atlas of comparative anatomy and vascularization. Brain Res Rev. 2007; 56:119-147. [DOI] [PubMed] [Google Scholar]
- 44.Langlet F, Mullier A, Bouret SG, Prevot V, Dehouck B. Tanycyte‐like cells form a blood‐cerebrospinal fluid barrier in the circumventricular organs of the mouse brain. J Comp Neurol. 2013; 521:3389-3405. [DOI] [PMC free article] [PubMed] [Google Scholar]
- 45.Cavelier C, Rohrer L, von Eckardstein A. ATP‐binding cassette transporter A1 modulates apolipoprotein A‐I transcytosis through aortic endothelial cells. Circ Res. 2006; 99:1060-1066. [DOI] [PubMed] [Google Scholar]
- 46.Cavelier C, Ohnsorg PM, Rohrer L, von Eckardstein A. The beta‐chain of cell surface F(0)F(1) atpase modulates apoa‐I and HDL transcytosis through aortic endothelial cells. Arterioscler Thromb Vasc Biol. 2012; 32:131-139. [DOI] [PubMed] [Google Scholar]
- 47.Moestrup SK, Nielsen LB. The role of the kidney in lipid metabolism. Curr Opin Lipidol. 2005; 16:301-306. [DOI] [PubMed] [Google Scholar]
- 48.Assemat E, Chatelet F, Chandellier J, Commo F, Cases O, Verroust P, Kozyraki R. Overlapping expression patterns of the multiligand endocytic receptors cubilin and megalin in the CNS, sensory organs and developing epithelia of the rodent embryo. Gene Expr Patterns. 2005; 6:69-78. [DOI] [PubMed] [Google Scholar]
- 49.Carro E, Spuch C, Trejo JL, Antequera D, Torres‐Aleman I. Choroid plexus megalin is involved in neuroprotection by serum insulin‐like growth factor I. J Neurosci. 2005; 25:10884-10893. [DOI] [PMC free article] [PubMed] [Google Scholar]
- 50.Dietrich MO, Spuch C, Antequera D, Rodal I, de Yebenes JG, Molina JA, Bermejo F, Carro E. Megalin mediates the transport of leptin across the blood‐CSF barrier. Neurobiol Aging. 2008; 29:902-912. [DOI] [PubMed] [Google Scholar]
- 51.Zlokovic BV, Martel CL, Matsubara E, McComb JG, Zheng G, McCluskey RT, Frangione B, Ghiso J. Glycoprotein 330/megalin: probable role in receptor‐mediated transport of apolipoprotein J alone and in a complex with Alzheimer disease amyloid beta at the blood‐brain and blood‐cerebrospinal fluid barriers. Proc Natl Acad Sci USA. 1996; 93:4229-4234. [DOI] [PMC free article] [PubMed] [Google Scholar]
- 52.Rubin EM, Ishida BY, Clift SM, Krauss RM. Expression of human apolipoprotein A‐I in transgenic mice results in reduced plasma levels of murine apolipoprotein A‐I and the appearance of two new high density lipoprotein size subclasses. Proc Natl Acad Sci USA. 1991; 88:434-438. [DOI] [PMC free article] [PubMed] [Google Scholar]
- 53.Chiba H, Akita H, Hui SP, Takahashi Y, Nagasaka H, Fuda H, Kobayashi K. Effects of triamcinolone on brain and cerebrospinal fluid apolipoprotein E levels in rats. Life Sci. 1997; 60:1757-1761. [DOI] [PubMed] [Google Scholar]
- 54.Saito K, Seishima M, Heyes MP, Song H, Fujigaki S, Maeda S, Vickers JH, Noma A. Marked increases in concentrations of apolipoprotein in the cerebrospinal fluid of poliovirus‐infected macaques: relations between apolipoprotein concentrations and severity of brain injury. Biochem J. 1997; 321Pt 1:145-149. [DOI] [PMC free article] [PubMed] [Google Scholar]
- 55.Koch S, Donarski N, Goetze K, Kreckel M, Stuerenburg HJ, Buhmann C, Beisiegel U. Characterization of four lipoprotein classes in human cerebrospinal fluid. J Lipid Res. 2001; 42:1143-1151. [PubMed] [Google Scholar]
- 56.Pitas RE, Boyles JK, Lee SH, Hui D, Weisgraber KH. Lipoproteins and their receptors in the central nervous system. Characterization of the lipoproteins in cerebrospinal fluid and identification of apolipoprotein B, E(Ldl) receptors in the brain. J Biol Chem. 1987; 262:14352-14360. [PubMed] [Google Scholar]
- 57.Johanson CE, Duncan JA, III, Klinge PM, Brinker T, Stopa EG, Silverberg GD. Multiplicity of cerebrospinal fluid functions: new challenges in health and disease. Cerebrospinal Fluid Res. 2008; 5:10. [DOI] [PMC free article] [PubMed] [Google Scholar]
- 58.Perez‐Gracia E, Blanco R, Carmona M, Carro E, Ferrer I. Oxidative stress damage and oxidative stress responses in the choroid plexus in Alzheimer's disease. Acta Neuropathol. 2009; 118:497-504. [DOI] [PubMed] [Google Scholar]
- 59.Vargas T, Ugalde C, Spuch C, Antequera D, Moran MJ, Martin MA, Ferrer I, Bermejo‐Pareja F, Carro E. Abeta accumulation in choroid plexus is associated with mitochondrial‐induced apoptosis. Neurobiol Aging. 2010; 31:1569-1581. [DOI] [PubMed] [Google Scholar]