

Abstract
Background
Despite the accumulating genetic and molecular investigations into hypertrophic cardiomyopathy (HCM), it remains unclear how this condition develops and worsens pathologically and clinically in terms of the genetic–environmental interactions. Establishing a human disease model for HCM would help to elucidate these disease mechanisms; however, cardiomyocytes from patients are not easily obtained for basic research. Patient‐specific induced pluripotent stem cells (iPSCs) potentially hold much promise for deciphering the pathogenesis of HCM. The purpose of this study is to elucidate the interactions between genetic backgrounds and environmental factors involved in the disease progression of HCM.
Methods and Results
We generated iPSCs from 3 patients with HCM and 3 healthy control subjects, and cardiomyocytes were differentiated. The HCM pathological phenotypes were characterized based on morphological properties and high‐speed video imaging. The differences between control and HCM iPSC‐derived cardiomyocytes were mild under baseline conditions in pathological features. To identify candidate disease‐promoting environmental factors, the cardiomyocytes were stimulated by several cardiomyocyte hypertrophy‐promoting factors. Interestingly, endothelin‐1 strongly induced pathological phenotypes such as cardiomyocyte hypertrophy and intracellular myofibrillar disarray in the HCM iPSC‐derived cardiomyocytes. We then reproduced these phenotypes in neonatal cardiomyocytes from the heterozygous Mybpc3‐targeted knock in mice. High‐speed video imaging with motion vector prediction depicted physiological contractile dynamics in the iPSC‐derived cardiomyocytes, which revealed that self‐beating HCM iPSC‐derived single cardiomyocytes stimulated by endothelin‐1 showed variable contractile directions.
Conclusions
Interactions between the patient's genetic backgrounds and the environmental factor endothelin‐1 promote the HCM pathological phenotype and contractile variability in the HCM iPSC‐derived cardiomyocytes.
Keywords: disease modeling, ET‐1, HCM, iPS cells, MYBPC3
Introduction
Hypertrophic cardiomyopathy (HCM) is characterized by unexplained hypertrophy in the left ventricle, diastolic dysfunction, increased interstitial fibrosis, and myofibrillar disarray.1 HCM may lead to heart failure and sudden cardiac death.2 The discovery of genetic mutations in patients with HCM led to an increased understanding of the underlying pathophysiology.3 Because most of the genes associated with HCM encode components of the contractile apparatus of heart muscle, HCM was also termed a “disease of the sarcomere.” Subsequent investigations confirmed that mutations in genes encoding sarcomeric proteins cause HCM in humans and in genetically engineered mice.4 However, it remains unclear how HCM develops clinically among patients with a wide variety of genetic backgrounds and how environmental factors could affect disease phenotypes.5 A human disease model for HCM would be worthwhile to elucidate precise disease mechanisms. Moreover, better understandings of the mechanisms in HCM are needed to develop the required novel therapeutic strategies. Reprogramming of human somatic cells into induced pluripotent stem cells (iPSCs) potentially enables us to generate disease‐specific iPSCs for in vitro genetic disease models and pharmacological screening.6–7 In the past few years, many studies focusing on various types of human diseases, including cardiovascular arena, have yielded disease modeling by using patient‐specific iPSCs.8 The current study focused on elucidating a common pathway for progression of the HCM phenotype among patients with various genetic backgrounds by using HCM iPSC‐derived cardiomyocytes.
More than 1000 distinct mutations in sarcomeric genes have been associated with HCM,9 and the most frequent pathogenic mutations are found in MYH7 and in MYBPC3, encoding β‐myosin heavy chain and myosin binding protein C (cMyBP‐C), respectively.10 Mutations in sarcomeric proteins have been shown to increase myofilament calcium sensitivity and/or increase the energy requirements of myosin ATPase for efficient contractile dynamics in cardiomyocytes. Alterations in myocardial energetics and calcium handling combined with stimulation of signaling pathways might also diminish myocyte relaxation and promote myocyte growth, with resultant aberrations in tissue architecture.5 However, it remains unknown when and how HCM phenotypes develop in patients. Patients with mutations may show no or only subtle phenotypes at a young age but develop severe hypertrophied heart as an adult, suggesting that environmental factors could influence the timing and extent of the disease phenotype. Understanding such mechanistic interactions between patient's genetic backgrounds and environmental factors is clearly necessary to develop novel therapies for HCM.11
Pathogenic mutations remain elusive in 30% to 40% of even stringently investigated HCM patients, making it difficult to generate effective and inclusive disease models.3 However, patient‐specific iPSCs could potentially be used to model HCM even in the absence of known mutations, because such cells contain the necessary patient's genomic information. In this study, we chose 3 unrelated patients with HCM―1 patient with a mutation in MYBPC3, to identify a common pathway for disease manifestation. We demonstrated that HCM iPSC‐derived cardiomyocytes showed mild morphological phenotypes compared with the control under baseline conditions, but endothelin‐1 (ET‐1) induced pathological phenotypes such as cardiomyocyte hypertrophy and intracellular myofibrillar disorganization, namely myofibrillar disarray, in the HCM iPSC‐derived cardiomyocytes. Moreover, analysis of contractile dynamics in the isolated self‐beating iPSC‐derived cardiomyocytes by using high‐speed video imaging with motion vector prediction12 revealed variability in the direction of contraction among individual cardiomyocytes stimulated by ET‐1. Finally, endothelin receptor type A blocker (ETA‐b) clearly prevented the pathological features of HCM developing in the iPSC‐derived cardiomyocytes. Our results indicate that specific interactions between the patient's genetic backgrounds and the environmental factor, ET‐1, promoted the HCM phenotype in the iPSC‐derived cardiomyocytes.
Methods
Human iPSC Generation
We generated iPSCs from 3 unrelated HCM patients and 3 healthy volunteers, respectively. In HCM patient 1 and controls 1 and 2, iPSCs were generated from skin dermal fibroblasts.13 Six days after retrovirus transduction, fibroblasts were incubated with 0.05% trypsin/0.53 mmol/L EDTA (Gibco) and replated at 5×10⁴ cells per 10‐cm dish with mouse embryonic fibroblats (MEFs). Next day, the medium was replaced with human iPSC medium supplemented with 4 ng/mL bFGF. The medium was changed every day. Around 30 days after transduction, iPSC colonies were picked up. In addition, iPSCs of the other patients (HCM patients 2 and 3) and control 3 were established from T lymphocytes with Sendai virus encoding the same 4 factors.14–15 Briefly, activated peripheral blood mononuclear cells were collected and transferred at 1.5×10⁶ cells per well to a fresh anti‐CD3 antibody–coated 6‐well plate and incubated for an additional 24 hours. Then, the solution that contained Sendai virus vectors individually carrying each of OCT3/4, SOX2, KLF4, and c‐MYC were added at a multiplicity of infection of 10. After 24 hours of infection, the medium was changed to fresh GT‐T502 medium (KOHJIN BIO), and the cells were collected and split at 5×10⁴ cells into 10‐cm plates preseeded with MEFs. After an additional 24 hours, the medium was changed to human iPSC medium. Approximately 20 to 30 days after infection, iPSC colonies appeared and were picked up. These T‐cell–derived iPSCs were maintained by using the same techniques as for those derived from dermal fibroblasts. Isolation and use of patient and control fibroblasts were approved by the Ethical Committee of Keio University (20‐92‐5) and performed after written consent was obtained.
Cell Culture
Dermal fibroblasts from a healthy volunteer and a patient with HCM (case 1) obtained through a dermal biopsy were maintained in DMEM (Sigma) with 10% FBS (NICHIREI Biosciences Inc) and passaged twice. From a patient with HCM (case 2), peripheral blood mononuclear cells were separated via centrifugation of a heparinized whole blood sample, by using a Ficoll‐Paque PREMIUM (GE Healthcare) gradient. The mononuclear cells were seeded onto the anti‐human CD3 antibody (BD Pharmingen)‐coated 6‐well plates in 2 mL GT‐T502 medium (KOHJIN BIO) per well and incubated for 5 to 7 days until the activated T cells reached 80% to 90% confluency. Human iPSCs were maintained on irradiated MEF feeder cells in human iPSC culture medium: 80% DMEM/F12 (Sigma), 20% KO Serum Replacement (Invitrogen), 4 ng/mL basic fibroblast growth factor (bFGF; WAKO), 2 mmol/L l‐glutamine (Invitrogen), 0.1 mmol/L nonessential amino acids (Sigma), 0.1 mmol/L 2‐mercaptoethanol, 50 U/mL penicillin, and 50 mg/mL streptomycin (Invitrogen). The medium was changed every 2 days, and the cells were passaged by using 1 mg/mL collagenase IV (Invitrogen) every 5 to 7 days.
Virus Preparation (Lentivirus, Retrovirus, and Sendai Virus)
Lentiviruses were generated by cotransfecting the pLenti6/UbC encoding the mouse Slc7a1 together with the Virapower packaging mix (pLP1, pLP2, and pLP/VSVG mixture) by Lipofectamine 2000 (Invitrogen), according to the manufacturer's instructions, into 293FT cells seeded at 4×10⁶ cells per 10‐cm dish. Lentiviruses were collected 36 hours after transfection and filtrated through a 0.45‐μm‐pore cellulose acetate filter. The virus‐containing supernatant supplemented with 4 μg/mL polybrene (Wako) was added to the human fibroblasts seeded at 8×10⁵ cells per 10‐cm dishes and incubated for 24 hours at 37°C, 5% CO2. The pMXs retroviral vectors contained the 5′‐long terminal repeat (LTR) and 3′‐LTR of Moloney murine leukemia virus, encoded human OCT3/4, SOX2, KLF4, and c‐MYC genes, and the green fluorescence protein to monitor transfection efficacy. PLAT‐E packaging cells, which were derived from 293T cells and contain env‐IRES‐puro and gag‐pol‐IRES‐bs cassettes driven by the EF1‐α promoter (Cell biolabs, Inc.), were plated at 3.6×10⁶ cells per 10‐cm dish and incubated overnight. Next day, the cells were transfected with pMXs vectors with Fugene 6 transfection reagent (Roche). Forty‐eight hours after transfection, the medium was collected, and the virus‐containing supernatants were filtered through a 0.45‐μm‐pore filter and supplemented with 4 μg/mL polybrene (Wako). Equal parts of supernatants containing the 4 retroviruses were mixed, transferred to the fibroblasts expressing mouse Slc7a1 gene seeded at 8×10⁵ cells per 10‐cm dish, and incubated overnight. Sendai virus vectors, carrying the same 4 specific transcriptional factors independently, were commercially obtained (CytoTune‐iPS Reprogramming Kit; Invitrogen).
Teratoma Formation
To confirm pluripotency in vivo, teratoma formation was assessed in accordance with the Institutional Animal Care and Use Committee of Keio University. Approximately 1 to 2×10⁶ iPSCs were injected into the testis of anesthetized immunocompromised NOD‐SCID mice (CREA‐Japan). Ten to 12 weeks after injection, the mice were euthanized, and teratomas were excised, fixed overnight in formalin, embedded in paraffin, and analyzed by using hematoxylin–eosin staining. The mice were anesthetized by using a mixture of ketamine (50 mg/kg), xylazine (10 mg/kg), and chlorpromazine (1.25 mg/kg). The adequacy of anaesthesia was monitored by heart rate, muscle relaxation, and loss of sensory reflex response (ie, nonresponse to tail pinching). The investigation conforms with the “Guide for the Care and Use of Laboratory Animals” published by the US National Institutes of Health (NIH Publication No. 85‐23, revised 1996).
Genetic Analyses
DNA samples extracted from the peripheral blood of subjects were used as templates to amplify each coding exon of MYBPC3, MYL2, MYL3, TNNT2, TNNI3, TPM1, and ACTC and exons 3 to 25 of MYH7 by using polymerase chain reaction (PCR). Sequences of primers and the PCR conditions used in this study are available on request. PCR products were analyzed for sequence variations through direct DNA sequencing of both strands by using Big Dye Terminator chemistry (version 3.1) and ABI3100 DNA Analyzer (Applied Biosystems). The sequence variations found in the patients were considered to be mutations on the basis of following criteria: (1) presence in all tested affected members of the family of each proband patient, (2) absence from 400 unrelated chromosomes of the control subjects, (3) absence from a public database of polymorphism, dbSNP database (http://www.ncbinlm.nih.gov/projects/SNP/), (4) mutations at the evolutionary conserved residues, and/or (5) identification as an HCM‐causing mutation in previous reports. All subjects received informed consent for blood testing for genetic abnormalities associated with hereditary HCM.
In Vitro Cardiomyocyte Differentiation and Isolation
For embryoid body (EB)‐formed differentiation, iPSCs colonized on MEFs were detached by using 1 mg/mL type IV collagenase (Invitrogen) and suspended on ultra‐low attachment plates (Corning) with differentiation medium, consisting of 80% Minimum Essential Medium Alpha Medium (Gibco), 2 mmol/L l‐glutamine (Invitrogen), 0.1 mmol/L nonessential amino acids (Sigma), 0.1 mmol/L 2‐mercaptoethanol, 50 U/mL penicillin–50 mg/mL streptomycin (Invitrogen), and 20% FBS (Gibco) to initiate cardiac differentiation. During suspension culture, the medium was changed every 2 days in the first week and then every week with the differentiation medium with 5% FBS. After 20 to 30 days of differentiation, self‐contracting EBs were picked up and replaced in the other ultra‐low attachment plates (Corning). For immunohistochemical and physiological motion analyses, the singled cardiomyocytes isolated from spontaneously contracting EBs by using 0.25% trypsin (Invitrogen), 1 mg/mL type IV collagenase (Invitrogen), and ADS buffer (NaCl 116 mmol/L, KCl 5.4 mmol/L, NaH2PO4 1mmol/L, MgSO4 0.8 mmol/L, Glucose 5.5 mmol/L, HEPES 20 mmol/L, pH 7.35 adjusted by NaOH) for 30 minutes at 37°C were plated onto fibronectin‐coated dishes and incubated for 1 week with or without the pharmacological agents (eg, ET‐1) in the presence of 20% FBS. To analyze the iPSC‐derived cardiomyocyte, the mixtures of contracting EBs derived from 1 to 3 independent iPSC lines were used in each case.
Isolation of Neonatal Mouse Cardiomyocytes
Neonatal mouse cardiomyocytes were isolated and cultured following a well‐established protocol,16 according to the “Guide for the Care and Use of Laboratory Animals.” After 3 days of culture, serum was reduced to 0.2% for 12 hours before stimulation with 100 nmol/L ET‐1 for an additional 48 hours. Cells were then harvested for RNA analysis or fixed for immunofluorescence staining.
Immunofluorescence Microscopy
Undifferentiated iPSCs plated on coverslips with MEFs or differentiated cardiomyocytes plated onto fibronectin‐coated dishes were washed once with D‐PBS(–) (Wako) and fixed with 4% Paraformaldehyde Fixative (MUTO Pure Chemicals) at 4°C for 30 minutes. After fixation, cells were treated with 0.4% Triton X‐100 (when targeted intracellular labeling) in PBS for 15 minutes at room temperature. After being blocked with ImmunoBlock (DS Pharma Biomedical) for 5 minutes 3 times, cells were incubated at 4°C overnight with the primary antibody, followed by washing with the blocking medium and incubation at room temperature for 60 minutes with the corresponding secondary antibody. Nuclei were stained with 50 ng/mL DAPI (Invitrogen) for 5 minutes at room temperature. Fluorescent signals were detected by the use of fluorescence laser microscope (BZ‐9000, Keyence) equipped with a 1.5×105 pixel charged coupled device camera. Neonatal mouse cardiomyocytes were plated onto laminin‐coated coverslips and washed twice with PBS before fixation in methanol:acetone (20:80) for 10 minutes at −20°C. Cells were permeabilized 1 hour at room temperature with 0.5% Triton X‐100, 1% BSA, and 10% FCS in PBS. After washing with 0.5% Triton X‐100 and 1% BSA in PBS, neonatal mouse cardiomyocytes were incubated for 3 hours at room temperature with primary antibodies diluted in the same solution. Cells were then rinsed twice (0.5% Triton X‐100, 1% BSA in PBS) and incubated for 1 hour at room temperature in the dark with secondary antibodies diluted in the same dilution. At the same time, nuclei were stained with 5 μmol/L DRAQ5 (Biostatus). After 3 washes in PBS, cells were mounted with Mowiol, and fluorescence was analyzed by confocal microscopy by using a Zeiss Axiovert microscope with a ×40 oil objective.
Electron Microscopy
Contracting EBs were fixed with 2.5% glutaraldehyde in 60 mmol/L HEPES, pH 7.4, for 2 hours at room temperature and washed 3 times with 0.2 mol/L phosphate buffer. Secondary fixation were performed with 1% OsO4 in 60 mmol/L HEPES, pH 7.4, for 120 minutes at room temperature. For en bloc stain, 2% uranyl acetate was used for 30 minutes at room temperature. Tissues were dehydrated with gradually increasing concentration of ethanol and embedded by plain resin, before sectioning and staining.
Quantitative Reverse Transcription–PCR
For quantitative reverse transcription (RT)–polymerase chain reaction (PCR) assays, total RNA was extracted from 30 days beating EBs by using TriZOL Reagent (Invitrogen) and TURBO DNA‐free kit (Ambion), according to the manufacturers' instructions. One microgram of total RNA was reverse transcribed into cDNA by using the SuperScript II Reverse Transcriptase (Invitrogen). Quantitative RT‐PCR for endothelin receptor type A (EDNRA) and B (EDNRB) was performed by using TaqMan Gene Expression Assays (EDNRA; Hs03988672_m1, EDNRB; Hs00240747_m1) and TaqMan Universal PCR Master Mix (Applied Biosystems). Quantitative RT‐PCR for TNNT2 was performed by using Perfect Real Time SYBR Premix Ex Taq II kit (Takara) with the primer set TTCACCAAAGATCTGCTCCTCGCT and TTATTACTGGTGTGGAGTGGGTGTGG. Samples were cycled 40 times by using a 7500 Real Time PCR System (Applied Biosystems), and cycle conditions were as follows: 2 minutes at 50°C, 10 minutes at 95°C, followed by 40 cycles of 15 seconds at 95°C and 60 seconds at 60°C. Cycle threshold was calculated under default settings by using real‐time sequence detection software (Applied Biosystems). The expression levels of EDNRA and EDNRB were normalized to that of TNNT2.
Quantification of Gene Expression in Mice
For RT and quantitative PCR, ReverTraAce qPCR RTMaster Mix with gDNA Remover (TOYOBO) and THUNDERBIRD SYBR qPCR Mix (TOYOBO) were used according to manufacturers' instructions. Primer sequences of the targeted genes are as follows: α‐skeletal actin (Acta1) forward: CCCCTGAGGAGCACCCGACT, reverse: CGTTGTGGGTGACACCGTCCC; atrial natriuretic peptide (ANP) (Nppa) forward: TCGTCTTGGCCTTTTGGCT, reverse: TCCAGGTGGTCTAGCAGGTTCT; B‐type natriuretic peptide (Nppb) forward: AAGTCCTAGCCAGTCTCCAGA, reverse: GAGCTGTCTCTGGGCCATTTC; guanine nucleotide binding protein, alpha stimulating (Gnas) F: CAAGGCTCTGTGGGAGGAT, reverse: CGAAGCAGGTCCTGGTCACT. Samples were cycled 40 times by using a 7500 Real Time PCR System (Applied Biosystems) and cycle conditions were as follows: 60 seconds at 95°C followed by 40 cycles of 15 seconds at 95°C and 35 seconds at 60°C. Cycle threshold was calculated under the default settings by real‐time sequence detection software (Applied Biosystems). The expression levels of Acta1, Nppa, and Nppb were normalized to that of Gnas.
iPSC‐Derived Cardiomyocyte Size Measurement
On 30, 60, or 90 days after differentiation, the single cardiomyocytes were isolated from contracting EBs and immunolabeled for anti‐cardiac troponin T with Alexa Fluor 594 goat anti‐mouse IgG1 as described earlier, and the surface areas of the single cardiomyocytes derived from HCM patients' and healthy volunteers' iPSCs were measured by using computerized morphometric system (ImageJ software, NIH).
Western Blot Analysis
Proteins from self‐beating EBs were extracted with RIPA buffer (Nacalai tesque). The proteins were loaded on the Mini‐PROTEAN TGX Gels (Bio‐Rad, 4% to 15%) and then electrically separated and transferred onto 0.45‐μm‐pore size nitrocellulose blotting membranes (GE Healthcare). The membranes were stained with antibodies directed against cMyBP‐C (1:100; Santa Cruz), cardiac troponin T (cTnT) (1:200; Santa Cruz), α‐actinin (1:2500; Sigma), ANP (1:200; Santa Cruz), or GAPDH (1:500; Cell Signaling) overnight at 4°C. After being washed in TBS buffer containing 0.1% Tween 20, the membranes were incubated with appropriate horseradish peroxidase–conjugated secondary antibodies (anti‐mouse HRP 1:2000, anti‐rabbit HRP 1:2000, or anti‐goat HRP 1:2000, respectively) for 1 hour at room temperature. The immunoreactive bands were visualized by Chemi‐Lumi One L (Nacalai tesque) and subsequently detected by the Image Reader LAS‐3000 (FUJIFILM). Quantification of the signals was conducted by using the NIH ImageJ software.
Reagents
Immunofluorescence staining for pluripotency of iPSCs was performed by using the following primary antibodies: anti‐NANOG (Abcam), anti‐OCT3/4 (Santa Cruz), anti–SSEA 3 (Millipore), anti–SSEA 4 (Millipore), anti–Tra‐1‐60 (Millipore), and anti–Tra‐1‐81 (Millipore). In immunofluorescence staining for cardiac markers, monoclonal anti–α‐actinin (Sigma), monoclonal anti‐cTnT (Thermo Scientific), polyclonal anti‐cTnT (Santa Cruz), monoclonal anti–myosin light chain (MLC)2a (Synaptic Systems), polyclonal anti‐MLC2v (ProteinTech Group), anti‐ANP (Santa Cruz), anti–cMyBP‐C (Santa Cruz), polyclonal anti–cMyBP‐C motif (supplied by C. Witt University of Heidelberg, Heidelberg, Germany), and anti–nuclear factor of activated T cells (NFAT)c4 (Santa Cruz) were used. The isotype‐specific secondary antibodies, Alexa Fluor 488 chicken anti‐rabbit IgG, Alexa Fluor 594 goat anti‐mouse IgG1, Alexa Fluor 488 goat anti‐rat IgM, Alexa Fluor 594 goat anti‐mouse IgM, Alexa Fluor 488 goat anti‐mouse IgG, Alexa Fluor 594 goat anti‐mouse IgG2b, Alexa Fluor 594 chicken anti‐goat IgG, and Alexa Fluor 555 goat anti‐rabbit IgG, were all obtained from Invitrogen. The tested drugs included endothelin‐1 (1.0, 10, 100, or 1000 nmol/L), angiotensin II (100 nmol/L), insulin‐like growth factor 1 (100 nmol/L), phenylephrine (0.05 mmol/L), BQ‐123 (250 nmol/L), and BQ‐788 (100 nmol/L) (all from Sigma).
High‐Speed Video Microscopy
Isolated cardiomyocytes were cultured in a well of 24‐well plate and incubated with 500 μL of culture medium. A high‐speed digital CMOS camera (KP‐FM400WCL; Hitachi Kokusai Electric) was mounted on an inverted microscope (Eclipse TE2000; Nikon), which was equipped with a xy scanning stage (Bios‐T; Sigma Koki). The microscope was also equipped with a stage‐top mini‐incubator (WSKM; Tokai Hit), which maintained the temperature of the culture plate at 37°C, 5% CO2. Videos of cardiomyocytes maintained in DMEM were recorded as sequential phase‐contrast images with a ×10 or ×20 objective at a frame rate of 150 fps, a resolution of 512×512 pixels, and a depth of 8 bits.
Evaluation of Contraction Direction With Motion Vector Prediction Algorithm
The contraction and relaxation motion of cardiomyocytes were evaluated from the high‐speed video imaging by using the motion vector prediction method.12 Briefly, each frame was divided into square blocks of N×N pixels. Then, for a maximum motion displacement of w pixels per frame, the current block of pixels was matched to the corresponding block at the same coordinates in the previous frame within a square window of width N+2w. (Optimal values of N and w for the cardiac motion detection may vary with the observation magnification and resolution of the camera. Here, we set N=16 and w=4. These values were determined empirically based on the throughput speed of calculation and accuracy of the block‐matching detection.) The best match on the basis of a matching criterion yielded the displacement. The mean absolute error was used as the matching criterion. The matching function is given by
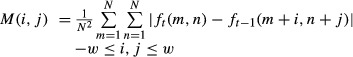 |
where ft (m, n) represents the intensity at coordinates (m, n) in the current block of N×N pixels and ft‐1 (m+i, n+j) represents the intensity at new coordinates (m+i, n+j) in the corresponding block in the previous frame. We performed this calculation for every 4×4 pixels in the image and obtained the motion vectors of cardiomyocyte motion. Because the contraction and relaxation of cardiomyocytes occur nearly symmetrical direction, the vector angle histogram tends to show 2 peaks with 180° interval. By summing up the histogram at the center of the peaks, we averaged the histogram for calculation of standard deviation (SD) score, as illustrated later in Figure 16. Thus, vector angles (between each vector and x‐axis [horizontal‐axis]) were evaluated during the contraction and relaxation process and were summarized in the vector angle histograms (see Figure 17).
Figure 16.
Schema of motion vector analysis for single beating cardiomyocytes. A, Normal cardiomyocytes, beating synchronously in 1 direction, show symmetrical twin peaks under 360° analyses. The summation data indicates a single peak with lower SD scores. B, Cardiomyocytes with myofibrillar disarray, beating nonsynchronously, show ≥2 morphologically irregular peaks under 360° analyses. The summation data indicate flattened peak with higher SD score (double‐headed red arrow).
Figure 17.

Motion vector analysis of single beating cardiomyocytes derived from control and HCM iPSCs. A, The iPSC‐derived single cardiomyocytes at 60 days, which were cultured for 24 hours, were stimulated for 48 hours with or without ET‐1 and/or each endothelin receptor blocker. Phase contrast image (PC) showed the single beating cardiomyocytes obtained in this system. Vectors showed traced motion vectors overlaid in the cardiomyocyte image in PC. A histogram showed the frequency of the motion vector angles (angles between each vector and x‐axis [horizontal axis] in the image) in a single cardiomyocyte. The histograms and SD scores were calculated at 0, 24, and 48 hours after stimulation. B, The SD scores of the vector angle histograms in control and HCM iPSC‐derived beating cardiomyocytes before ET‐1 stimulation (0 hour). N=30 (control) or 90 (HCM). C, The SD scores of the vector angle histograms after 24‐hour stimulation. N=21 to 24 (control) or 79 to 87 (HCM). D, The SD scores of the vector angle histograms after 48‐hour stimulation. The SD scores of HCM iPSC‐derived cardiomyocytes with ETA‐b were significantly reduced, compared with those of ET‐1. N=27 to 28 (control) or 67 to 73 (HCM). *P<0.05, **P<0.01 vs as indicated on the figure (Student t test). ET‐1 indicates endothelin‐1; ETA‐b, endothelin receptor type A blocker; ETB‐b, endothelin receptor type B blocker; HCM, hypertrophic cardiomyopathy; iPSCs, induced pluripotent stem cells.
Statistical Analysis
This study was designed to address the differences in the environmental factor–induced pathological responsiveness between control and HCM iPSC‐derived cardiomyocytes and to determine the key environmental factors involved in the pathological mechanisms in HCM. Continuous data were presented as mean±SEM. The differences of the continuous data in 2 groups were evaluated by using the Mann–Whitney U test or Student t test. One‐way ANOVA with Steel's multiple comparison post‐test or Kruskal–Wallis test was used for >2 groups where appropriate. Categorical data were compared by using the χ2 test. “Control” and “HCM” depicted in the graphs represent the total results including control 1, 2, and 3 or HCM 1, 2, and 3, respectively. Sample size and analysis methods used in each experiment are described in each figure legend. Detailed parameters of the cell surface area and the prevalence of myofibrillar disarray are listed in Table. All analyses were conducted by using JMP 10 (SAS Institute Japan), and a value of P<0.05 was defined as statistically significant.
Table 1.
Detailed Parameters of the Cell Surface Area and the Prevalence of Myofibrillar Disarray
| Control | HCM | |||
|---|---|---|---|---|
| Cell Area | Myofibrillar Disarray | Cell Area | Myofibrillar Disarray | |
| Figures 5C and 6D | ||||
| Day 30 | N=798 (sample size) |
6.5% (prevalence) 55/851 (number of cardiomyocytes) |
N=823 | 8.9% 84/947 |
| 93 133 (mean) |
109 933 | |||
| 81 510 (median) |
97 480 | |||
| 61 200 to 109 930 (interquartile range) |
69 245 to 132 820 | |||
| Day 60 | N=811 | 5.6% 49/875 |
N=816 | 9.2% 92/995 |
| 92 636 | 112 592 | |||
| 80 160 | 94 060 | |||
| 58 760 to 110 940 | 68 560 to 140 740 | |||
| Day 90 | N=810 | 5.0% 47/932 |
N=821 | 9.3% 83/895 |
| 91 319 | 113 097 | |||
| 79 760 | 96 880 | |||
| 61 140 to 107 120 | 67 230 to 13 0740 | |||
| Figure 9B through E | ||||
| Free (day 60) |
N=811 | 5.6% 49/875 |
N=816 | 9.2% 92/995 |
| 92 636 | 112 592 | |||
| 80 160 | 94 060 | |||
| 58 760 to 110 940 | 68 560 to 140 740 | |||
| ET‐1 | N=789 | 6.2% 59/955 |
N=809 | 20.6% 197/956 |
| 102 499 | 135 038 | |||
| 89 080 | 116 280 | |||
| 68 200 to 119 120 | 85 120 to 165 690 | |||
| Ang II | N=811 | 5.8% 51/883 |
N=788 | 9.2% 80/865 |
| 94 848 | 121 538 | |||
| 83 560 | 102 360 | |||
| 61 400 to 117 220 | 77 100 to 144 250 | |||
| IGF‐1 | N=817 | 6.4% 58/903 |
N=810 | 10.1% 85/844 |
| 97 786 | 120 339 | |||
| 85 800 | 103 880 | |||
| 65 600 to 113 480 | 77 160 to 140 470 | |||
| PE | N=819 | 6.4% 56/870 |
N=819 | 10.3% 88/857 |
| 99 371 | 120 147 | |||
| 88 080 | 101 657 | |||
| 66 900 to 118 200 | 70 160 to 143 130 | |||
| Figure 12A and 12B | ||||
| ET‐1, 0 nmol/L (day 60) |
N=811 | 5.6% 49/875 |
N=816 | 9.2% 92/995 |
| 92 636 | 112 592 | |||
| 80 160 | 94 060 | |||
| 58 760 to 110 940 | 68 560 to 140 740 | |||
| ET‐1, 1.0 nmol/L | N=822 | 5.7% 51/889 |
N=818 | 13.8% 121/878 |
| 94 228 | 122 839 | |||
| 81 460 | 105 798 | |||
| 61 920 to 112 045 | 72 355 to 154 155 | |||
| ET‐1, 10 nmol/L | N=811 | 5.9% 52/878 |
N=822 | 16.7% 152/908 |
| 98 535 | 127 885 | |||
| 86 680 | 106 940 | |||
| 64 920 to 118 350 | 77 380 to 152 398 | |||
| ET‐1, 100 nmol/L | N=789 | 6.2% 59/955 |
N=809 | 20.6% 197/956 |
| 102 499 | 135 038 | |||
| 89 080 | 116 280 | |||
| 68 200 to 119 120 | 85 120 to 165 690 | |||
| ET‐1, 1000 nmol/L | N=810 | 6.4% 58/907 |
N=819 | 22.9% 204/892 |
| 105 608 | 142 510 | |||
| 94 040 | 122 040 | |||
| 71 857 to 125 420 | 87 160 to 163 720 | |||
| Figure 13B and 13C (graphs of control not shown) | ||||
| Free (day 60) |
N=811 | 5.6% 49/875 |
N=816 | 9.2% 92/995 |
| 92 636 | 112 592 | |||
| 80 160 | 94 060 | |||
| 58 760 to 110 940 | 68 560 to 140 740 | |||
| ET‐1 | N=789 | 6.2% 59/955 |
N=809 | 20.6% 197/956 |
| 102 499 | 135 038 | |||
| 89 080 | 116 280 | |||
| 68 200 to 119 120 | 85 120 to 165 690 | |||
| ET‐1+ETA‐b | N=806 | 5.1% 47/916 |
N=817 | 10.4% 94/902 |
| 91 901 | 116 527 | |||
| 81 640 | 103 280 | |||
| 63 515 to 108 460 | 73 200 to 140 880 | |||
| ET‐1+ETB‐b | N=809 | 5.0% 43/866 |
N=821 | 17.3% 152/880 |
| 98 786 | 132 030 | |||
| 88 360 | 116 000 | |||
| 66 880 to 116 400 | 81 010 to 159 690 | |||
| ET‐1+ETA‐b+ETB‐b | N=808 | 5.5% 50/907 |
N=825 | 10.7% 98/917 |
| 93 311 | 117 891 | |||
| 83 300 | 100 800 | |||
| 63 538 to 110 918 | 75 440 to 142 080 | |||
| ETA‐b+ETB‐b | N=814 | 5.6% 52/927 |
N=823 | 9.5% 87/913 |
| 92 227 | 110 616 | |||
| 81 740 | 94 650 | |||
| 62 760 to 108 855 | 65 360 to 138 800 | |||
| Figure 14C and 14D (experiments in control not performed) | ||||
| Free–free | N=300 | 13.9% 44/317 |
||
| 137 988 | ||||
| 121 350 | ||||
| 89 755 to 159 190 | ||||
| Free–ET‐1 | N=300 | 26.7% 92/344 |
||
| 172 995 | ||||
| 160 570 | ||||
| 117 113 to 212 515 | ||||
| ET‐1–free | N=300 | 34.9% 126/361 |
||
| 188 432 | ||||
| 158 215 | ||||
| 121 758 to 220 150 | ||||
| ET‐1–ETA‐b | N=300 | 20.8% 69/332 |
||
| 142 950 | ||||
| 128 160 | ||||
| 96 530 to 174 118 | ||||
| Figure 15C and 15D | WT | HET | ||
| Control | N=176 | 4.7% 10/215 |
N=173 | 8.1% 18/223 |
| 40 517 | 44 712 | |||
| 38 073 | 45 126 | |||
| 29 234 to 49 326 | 31 353 to 55 272 | |||
| ET‐1 | N=174 | 5.1% 12/236 |
N=178 | 15.5% 36/233 |
| 52 694 | 57 824 | |||
| 47 285 | 55 712 | |||
| 35 484 to 68 430 | 43 746 to 69 539 | |||
HCM indicates hypertrophic cardiomyopathy; ET‐1, endothelin‐1; Ang II, angiotensin II; IGF‐1, insulin‐like growth factor‐1; PE, phenylephrine; ETA‐b, endothelin receptor type A blocker; ETB‐b, endothelin receptor type B blocker; HET, heterozygous Mybpc3‐targeted knock‐in mice; WT, wild‐type.
Results
Generation of HCM iPSC‐Derived Cardiomyocytes
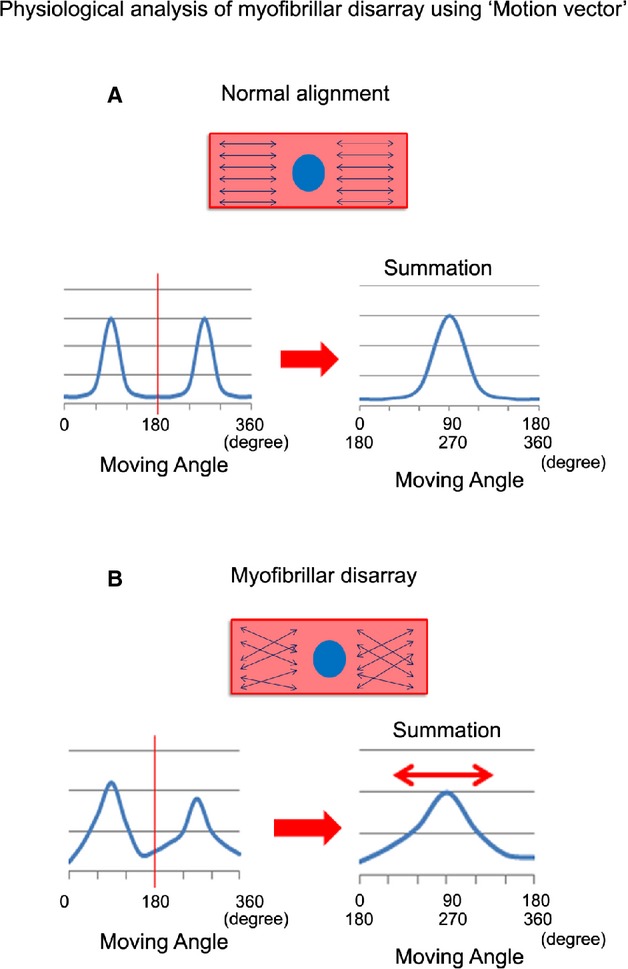
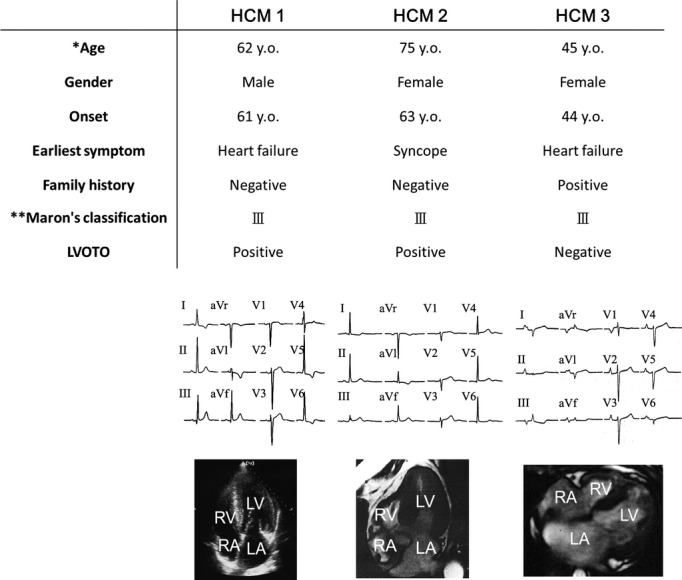
We selected 3 unrelated patients with HCM (Figure 1). Among them, 2 showed typical clinical manifestation without family history (HCM patients 1 and 2), without mutations in the sarcomeric genes related to HCM,9 such as MYH7, MYBPC3, TNNT2, TNNI3, MYL2, MYL3, and ACTC1. We also chose a third patient who showed typical clinical manifestation of HCM with family history and with a mutation in MYBPC3 (Gly999‐Gln1004del; HCM 3). As controls, we recruited 1 independent healthy volunteer and used 2 other, previously characterized, control iPSC lines (controls 2 and 3).17–18 In HCM patient 1 and controls 1 and 2, iPSCs were generated from skin dermal fibroblasts with retrovirus carrying each of OCT3/4, SOX2, KLF4, and c‐MYC.6 iPSCs of the other patients (HCM 2 and 3) and control 3 were established from T lymphocytes of peripheral blood with Sendai virus carrying the same transcriptional factors.14,17 Generated iPSCs showed appropriate stem cell marker expression (Figure 2A) as well as multipotency based on teratoma formation containing tissues derived from all 3 germ layers (Figure 2B). Subsequently, cardiomyocytes were differentiated from the iPSCs by EB formation. Immunostaining revealed that the iPSC‐derived cardiomyocytes expressed cardiomyocyte‐specific markers α‐actinin, MLC2a, MLC2v, cTnT, and ANP (Figure 3A through 3C).
Figure 1.
Patients' clinical characteristics. Detailed clinical informations, electrocardiogram, and 4‐chamber images of echocardiogram or cardiac magnetic resonance imaging of each patient with HCM. *The age when the one's iPSCs were established. **Maron's classification.19 HCM indicates hypertrophic cardiomyopathy; iPSCs, induced pluripotent stem cells; LA, left atrium; LV, left ventricle; LVOTO, left ventricular outflow tract obstruction; RA, right atrium; RV, right ventricle.
Figure 2.
iPSC generation from control and patients with HCM. A, Immunostaining for human pluripotent stem cell markers, Nanog, OCT 3/4, SSEA 3, SSEA 4, TRA‐1‐60, and TRA‐1‐81. B, Teratoma formation from control 1 , HCM 1 , HCM 2, and HCM3 iPSCs in the immunocompromised NOD‐SCID mice. Sections of teratomas were stained with hematoxylin–eosin, and tissues representative of all 3 germ layers were observed. HCM indicates hypertrophic cardiomyopathy; iPSCs, induced pluripotent stem cells.
Figure 3.

Cardiomyocyte generation from control and HCM iPSCs. The single cardiomyocytes at 60 days after differentiation were cultured for 7 days under adherent culture conditions. A, Immunostaining for α‐actinin and MLC2a with DAPI nuclear staining in the single cardiomyocytes derived from each iPSC. B, Immunostaining for MLC2v and cTnT with DAPI nuclear staining in the single cardiomyocytes derived from each iPSCs. C, Immunostaining for α‐actinin and ANP with DAPI nuclear staining in the single cardiomyocytes derived from each iPSC. ANP indicates atrial natriuretic peptide; cTnT, cardiac troponin T; DAPI, 4′,6‐diamidino‐2‐phenylindole; HCM, hypertrophic cardiomyopathy; iPSCs, induced pluripotent stem cells; MLC2a, myosin light chain 2a; MLC2v, myosin light chain 2v.
Pathological Features of HCM iPSC‐Derived Cardiomyocytes
Cardiomyocyte hypertrophy is a well‐known pathological characteristic of HCM.9 To reveal the size and shape of iPSC‐derived cardiomyocytes, we dissociated them from EBs (30, 60, and 90 days after differentiation) and cultured them under adherent culture conditions for 7 days (Figure 4). We then measured cell surface area after immunostaining for cTnT and α‐actinin (Figure 5A and 5B). Although there were no time‐dependent changes in the cell surface area, the HCM iPSC‐derived cardiomyocyte surface areas were mildly but significantly larger at each time point (Figure 5C). To further investigate the fine cellular organization, the beating EBs were examined at day 60 by using electron microscopy. Well‐organized striated myofibrils were observed in beating EBs derived from control and HCM iPSCs (Figure 6A), but frequent myofibrillar disarrays were found in the HCM iPSC‐derived cardiomyocytes (Figure 6B). In HCM hearts, cardiomyocytes often show this type of morphological disorganization, which is related to the cardiomyocyte pathophysiology in HCM,20–22 and it is consequently used as a marker of the disease in this study. Immunostaining of the iPSC‐derived cardiomyocytes for cTnT also could highlight the myofibrillar disarray (Figure 6C). To quantitatively evaluate the frequency of this morphological characteristic, we defined the cardiomyocyte with myofibrillar disarray as >50% of myofibrillar intersected each other within the single cardiomyocyte (Figure 7). There was no significant difference at 30 days between control and HCM iPSC‐derived cardiomyocytes, but HCM iPSC‐derived cardiomyocytes showed a higher prevalence of myofibrillar disarray than the control iPSC‐derived cardiomyocytes at days 60 and 90 (Figure 6D). The α‐actinin protein content did not differ between control and HCM iPSC‐derived cardiomyocytes, whereas cTnT and ANP protein levels were higher in the HCM iPSC‐derived cardiomyocytes (Figure 8A through 8D). cMyBP‐C protein level was lower in the HCM3‐iPSC‐derived cardiomyocytes (Figure 8E and 8F), suggesting cMyBP‐C haploinsufficiency as observed in septal myectomy of HCM patients.23–24
Figure 4.
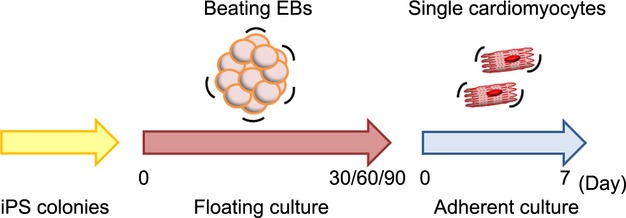
Time course of drug stimulation protocols for beating single cardiomyocytes. EBs were formed under floating culture conditions at day 0 and then maintained until 30, 60, or 90 days. The floating EBs were then enzymatically dissociated and single cardiomyocytes were cultured under adherent conditions for 7 days. EBs indicates embryoid bodies; iPS, induced pluripotent stem.
Figure 5.
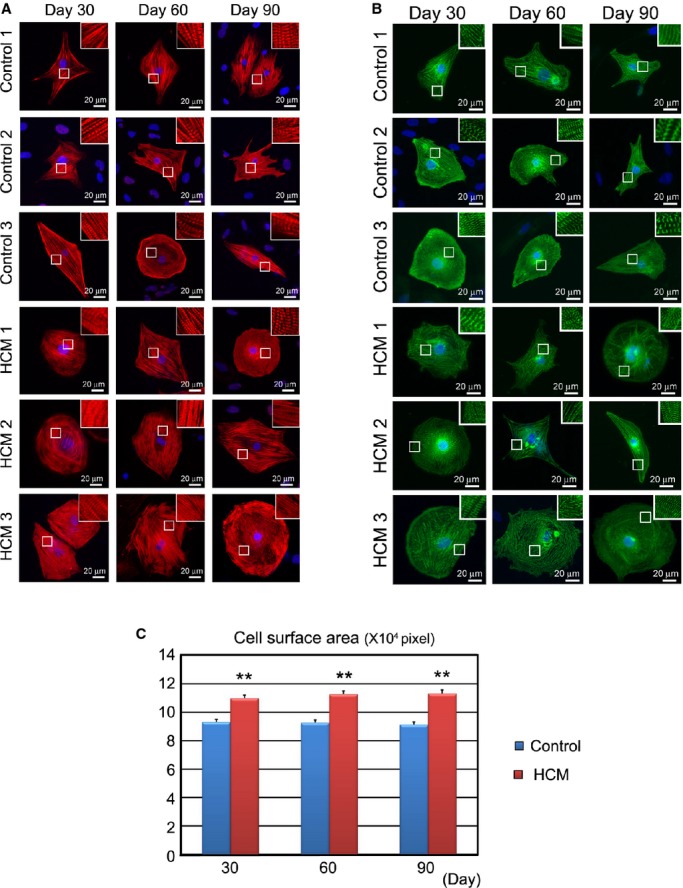
In vitro pathological findings: cell surface area in the isolated iPSC‐derived cardiomyocytes. Embryoid bodies (EBs) were maintained for 30, 60, or 90 days in floating culture. After dissociation, cardiomyocytes were cultured 7 days under adherent culture conditions. A, Immunostaining for cardiac troponin T (cTnT) with DAPI nuclear staining in the single cardiomyocytes derived from each control and HCM iPSCs. B, Immunostaining for α‐actinin with DAPI nuclear staining in the single cardiomyocytes derived from each control and HCM iPSCs. C, Cell surface areas of 798 to 823 randomly chosen cTnT‐positive cardiomyocytes from each control (1 to 3) and HCM (1 to 3) group were measured at each time point. **P<0.01 vs control in the same time point (repeated‐measures ANOVA and Mann–Whitney U test).HCM indicates hypertrophic cardiomyopathy; iPSC, induced pluripotent stem cell.
Figure 6.

Structural characterization of iPSC‐derived cardiomyocytes. A, Electron microscopic images showing well‐organized striated myofibrils derived from beating EBs from control and HCM iPSCs at 60 days after differentiation. Scale bars, 1 μm. B, Electron microscopic images showing myofibrillar disarray derived from beating EBs from HCM iPSC at 60 days after differentiation. Scale bars, 1 μm. C, Immunostaining for cTnT in the single cardiomyocytes at 60 days derived from each HCM iPSC, showing myofibrillar disarray. D, The percentages of cardiomyocytes with myofibrillar disarray were assessed by cTnT immunostaining of the single cardiomyocytes. N=851 to 995. *P<0.05, **P<0.01 vs control in the same time point (χ2 test). cTnT indicates cardiac troponin T; EBs, embryoid bodies; HCM, hypertrophic cardiomyopathy; iPSC, induced pluripotent stem cell.
Figure 7.
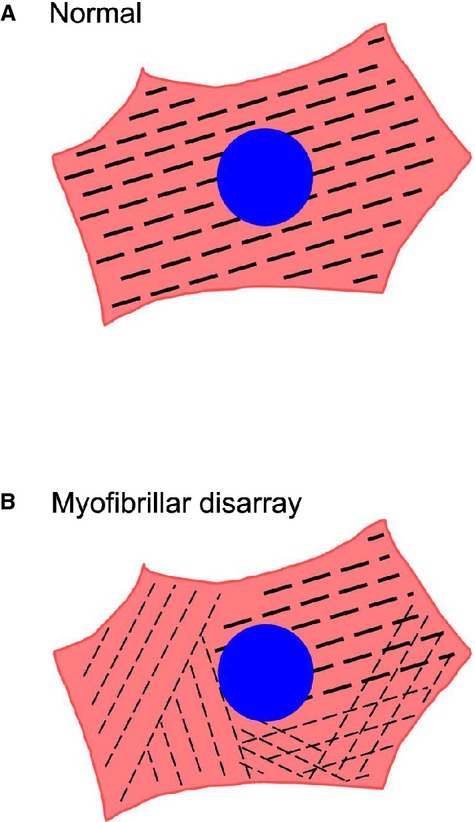
Schema of myofibrillar disarray in single induced pluripotent stem cell (iPSC)‐derived cardiomyocytes. A, Cardiomyocyte with normal myofibrillar alignment. B, Cardiomyocyte with myofibrillar disarray.
Figure 8.
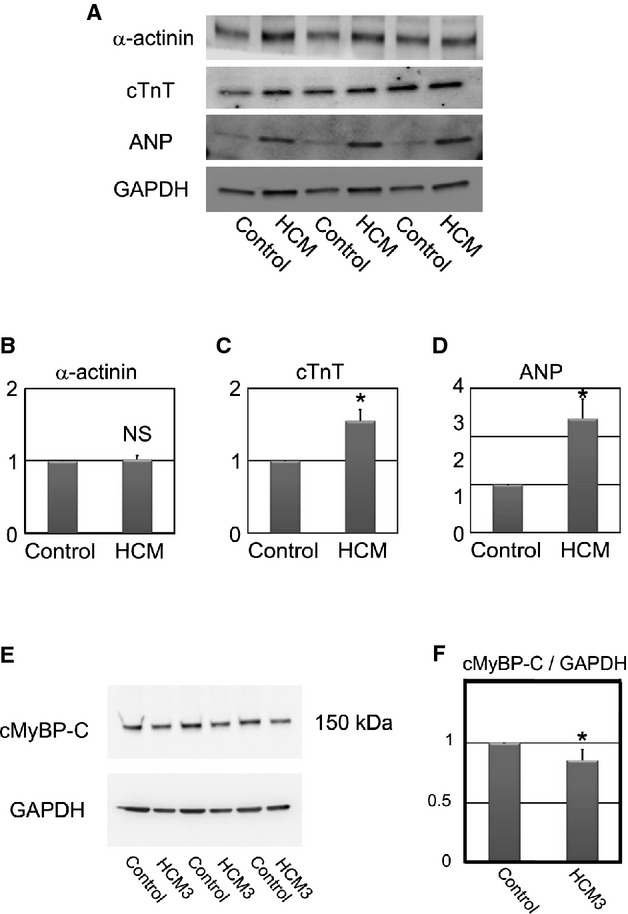
Cardiac‐specific protein expression in control and HCM iPSC‐derived cardiomyocytes. A, Western blotting for α‐actinin, cTnT, ANP, and GAPDH in control and HCM iPSC‐derived beating EBs at 60 days after differentiation. B through D, Statistical analyses of α‐actinin, cTnT, and ANP protein levels. N=4 to 6. *P<0.05 vs control (Mann–Whitney U test). E, Western blotting for cMyBP‐C in control and HCM3 iPSC‐derived beating EBs at 60 days after differentiation. F, Statistical analysis of cMyBP‐C protein level. N=6. *P<0.05 vs control (Mann–Whitney U test). ANP indicates atrial natriuretic peptide; cMyBP‐C, cardiac myosin‐binding protein C; cTnT, cardiac troponin T; HCM, hypertrophic cardiomyopathy; iPSC, induced pluripotent stem cell; GAPDH, glyceraldehyde‐3‐phosphate dehydrogenase.
ET‐1 Unmasks Pathological Features in HCM iPSC‐Derived Cardiomyocytes
To explore the mechanisms for deleterious pathogenesis in HCM, we examined the effect of several hypertrophic factors such as ET‐1, angiotensin II, insulin‐like growth factor 1, and phenylephrine on the iPSC‐derived cardiomyocytes. The iPSC‐derived cardiomyocytes were stimulated with each hypertrophic factor for 7 days (Figure 9A) and then analyzed for changes in the cell surface area and the incidence of myofibrillar disarray (Figure 9B through 9E). Some hypertrophic factors slightly, but significantly, increased cell surface area in control and HCM iPSC‐derived cardiomyocytes (Figure 9B and 9C). We also analyzed the effect of the hypertrophic factors on myofibrillar disarray. Control iPSC‐derived cardiomyocytes showed no change in the incidence of myofibrillar disarray following stimulation with the hypertrophic factors (Figure 9D), and remarkably, ET‐1 was the only hypertrophic factor to significantly increase the presence of myofibrillar disarray in the HCM iPSC‐derived cardiomyocytes (Figure 9E). In addition, HCM iPSC‐derived cardiomyocytes showed larger cell surface area and higher incidence of myofibrillar disarray than control iPSC‐derived cardiomyocytes in each condition (Figure 10A and 10B). We also performed electron microscopic observation of beating EBs stimulated by ET‐1, angiotensin II, insulin‐like growth factor 1, or phenylephrine for 7 days. Only the HCM iPSC‐derived cardiomyocytes exhibited myofibrillar disarray in the beating EBs after the ET‐1 stimulation (Figure 11A). Although the ET‐1 responsiveness was different between control and HCM iPSC‐derived cardiomyocytes, the mRNA levels of endothelin receptor type A (EDNRA) and endothelin receptor type B (EDNRB) were not significantly different between control and HCM cells (Figure 11B and 11C).
Figure 9.

ET‐1 augments pathological features in HCM iPSC‐derived cardiomyocytes. A, Immunostaining for cardiac troponin‐T (cTnT) of the single cardiomyocytes derived from each control and HCM iPSC. The single cardiomyocytes at 60 days were cultured for 7 days with ET‐1, Ang II, IGF‐1, or PE. B and C, Cell surface areas of 788 to 819 randomly chosen cTnT‐positive cardiomyocytes in each group and condition were measured. The single cardiomyocytes were cultured for 7 days with ET‐1, Ang II, IGF‐1, or PE (1‐way ANOVA with Steel's multiple comparison post‐test). D and E. The percentages of cardiomyocytes with myofibrillar disarray were assessed by immunostaining for cTnT. N=844 to 995. *P<0.05, **P<0.01, †P<0.0001 vs free condition (χ2 test). Ang II indicates angiotensin II; ET‐1, endothelin‐1; HCM, hypertrophic cardiomyopathy; IGF‐1, insulin‐like growth factor‐1; iPSC, induced pluripotent stem cell; PE, phenylephrine.
Figure 10.
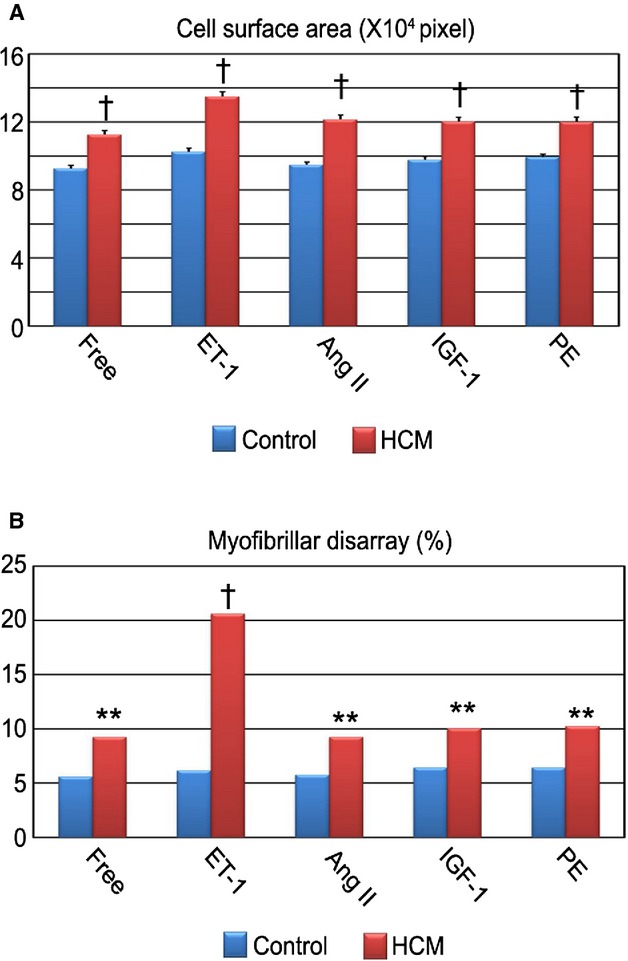
Increased pathological features in HCM iPSC‐derived cardiomyocytes. A, The single cardiomyocytes at 60 days after differentiation were cultured for 7 days with ET‐1, Ang II, IGF‐1, or PE. Cell surface areas of cTnT‐positive cardiomyocytes were measured. N=788 to 819. †P<0.0001 vs control in the same condition (Mann–Whitney U test). B, The percentages of cardiomyocytes with myofibrillar disarray were assessed by immunostaining for cardiac troponin‐T. N=844 to 995. **P<0.01, †P<0.0001 vs control in the same condition (χ2 test). Ang II indicates angiotensin II; cTnT, cardiac troponin‐T; ET‐1, endothelin‐1; HCM, hypertrophic cardiomyopathy; IGF‐1, insulin‐like growth factor‐1; iPSC, induced pluripotent stem cell; PE, phenylephrine.
Figure 11.

ET‐1 augments myofibrillar disarray in HCM iPSC‐derived cardiomyocytes. A, Electron microscopic observation of beating EBs at 60 days, which were cultured with ET‐1, Ang II, IGF‐1, or PE for 7 days. Scale bars, 1 μm. B and C, Relative gene expression of EDNRA and EDNRB in beating EBs at 30 days, normalized against TNNT2. N=3 (Control=3, HCM 1=3, HCM 1=3, HCM 3=3) (Kruskal–Wallis test). Ang II indicates angiotensin II; EBs, embryoid bodies; EDNRA, endothelin receptor type A; ET‐1, endothelin‐1; HCM, hypertrophic cardiomyopathy; IGF‐1, insulin‐like growth factor‐1; iPSC, induced pluripotent stem cell; PE, phenylephrine.
To elucidate the fine regulation of ET‐1 on the iPSC‐derived cardiomyocytes, we treated the cells with different concentrations of ET‐1. At baseline, HCM iPSC‐derived cardiomyocytes have enlarged the cell surface area more than control cells. ET‐1 increased the cell surface area in a concentration‐dependent manner in both groups, and HCM iPSC‐derived cardiomyocytes were more sensitive to ET‐1 than were the control cells (Figure 12A). ET‐1 had no significant effect on the incidence of myofibrillar disarray in the control iPSC‐derived cardiomyocytes, while it increased the incidence of myofibrillar disarray in the HCM iPSC‐derived cardiomyocytes in a concentration‐dependent manner (Figure 12B). NFAT has been suggested to play a critical role in HCM pathogenesis.25 The NFATc4 nuclear translocations were markedly increased on ET‐1 treatment in the HCM iPSC‐derived cardiomyocytes, compared with control cells (Figure 12C and 12D). We also examined other hypertrophic signaling such as extracellular signal‐regulated kinase and c‐Jun N‐terminal kinase by using western blottings in the control and HCM iPSC‐derived cardiomyocytes. There were no significant differences in extracellular signal‐regulated kinase and c‐Jun N‐terminal kinase activation by ET‐1 stimulation between control and HCM (data not shown).
Figure 12.
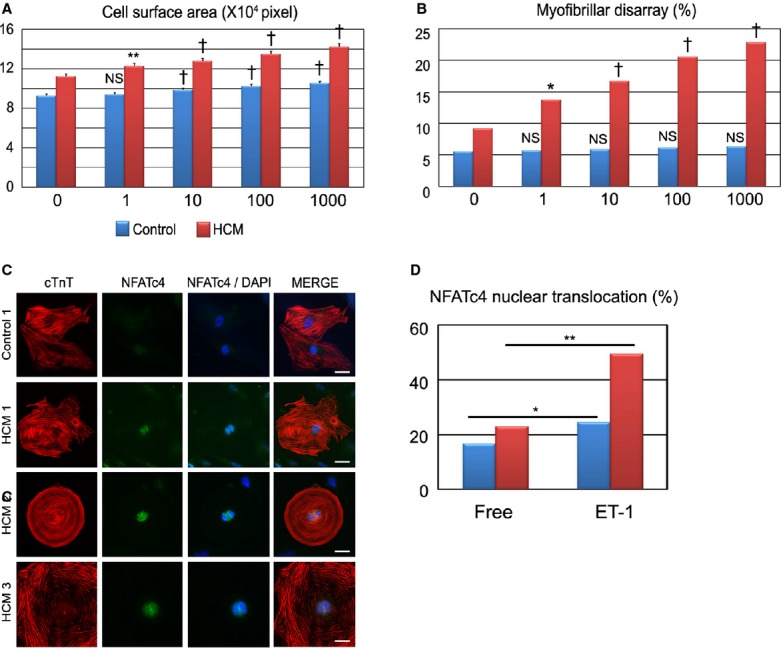
ET‐1 strengthens pathological features in HCM iPSC‐derived cardiomyocytes in a concentration‐dependent manner. A, Cell surface areas of 789 to 822 randomly chosen cardiac troponin‐T (cTnT)‐positive cardiomyocytes in each group and condition were measured. The cardiomyocytes were dissociated from EBs at 60 days and cultured for 7 days with various concentrations of ET‐1 (1, 10, 100, or 1000 nmol/L) (1‐way ANOVA with Steel's multiple comparison post‐test). B, The percentages of cardiomyocytes with myofibrillar disarray were assessed by immunostaining for cTnT of the single cardiomyocytes after 7 days of culture with ET‐1. N=875 to 995 (per each group and condition). *P<0.05, **P<0.01, †P<0.0001 vs ET‐1–free (0 nmol/L) condition in the same group (χ2 test). C and D, Nuclear translocation of NFATc4 was assessed by immunostaining for NFATc4 and cTnT. Isolated cardiomyocytes at 60 days were cultured for 7 days with or without ET‐1. The presented images were the iPSC‐derived cardiomyocytes cultured for 7 days with ET‐1. Scale bars, 20 μm. N=376 to 448 (per each group and condition). *P<0.01, **P<0.001 vs free condition in each group (χ2 test). EBs indicates0 embryoid bodies; ET‐1, endothelin‐1; HCM, hypertrophic cardiomyopathy; iPSC, induced pluripotent stem cell; NFAT, nuclear factor of activated T cells.
The ET‐1–ETA Axis has a Pivotal Role in Pathological Deterioration in HCM iPSC‐Derived Cardiomyocytes
To further investigate the potential therapeutic strategy of blocking ET‐1 signaling for disease prevention and regression, we examined the effects of ETA‐b (BQ‐123) and ETB‐b (BQ‐788) on the HCM iPSC‐derived cardiomyocytes, based on the cell surface area and the incidence of myofibrillar disarray. We added ETA‐b and ETB‐b for 7 days with ET‐1 to the HCM iPSC‐derived cardiomyocytes (Figure 13A). ETA‐b apparently blocked the ET‐1–induced cardiomyocyte hypertrophy, while no antihypertrophic effect was observed with ETB‐b (Figure 13A and 13B). In addition, coadministration of ETA‐b and ETB‐b attenuated the increased cell surface area induced by ET‐1. Without ET‐1, coadministration of ETA‐b and ETB‐b did not significantly affect cell surface area of the HCM iPSC‐derived cardiomyocytes. Moreover, ETA‐b, but not ETB‐b, significantly decreased the incidence of ET‐1–induced myofibrillar disarray in the HCM iPSC‐derived cardiomyocytes (Figure 13A and 13C). Electron microscopy of beating EBs treated with ET‐1 for 7 days also revealed attenuation of the increased myofibrillar disarray with ETA‐b, but not ETB‐b (Figure 13D and 13E). Although some previous reports showed that ETA‐b and ETB‐b both have antagonizing effects on ET‐1 in various tissues,26 ETB‐b showed no such action on the ET‐1–induced hypertrophy and incidence of myofibrillar disarray in the HCM iPSC‐derived cardiomyocytes. These data suggest that ETA‐b might have a preventive effect on disease manifestation in HCM iPSC‐derived cardiomyocytes. Next, we examined the effect of ET‐1 blockers on NFATc4 nuclear translocation in HCM iPSC‐derived cardiomyocytes. ETA‐b, but not ETB‐b, significantly decreased ET‐1–induced NFATc4 nuclear translocation in the HCM iPSC‐derived cardiomyocytes (Figure 13F and 13G).
Figure 13.

ET‐1–ETA axis has a pivotal role in pathological deterioration in HCM iPSC‐derived cardiomyocytes. A, Immunostaining for cardiac troponin‐T (cTnT) of the single cardiomyocytes derived from HCM 1, HCM 2, and HCM 3 iPSC‐derived cardiomyocytes. The single cardiomyocytes at 60 days were cultured for 7 days with ETA‐b and/or ETB‐b in the presence or absence of ET‐1. B, Cell surface areas of 809 to 825 randomly chosen cTnT‐positive cardiomyocytes in each condition were measured (1‐way ANOVA with Steel's multiple comparison post‐test). C, The percentages of cardiomyocytes with myofibrillar disarray were assessed by immunostaining for cTnT of the single cardiomyocytes. N=880 to 995 (per each condition). †P<0.0001 vs ET‐1 condition (χ2 test). D, Electron microscopic observation of beating EBs at 60 days cultured with ETA‐b or ETB‐b in the presence of ET‐1. Scale bars, 200 nm. E, Lower magnified electron microscopic images corresponding with (D). F and G, Nuclear translocation of NFATc4 was assessed by immunostaining for NFATc4 and cTnT. The single cardiomyocytes at 60 days were cultured for 7 days with ETA‐b and/or ETB‐b in the presence of ET‐1. Scale bars, 20 μm. N=391 to 751 (per each culture condition). †P<0.0001 vs ET‐1 condition (χ2 test). EBs indicates embryoid bodies; ET‐1, endothelin‐1; ETA‐b, endothelin receptor type A blocker; ETB‐b, endothelin receptor type B blocker; HCM, hypertrophic cardiomyopathy; iPSC, induced pluripotent stem cell; NFAT, nuclear factor of activated T cells.
Next, we examined the effect of ETA‐b on regressing the HCM pathological phenotype (Figure 14A). Interestingly, ET‐1 treatment of these cells during either the first or second 7‐day period significantly increased both cell surface area and the incidence of myofibrillar disarray at 14 days (Figure 14B through 14D: ET‐1‐Free, Free‐ET‐1). These data suggest that once cardiomyocytes acquire the HCM pathological state, it is difficult to spontaneously attenuate the phenotype. ETA‐b administration during the latter 7 days significantly reduced the cell surface area and the incidence of myofibrillar disarray in the ET‐1–treated HCM iPSC‐derived cardiomyocytes (Figure 14B through 14D: ET‐1‐ETA‐b). These data implicate the importance of ET‐1 and the ETA pathway in the pathological progression and regression of HCM.
Figure 14.
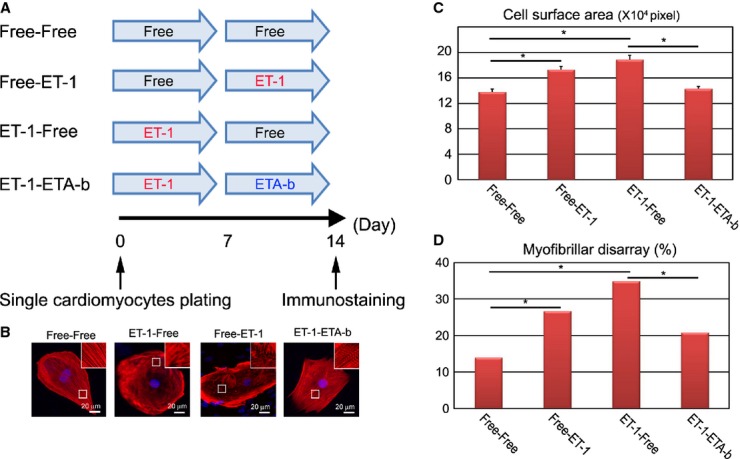
ETA‐b regresses the HCM pathological phenotype. A, Time course of drug stimulation protocols for beating single cardiomyocytes. The single cardiomyocytes derived from each of the HCM iPSCs, which were dissociated from EBs at 60 days, were cultured for 7 days with or without ET‐1, and then subsequently cultured for 7 days with or without ETA‐b. Immunostainings for cTnT with DAPI nuclear staining were performed at 14 days. B, The isolated cardiomyocytes at 60 days were cultured for 7 days with or without ET‐1 and subsequently cultured for 7 days with or without ET‐1, or ETA‐b. C, Cell surface areas of total 300 randomly chosen cTnT‐positive cardiomyocytes were measured in each culture condition (1‐way ANOVA with Steel's multiple‐comparison post‐test). D, The percentages of cardiomyocytes with myofibrillar disarray were assessed by immunostaining for cTnT of the single cardiomyocytes. N=317 to 361 (per each culture condition). *P<0.001 (χ2 test). cTnT indicates cardiac troponin‐T; EBs, embryoid bodies; ET‐1, endothelin‐1; ETA‐b, endothelin receptor type A blocker; HCM, hypertrophic cardiomyopathy; iPSCs, induced pluripotent stem cells.
ET‐1 Has a Pivotal Role in Myofibrillar Disarray in Heterozygous Mybpc3‐Targeted Knock‐in Mouse Myocytes
We showed that ET‐1 induced myofibrillar disarray in the HCM iPSC‐derived cardiomyocytes. We then examined whether this phenotype is reproduced in a well‐characterized mouse model of HCM. We chose the heterozygous Mybpc3‐targeted knock‐in mice (HET),16 which mimic the genetic situation of HCM patients, such as the present HCM 3. HET mice developed diastolic dysfunction but no cardiac hypertrophy.27 Interestingly, however, engineered heart tissue derived from neonatal HET mice exhibited accumulation of hypertrophic markers, suggesting that culture conditions could reveal hypertrophy in Mybpc3‐carrier mice. Cardiomyocytes were isolated from HET and wild‐type (WT) neonatal mice and cultured for 72 hours; serum was then removed for 12 hours, and thereafter cells were stimulated by either ET‐1 or control for 48 hours. We then measured cell surface area and myofibrillar disarray after immunostaining for α‐actinin and cMyBP‐C (Figure 15A and 15B). In basal conditions, HET cardiomyocytes were larger than those of WT but did not exhibit higher incidence of myofibrillar disarray than WT cardiomyocytes (Figure 15C and 15D: Control). ET‐1 induced a similar extent of cardiomyocyte hypertrophy in WT and HET (Figure 15C). On the other hand, whereas ET‐1 had no effect on the myofibrillar disarray in WT cells, it markedly increased the incidence of myofibrillar disarray in HET (Figure 15D). In baseline conditions, mRNA levels for actin, alpha 1, skeletal muscle (Acta1), natriuretic peptide type A (Nppa), and natriuretic peptide type B (Nppb) were all higher in HET than in WT cells. ET‐1 increased all of them in both groups and particularly Nppb mRNA levels in HET cardiomyocytes (Figure 15E through 15G). These data suggest that ET‐1 induces pathological cardiac phenotypes in the HCM model.
Figure 15.

ET‐1 augments the incidence of myofibrillar disarray in cardiomyocytes isolated from heterozygous Mybpc3‐targeted knock‐in mice. A, Immunostaining for α‐actinin and cMyBP‐C with DRAQ5 nuclear staining of cardiomyocytes derived from neonatal wild‐type (WT) and Mybpc3‐targeted heterozygous knock‐in (HET) mice. Scale bars, 20 μm. B, Immunostaining for α‐actinin and cMyBP‐C with DRAQ5 nuclear staining of the single cardiomyocytes derived from WT and HET mice, which were cultured with ET‐1 for 48 hours. Scale bars, 20 μm. C, Cell surface areas of 173 to 178 randomly chosen α‐actinin–positive cardiomyocytes in each condition were measured. *P<0.05, **P<0.01 vs WT or as indicated on the figure (Mann–Whitney U test). D, The percentages of cardiomyocytes with myofibrillar disarray were assessed by immunostaining for α‐actinin of the single cardiomyocytes. N=215 to 236. *P<0.05, **P<0.01 vs WT or as indicated on the figure (χ2 test). E through G, Quantitative RT‐PCR analyses for Acta1, Nppa, and Nppb. N=3 to 5. *P<0.05, **P<0.01 (Kruskal–Wallis test). Acta1 indicates α‐skeletal muscle; cMyBP‐C, cardiac myosin‐binding protein C; ET‐1, endothelin‐1; Mybpc3, human/mouse gene encoding cardiac myosin‐binding protein C; Nppa, natriuretic peptide type A; Nppb, natriuretic peptide type B; RT‐PCR, reverse transcription‐polymerase chain reaction.
Contraction Variability Is Captured by Motion Vector Analysis in Single Beating Cardiomyocytes Derived From iPSCs
We showed herein that myofibrillar disarray increased by ET‐1 and decreased by ETA‐b in HCM iPSC‐derived cardiomyocytes. To elucidate whether myofibrillar disarray in beating human cardiomyocytes can affect physiological properties, we last analyzed the contractile dynamics of the self‐beating iPSC‐derived single cardiomyocytes in terms of contractile direction, using a high‐speed video imaging and analysis system.12 This system can evaluate contractile direction of every moving spot detected in a spontaneously beating cardiomyocyte and produce an index of contractile dispersion (Figure 16). To analyze variability in the contractile direction, iPSC‐derived cardiomyocytes were cultured under adherent culture conditions for 24 hours after beating EBs were dissociated (0 hours) and treated with ET‐1 in the absence or presence of ETA‐b or ETB‐b for 24 or 48 hours. Motion vector pictures (Vector) showed the captured motion direction and distance at each point in each single beating cardiomyocyte, and histograms indicated the corresponding point frequencies at a range of angles (0° to 180°; Figure 17A). We compared the variation in the SD scores of the histogram between control and HCM iPSC‐derived cardiomyocytes. Before ET‐1 administration (Free), the histograms of control and HCM iPSC‐derived cardiomyocytes showed a single sharp peak with lower SD scores, although the SD scores of HCM were mildly higher than those of control (Figure 17B and Video clip S1). After ET‐1 administration, the control iPSC‐derived cardiomyocyte histograms still showed a sharp peak at 24 and 48 hours, indicating synergistic beating in a given direction (Figure 17A, 17C, and 17D). In contrast, the HCM iPSC‐derived cardiomyocyte histograms showed a broad distribution with higher SD scores after the ET‐1 administration, indicating disorganized contractile form (Figure 17A and Video clip S2). The SD scores of the HCM iPSC‐derived cardiomyocytes were significantly increased by ET‐1 administration at 24 hours compared with the control cells (Figure 17C). At 48 hours, ET‐1 administration strongly induced the contractile dispersion in the HCM iPSC‐derived cardiomyocytes, and this effect was clearly blocked by ETA‐b, but not by ETB‐b (Figure 17D).
Discussion
In this study, we elucidated an interaction between genetic backgrounds and environmental factors by using HCM iPSC‐derived cardiomyocytes. HCM patients have a wide variety of medical backgrounds in terms of clinical severity, family history, and gene mutations. However, HCM patients show similar phenotypes in terms of heart morphology, pathology, and hemodynamic features. We therefore sought to identify a common pathway of disease manifestation in HCM among patients with different backgrounds by using iPSC‐derived cardiomyocytes. Hence, we selected the patient with HCM without known mutations and the patient with HCM with a mutation in MYBPC3, which is one of the most frequent mutated genes in HCM patients.10
In HCM hearts, left ventricular hypertrophy and myocardial disarray are key hallmarks as pathological features. These accumulating data definitely suggest that histopathological studies in HCM could provide valuable information in terms of prognosis and disease severity. Myofibrillar disarray is also documented as a HCM phenotype and used as a marker of the disease.20–22 We found myofibrillar disarray frequently in the HCM iPSC‐derived cardiomyocytes. Thereafter, we focused on what could induce this morphological feature and found that the incidence of the myofibrillar disarray was enhanced by ET‐1 in the HCM iPSC‐derived cardiomyocytes. We also confirmed that cardiomyocytes from established mouse HCM model16,27 also showed myofibrillar disarray induced by ET‐1. In iPSC‐derived cardiomyocytes, the expression levels of ET receptors were comparable, but NFAT was activated by ET‐1 specifically in the HCM iPSC‐derived cardiomyocytes, which suggests that ET‐1–induced NFAT activation is intracellularly affected in the HCM iPSC‐derived cardiomyocytes. The activation of calcium‐dependent serine–threonine protein phosphatase calcineurin induces pathological cardiac hypertrophy and deleterious remodeling of the heart through NFAT activation.28 On the contrary, the calcineurin–NFAT pathway is not activated in physiological hypertrophic response despite increased systolic calcium transient,29 the mechanism of which remains unclear.
HCM mutations are found in many sarcomeric genes, including MYBPC3. Sarcomere and myofibril formations are finely and tightly regulated. The structural changes could be affected by those mutations.30 The efficiency of incorporation of mutated sarcomeric proteins into sarcomere varies according to the mutation, which could affect the myocyte contractility.31 The content of mutated protein would vary from fiber to fiber, which would cause variation in force generation in each fiber,32 which might result in myofibrillar disarray. Several signaling molecules could modify the pathophysiology of HCM in a context‐dependent fashion.3 ET‐1, angiotensin, and catecholamines have various important roles, but each ligand has definitely different roles in cardiac physiology.33 In the heart, binding and activation of ETA predominantly mediate ET‐1 signaling and potently induce cardiomyocyte hypertrophy.34 In our study, ET‐1 stimulation specifically induces NFAT nuclear accumulation in the HCM iPSC‐derived cardiomyocytes and shows the prominent effects on HCM phenotypes. NFAT is a strong mediator in cardiac hypertrophy and is both sufficient and necessary for the cardiac hypertrophic response.35–36 Therefore, we have speculated that NFAT activation would exaggerate myofibrillar disarray, which might be slightly present without those stimulation in the presence of sarcomeric gene mutation. To elucidate the physiological effect of myofibrillar disarray, we used high‐speed imaging and revealed that the contractile cooperativity was disrupted in the individual HCM iPSC‐derived cardiomyocytes. To develop the automated high throughput screening for drug screening, we should determine the suitable markers. Myofibrillar disarray and the contractile cooperativity disruption may be useful markers in HCM cardiomyocytes. Thus, our results will push ahead with the developments of drug invention strategy focused on the underlying pathogenesis of HCM.
This study has several limitations. First, the iPSCs that we used were generated from 2 original cell sources: dermal fibroblasts and circulating T lymphocytes. Although the original cell memory would remain in the established iPSCs, it is still unknown if cardiomyocytes differentiated from such iPSCs might inherit the original cell nature. Fibroblasts are often used for the sources of iPSC generation, and the character of iPSC‐derived cardiomyocytes was comparable to embryonic stem cell–derived cardiomyocytes.37 T cell‐derived iPSCs could also differentiate into functional cardiomyocytes which are comparable to embryonic stem cell–derived cardiomyocytes,38 which suggests that those iPSC‐derived cardiomyocytes can be used for the disease analysis. Second, the iPSC‐derived cardiomyocytes showed immature phenotype, and there should be some differences between adult cardiomyocytes and iPSC‐derived cardiomyocytes. Although there are many attempts to obtain mature iPSC‐derived cardiomyocytes resembling adult phenotype, ideally rod‐shaped cardiomyocytes, current techniques could not accomplish the full maturation. However, we found some pathological differences between control and HCM iPSCs‐derived cardiomyocytes, as seen in the previous studies using disease‐specific iPSCs. It would be, therefore, an appropriate model to decipher the characteristic differences at the cellular level, though there should be some room for better technical improvement. Third, 3 patients have totally different independent genetic backgrounds. HCM3 has a MYBPC3 mutation (Gly999‐Gln1004del). During further genetic screening, we found that HCM1 has a mutation in TPM1 (Arg91Cys), but it remains unclear whether the mutation would affect disease phenotype. HCM2 is genetically negative but there may be unknown mutation. It may be possible that those different genetic backgrounds modify disease phenotypic severity. It is preferable to conduct those experiments using many iPSC lines derived from many patients, as with a clinical study. In the future, we would like to recruit many more patients, and detailed characterization will be desired for the patients with independent genetic backgrounds.
HCM mutations induce dysfunction in myocyte contractility, consequently leading to an activation of several stress‐responsive trophic and mitotic factors.39 Because of the lack of human models in which to assess the interactions between genetic backgrounds and such factors, determination of the candidates for HCM progression has been hampered. As used here, emerging iPSC technology enabled us to evaluate this problem, revealing the pathological effects of ET‐1. ET‐1 is a potent vasoconstrictor that induced hypertrophy in cultured cardiomyocytes,33 and it is reported that the plasma level of ET‐1 was significantly increased in HCM patients.40–41 The concentration of ET‐1 used in the present study was higher than the plasma concentration in patients with heart failure but is the standard ET‐1 concentration as used in previous experiments,42 which would be partly because the ET‐1 signal acts in the heart in an autocrine/paracrine fashion.43 ETA receptor was highly expressed in heart compared with the ETB receptor,44 and ETA‐b attenuated cardiac hypertrophy provoked by several causes.45–46 In the current study, we showed that the ET‐1–ETA axis could be a common pathway in HCM disease manifestation. To move those findings forward to clinical study, we should confirm therapeutic effect of ET‐1 blocker on HCM in experimental models in vivo. It is important to know the effect of ET‐1 blocker on an in vivo HCM model for various time courses: young age and old age. A transgenic rabbit model of HCM clearly showed temporal evolution of cardiac phenotypes such as a higher calcium sensitivity of myofibrillar ATPase activity at earlier stage and cardiac hypertrophy and fibrosis at later stage, which suggests the involvement of multiple independent mechanisms in the pathogenesis of HCM phenotypes.47
In summary, we demonstrated that patient‐specific iPSCs are invaluable systems in which to assess the genetic–environmental interactions involved in HCM disease progression. Moreover, our data indicate that interactions between the genetic backgrounds and the environmental factor “ET‐1” promoted the HCM phenotypes, such as myocyte hypertrophy and myofibrillar disarray, in the HCM iPSC‐derived and in the well‐characterized HCM mouse model–derived cardiomyocytes. These results could provide useful knowledge regarding the precise disease mechanism that operates downstream of HCM causal mutations to modify the nature of each individual disease state.
Supplementary Material
Appendix 1 Supplementary Movie S1.
Appendix 2 Supplementary Movie S2.
Sources of Funding
This study was supported in part by research grants from the Ministry of Education, Culture, Sports, Science and Technology, Health Labour Sciences Research Grant, the New Energy and Industrial Technology Development Organization, Japan, the Program for Promotion of Fundamental Studies in Health Science of the National Institute of Biomedical Innovation, Japan Science and Technology Agency, Research Center Network for Realization of Regenerative Medicine “The Program for Intractable Diseases Research utilizing Disease‐specific iPS cells,” The Nakatomi Foundation, Japan Heart Foundation/Novartis Grant for Research Award on Molecular and Cellular Cardiology SENSHIN Medical Research Foundation, Kimura Memorial Heart Foundation Research Grant, Japan Intractable Diseases Research Foundation, Japan, The Cell Science Research Foundation, The Tokyo Biochemical Research Foundation, Suzuken Memorial Foundation, The Japan Foundation for Applied Enzymology, Joint Usage/Research Program of Medical Research Institute, Tokyo Medical and Dental University, the DZHK (German Center for Cardiovascular Research), the German Ministry of Research and Education (BMBF), and the Association Institut de Myologie (Paris).
Disclosures
None.
Acknowledgments
We thank Dr T. Hayakawa and Mr T. Kunihiro from Sony Corporation for their technical help in the high‐speed video recording of cardiomyocytes and in the image analysis with motion vector prediction algorithm. We thank C. Kadota for technical assistance. We thank Thomas Eschenhagen for the thoughtful discussion on experiments we performed in the Department of Experimental Pharmacology and Toxicology, University Medical Center Hamburg‐Eppendorf, Hamburg, Germany.
References
- 1.Members WC, Gersh BJ, Maron BJ, Bonow RO, Dearani JA, Fifer MA, Link MS, Naidu SS, Nishimura RA, Ommen SR, Rakowski H, Seidman CE, Towbin JA, Udelson JE, Yancy CW. 2011 ACCF/AHA guideline for the diagnosis and treatment of hypertrophic cardiomyopathy: executive summary: a report of the American College of Cardiology Foundation/American Heart Association Task Force on Practice Guidelines. Circulation. 2011; 124:2761-2796. [DOI] [PubMed] [Google Scholar]
- 2.Coats CJ, Hollman A. Hypertrophic cardiomyopathy: lessons from history. Heart. 2008; 94:1258-1263. [DOI] [PubMed] [Google Scholar]
- 3.Ashrafian H, McKenna WJ, Watkins H. Disease pathways and novel therapeutic targets in hypertrophic cardiomyopathy. Circ Res. 2011; 109:86-96. [DOI] [PubMed] [Google Scholar]
- 4.McConnell BK, Fatkin D, Semsarian C, Jones KA, Georgakopoulos D, Maguire CT, Healey MJ, Mudd JO, Moskowitz IPG, Conner DA, Giewat M, Wakimoto H, Berul CI, Schoen FJ, Kass DA, Seidman CE, Seidman JG. Comparison of two murine models of familial hypertrophic cardiomyopathy. Circ Res. 2001; 88:383-389. [DOI] [PubMed] [Google Scholar]
- 5.Marian AJ. Pathogenesis of diverse clinical and pathological phenotypes in hypertrophic cardiomyopathy. Lancet. 2000; 355:58-60. [DOI] [PubMed] [Google Scholar]
- 6.Takahashi K, Tanabe K, Ohnuki M, Narita M, Ichisaka T, Tomoda K, Yamanaka S. Induction of pluripotent stem cells from adult human fibroblasts by defined factors. Cell. 2007; 131:861-872. [DOI] [PubMed] [Google Scholar]
- 7.Khan JM, Lyon AR, Harding SE. The case for induced pluripotent stem cell‐derived cardiomyocytes in pharmacological screening. Br J Pharmacol. 2013; 169:304-317. [DOI] [PMC free article] [PubMed] [Google Scholar]
- 8.Tiscornia G, Vivas EL, Belmonte JCI. Diseases in a dish: modeling human genetic disorders using induced pluripotent cells. Nat Med. 2011; 17:1570-1576. [DOI] [PubMed] [Google Scholar]
- 9.Force T, Bonow RO, Houser SR, Solaro RJ, Hershberger RE, Adhikari B, Anderson ME, Boineau R, Byrne BJ, Cappola TP, Kalluri R, LeWinter MM, Maron MS, Molkentin JD, Ommen SR, Regnier M, Tang WHW, Tian R, Konstam MA, Maron BJ, Seidman CE. Research priorities in hypertrophic cardiomyopathy. Circulation. 2010; 122:1130-1133. [DOI] [PMC free article] [PubMed] [Google Scholar]
- 10.Behrens‐Gawlik V, Mearini G, Gedicke‐Hornung C, Richard P, Carrier L. MYBPC3 in hypertrophic cardiomyopathy: from mutation identification to RNA‐based correction. Pflugers Arch. 2014; 466:215-223. [DOI] [PubMed] [Google Scholar]
- 11.Marian AJ. Experimental therapies in hypertrophic cardiomyopathy. J Cardiovasc Transl Res. 2009; 2:483-492. [DOI] [PMC free article] [PubMed] [Google Scholar]
- 12.Hayakawa T, Kunihiro T, Dowaki S, Uno H, Matsui E, Uchida M, Kobayashi S, Yasuda A, Shimizu T, Okano T. Noninvasive evaluation of contractile behavior of cardiomyocyte monolayers based on motion vector analysis. Tissue Eng Part C Methods. 2012; 18:21-32. [DOI] [PubMed] [Google Scholar]
- 13.Ohnuki M, Takahashi K, Yamanaka S. Generation and characterization of human induced pluripotent stem cells. Curr Protoc Stem Cell Biol. 2009; 9:1-25. [DOI] [PubMed] [Google Scholar]
- 14.Seki T, Yuasa S, Fukuda K. Generation of induced pluripotent stem cells from a small amount of human peripheral blood using a combination of activated T cells and Sendai virus. Nat Protoc. 2012; 7:718-728. [DOI] [PubMed] [Google Scholar]
- 15.Seki T, Yuasa S, Fukuda K. Derivation of induced pluripotent stem cells from human peripheral circulating T cells. Curr Protoc Stem Cell Biol. 2011; 18:1-9. [DOI] [PubMed] [Google Scholar]
- 16.Vignier N, Schlossarek S, Fraysse B, Mearini G, Krämer E, Pointu H, Mougenot N, Guiard J, Reimer R, Hohenberg H, Schwartz K, Vernet M, Eschenhagen T, Carrier L. Nonsense‐mediated mRNA decay and ubiquitin–proteasome system regulate cardiac myosin‐binding protein C mutant levels in cardiomyopathic mice. Circ Res. 2009; 105:239-248. [DOI] [PubMed] [Google Scholar]
- 17.Seki T, Yuasa S, Oda M, Egashira T, Yae K, Kusumoto D, Nakata H, Tohyama S, Hashimoto H, Kodaira M, Okada Y, Seimiya H, Fusaki N, Hasegawa M, Fukuda K. Generation of induced pluripotent stem cells from human terminally differentiated circulating T cells. Cell Stem Cell. 2010; 7:11-14. [DOI] [PubMed] [Google Scholar]
- 18.Egashira T, Yuasa S, Suzuki T, Aizawa Y, Yamakawa H, Matsuhashi T, Ohno Y, Tohyama S, Okata S, Seki T, Kuroda Y, Yae K, Hashimoto H, Tanaka T, Hattori F, Sato T, Miyoshi S, Takatsuki S, Murata M, Kurokawa J, Furukawa T, Makita N, Aiba T, Shimizu W, Horie M, Kamiya K, Kodama I, Ogawa S, Fukuda K. Disease characterization using LQTS‐specific induced pluripotent stem cells. Cardiovasc Res. 2012; 95:419-429. [DOI] [PubMed] [Google Scholar]
- 19.Maron BJ, Gottdiener JS, Epstein SE. Patterns and significance of distribution of left ventricular hypertrophy in hypertrophic cardiomyopathy. Am J Cardiol. 1981; 48:418-428. [DOI] [PubMed] [Google Scholar]
- 20.Tashiro A, Masuda T, Segawa I. Morphometric comparison of mitochondria and myofibrils of cardiomyocytes between hypertrophic and dilated cardiomyopathies. Virchows Arch A Pathol Anat Histopathol. 1990; 416:473-478. [DOI] [PubMed] [Google Scholar]
- 21.Pearce PC, Hawkey C, Symons C, Olsen EG. Role of calcium in the induction of cardiac hypertrophy and myofibrillar disarray. Experimental studies of a possible cause of hypertrophic cardiomyopathy. Br Heart J. 1985; 54:420-427. [DOI] [PMC free article] [PubMed] [Google Scholar]
- 22.Kim SJ, Iizuka K, Kelly RA, Geng YJ, Bishop SP, Yang G, Kudej A, McConnell BK, Seidman CE, Seidman JG, Vatner SF. An alpha‐cardiac myosin heavy chain gene mutation impairs contraction and relaxation function of cardiac myocytes. Am J Physiol. 1999; 276:H1780-H1787. [DOI] [PubMed] [Google Scholar]
- 23.van Dijk SJ, Dooijes D, dos Remedios C, Michels M, Lamers JMJ, Winegrad S, Schlossarek S, Carrier L, ten Cate FJ, Stienen GJM, van der Velden J. Cardiac myosin‐binding protein C mutations and hypertrophic cardiomyopathy: haploinsufficiency, deranged phosphorylation, and cardiomyocyte dysfunction. Circulation. 2009; 119:1473-1483. [DOI] [PubMed] [Google Scholar]
- 24.Marston S, Copeland ON, Gehmlich K, Schlossarek S, Carrrier L. How do MYBPC3 mutations cause hypertrophic cardiomyopathy? J Muscle Res Cell Motil. 2012; 33:75-80. [DOI] [PubMed] [Google Scholar]
- 25.Poirier O, Nicaud V, McDonagh T, Dargie HJ, Desnos M, Dorent R, Roizes G, Schwartz K, Tiret L, Komajda M, Cambien F. Polymorphisms of genes of the cardiac calcineurin pathway and cardiac hypertrophy. Eur J Hum Genet. 2003; 11:659-664. [DOI] [PubMed] [Google Scholar]
- 26.Jandeleit‐Dahm KAM, Watson AMD. The endothelin system and endothelin receptor antagonists. Curr Opin Nephrol Hypertens. 2012; 21:66-71. [DOI] [PubMed] [Google Scholar]
- 27.Fraysse B, Weinberger F, Bardswell SC, Cuello F, Vignier N, Geertz B, Starbatty J, Krämer E, Coirault C, Eschenhagen T, Kentish JC, Avkiran M, Carrier L. Increased myofilament Ca2+ sensitivity and diastolic dysfunction as early consequences of Mybpc3 mutation in heterozygous knock‐in mice. J Mol Cell Cardiol. 2012; 52:1299-1307. [DOI] [PMC free article] [PubMed] [Google Scholar]
- 28.Molkentin JD. Parsing good versus bad signaling pathways in the heart: role of calcineurin–nuclear factor of activated T‐cells. Circ Res. 2013; 113:16-19. [DOI] [PMC free article] [PubMed] [Google Scholar]
- 29.Wilkins BJ, Dai Y‐S, Bueno OF, Parsons SA, Xu J, Plank DM, Jones F, Kimball TR, Molkentin JD. Calcineurin/NFAT coupling participates in pathological, but not physiological, cardiac hypertrophy. Circ Res. 2004; 94:110-118. [DOI] [PubMed] [Google Scholar]
- 30.Marian AJ, Roberts R. The molecular genetic basis for hypertrophic cardiomyopathy. J Mol Cell Cardiol. 2001; 33:655-670. [DOI] [PMC free article] [PubMed] [Google Scholar]
- 31.Yang Q, Sanbe A, Osinska H, Hewett TE, Klevitsky R, Robbins J. A mouse model of myosin binding protein C human familial hypertrophic cardiomyopathy. J Clin Invest. 1998; 102:1292-1300. [DOI] [PMC free article] [PubMed] [Google Scholar]
- 32.Kirschner SE, Becker E, Antognozzi M, Kubis H‐P, Francino A, Navarro‐López F, Bit‐Avragim N, Perrot A, Mirrakhimov MM, Osterziel K‐J, McKenna WJ, Brenner B, Kraft T. Hypertrophic cardiomyopathy‐related β‐myosin mutations cause highly variable calcium sensitivity with functional imbalances among individual muscle cells. Am J Physiol. 2005; 288:H1242-H1251. [DOI] [PubMed] [Google Scholar]
- 33.Kang M, Chung KY, Walker JW. G‐protein coupled receptor signaling in myocardium: not for the faint of heart. Physiology. 2007; 22:174-184. [DOI] [PubMed] [Google Scholar]
- 34.Sugden PH. An overview of endothelin signaling in the cardiac myocyte. J Mol Cell Cardiol. 2003; 35:871-886. [DOI] [PubMed] [Google Scholar]
- 35.Molkentin JD, Lu J‐R, Antos CL, Markham B, Richardson J, Robbins J, Grant SR, Olson EN. A calcineurin‐dependent transcriptional pathway for cardiac hypertrophy. Cell. 1998; 93:215-228. [DOI] [PMC free article] [PubMed] [Google Scholar]
- 36.Wilkins BJ, Molkentin JD. Calcineurin and cardiac hypertrophy: where have we been? Where are we going? J Physiol. 2002; 541:1-8. [DOI] [PMC free article] [PubMed] [Google Scholar]
- 37.Zhang J, Wilson GF, Soerens AG, Koonce CH, Yu J, Palecek SP, Thomson JA, Kamp TJ. Functional cardiomyocytes derived from human induced pluripotent stem cells. Circ Res. 2009; 104:e30-e41. [DOI] [PMC free article] [PubMed] [Google Scholar]
- 38.Seki T, Yuasa S, Kusumoto D, Kunitomi A, Saito Y, Tohyama S, Yae K, Kishino Y, Okada M, Hashimoto H, Takei M, Egashira T, Kodaira M, Kuroda Y, Tanaka A, Okata S, Suzuki T, Murata M, Fujita J, Fukuda K. Generation and characterization of functional cardiomyocytes derived from human T cell‐derived induced pluripotent stem cells. PLoS One. 2014; 9:e85645. [DOI] [PMC free article] [PubMed] [Google Scholar]
- 39.Östman‐Smith I, Wettrell G. Pathophysiology of hypertrophic cardiomyopathy. Lancet. 2000; 355:928. [DOI] [PubMed] [Google Scholar]
- 40.Ito H, Hirata Y, Hiroe M, Tsujino M, Adachi S, Takamoto T, Nitta M, Taniguchi K, Marumo F. Endothelin‐1 induces hypertrophy with enhanced expression of muscle‐specific genes in cultured neonatal rat cardiomyocytes. Circ Res. 1991; 69:209-215. [DOI] [PubMed] [Google Scholar]
- 41.Hasegawa K, Fujiwara H, Koshiji M, Inada T, Ohtani S, Doyama K, Tanaka M, Matsumori A, Fujiwara T, Shirakami G, Hosoda K, Nakao K, Sasayama S. Endothelin‐1 and its receptor in hypertrophic cardiomyopathy. Hypertension. 1996; 27:259-264. [DOI] [PubMed] [Google Scholar]
- 42.Kedzierski RM, Yanagisawa M. Endothelin system: the double‐edged sword in health and disease. Annu Rev Pharmacol Toxicol. 2001; 41:851-876. [DOI] [PubMed] [Google Scholar]
- 43.Higazi DR, Fearnley CJ, Drawnel FM, Talasila A, Corps EM, Ritter O, McDonald F, Mikoshiba K, Bootman MD, Roderick HL. Endothelin‐1‐stimulated InsP3‐induced Ca2+ release is a nexus for hypertrophic signaling in cardiac myocytes. Mol Cell. 2009; 33:472-482. [DOI] [PubMed] [Google Scholar]
- 44.Thibault G, Arguin C, Garcia R. Cardiac endothelin‐1 content and receptor subtype in spontaneously hypertensive rats. J Mol Cell Cardiol. 1995; 27:2327-2336. [DOI] [PubMed] [Google Scholar]
- 45.Ito H, Hiroe M, Hirata Y, Fujisaki H, Adachi S, Akimoto H, Ohta Y, Marumo F. Endothelin eta receptor antagonist blocks cardiac hypertrophy provoked by hemodynamic overload. Circulation. 1994; 89:2198-2203. [DOI] [PubMed] [Google Scholar]
- 46.Ehmke H, Faulhaber J, Münter K, Kirchengast M, Wiesner RJ. Chronic ETA receptor blockade attenuates cardiac hypertrophy independently of blood pressure effects in renovascular hypertensive rats. Hypertension. 1999; 33:954-960. [DOI] [PubMed] [Google Scholar]
- 47.Nagueh SF, Chen S, Patel R, Tsybouleva N, Lutucuta S, Kopelen HA, Zoghbi WA, Quiñones MA, Roberts R, Marian AJ. Evolution of expression of cardiac phenotypes over a 4‐year period in the β‐myosin heavy chain‐Q403 transgenic rabbit model of human hypertrophic cardiomyopathy. J Mol Cell Cardiol. 2004; 36:663-673. [DOI] [PMC free article] [PubMed] [Google Scholar]
Associated Data
This section collects any data citations, data availability statements, or supplementary materials included in this article.
Supplementary Materials
Appendix 1 Supplementary Movie S1.
Appendix 2 Supplementary Movie S2.