

Abstract
Background
Vascular dysfunction is an early expression of atherosclerosis and predicts cardiovascular (CV) events. Peripheral arterial tonometry (PAT) evaluates basal pulse amplitude (BPA), endothelial function (PAT ratio), and wave reflection (PAT‐AIx) in the digital microvessels. In Brazilian adults, we investigated the correlations of PAT responses to CV risk factors and to carotid‐femoral pulse wave velocity (PWV), a measure of arterial stiffness.
Methods and Results
In a cross‐sectional study, 1535 participants of the ELSA‐Brasil cohort underwent PAT testing (52±9 years; 44% women). In multivariable analyses, more‐impaired BPA and PAT ratios were associated with male sex, higher body mass index (BMI), and total cholesterol/high‐density lipoprotein. Higher age and triglycerides were related to higher BPA, whereas lower systolic blood pressure, hypertension (HTN) treatment, and prevalent CV disease (CVD) were associated with lower PAT ratio. PAT‐AIx correlated positively with female sex, advancing age, systolic and diastolic blood pressures, and smoking and inversely to heart rate, height, BMI, and prevalent CVD. Black race was associated with lower BPA, higher PAT ratio, and PAT‐AIx. Microvessel vasodilator function was not associated with PWV. Higher PAT‐AIx was modestly correlated to higher PWV and PAT ratio and inversely correlated to BPA.
Conclusion
Metabolic risk factors are related to impaired microvessel vasodilator function in Brazil. However, in contrast to studies from the United States, black race was not associated with an impaired microvessel vasodilator response, implying that vascular function may vary by race across populations. PAT‐AIx relates to HTN, may be a valid measure of wave reflection, and provides distinct information from arterial stiffness.
Keywords: arterial stiffness, endothelium, epidemiology, race/ethnicity, vascular function
Introduction
Endothelial dysfunction is an early expression of vascular disease, relates to cardiovascular (CV) risk factors, and predicts CV events.1 It is characterized by decreased nitric oxide (NO) bioavailability and results in vascular inflammation, constriction, and thrombosis.1 The response to increased flow in digital microcirculation, measured by peripheral arterial tonometry (PAT), depends on NO bioavailability and has been established as a measure of endothelial function.2–3 Previous studies have reported that PAT response is related to endothelial dysfunction in the coronary arteries,4–5 to CV risk factors,6–7 and may predict CV events.8–9 PAT also measures basal tone, which associates with CV risk factors,6–7 but was not able to predict CV events in a high‐risk population.9
Augmentation index (AIx) measures the contribution that wave reflection makes to arterial pressure and is expressed as a percentage of pulse pressure.10 AIx is traditionally measured by arterial tonometry, associates with CV risk factors, and predicts CV events in selected populations.10 Recently, PAT‐derived waveforms have been used to calculate AIx (PAT‐AIx), which correlates with AIx obtained by radial tonometry.11 However, the association of PAT‐AIx to risk factors and other vascular function measures is not clearly elucidated.12–13
Previous studies have shown the relation of PAT measures to CV risk factors in American and European cohorts.6–7 In U.S. cohorts, black race was associated with impaired endothelial function.12,14 Therefore, we sought to evaluate the clinical correlates of PAT measures in a community‐based study of a distinct ethnic background: a middle‐income country with intense racial admixture. We also studied the relations between digital vascular function and carotid‐femoral pulse wave velocity (PWV), the gold‐standard measurement of arterial stiffness.10
Methods
Participants
The study sample derived from the Brazilian Longitudinal Study of Adult Health (ELSA‐Brasil), a multicenter cohort of 15 105 civil servants designed to investigate the determinants of CV diseases (CVDs) and diabetes. Eligibility criteria included active or retired employees of 5 universities and 1 research institute, aged 35 to 74 years, who volunteered to participate. Other details of concept and design were published elsewhere.15 Digital vascular function was assessed in participants at their baseline visit to the Minas Gerais Investigation Center, which enrolled 3115 participants. Given that PAT data acquisition began partway through the baseline visit, 1659 participants were eligible for vascular testing. In addition, 124 were excluded because of Raynaud's disease (n=1), radical mastectomy (n=3), patient refusal (n=2), hand abnormality (n=5), acute illness in the 12 hours before PAT exam (n=58), missing data file (n=2), use of nitrates (n=3), or technically inadequate studies (n=50). Technical inadequacy refers to insufficient flow occlusion (n=7), poor PAT signal quality (n=27), incomplete PAT data acquisition (n=4), and occlusion period >5:30 minutes (n=12). The Universidade Federal de Minas Gerais and the Brazilian National Ethics Committee approved the study, and all participants provided written informed consent.
Study Protocol
Participants were asked to refrain from eating, consuming alcohol or caffeine, and exercising 12 hours before the examinations. Medical history and socioeconomic factors were obtained by questionnaires. Race and current smoking were self‐reported. For race, participants could choose from a fixed set of categories based on the Brazilian Census classification: black; mixed; white; native Brazilian; or yellow. Yellow is used in Brazil for people of Asian origin. Physical activity was assessed by the short version of the International Physical Activity Questionnaire and participants were classified as low (<600), moderate (600 to 3000), or highly active (≥3000 metabolic equivalent‐min/week).16 Body mass index (BMI) was calculated as weight in kilograms divided by height in meters squared. Abdominal obesity was defined as waist circumference >88 cm for women and >102 cm for men. Blood pressure (BP) and heart rate (HR) were measured 3 times in the seated position after 5 minutes of rest. BP was measured automatically (Omron 765CP; Omron, Kyoto, Japan), in the left arm, 2 cm above the cubital fossa, and the average of the second and third measurements was used. PWV was obtained using an automatic device (Complior SP; Artech Medical, Paris, France) by dividing the suprasternal notch‐femoral distance by the difference in transit time between pulse waves measured at the carotid and femoral arteries. Blood samples were collected in the fasting state and after a 2‐hour oral 75 g of glucose load; blood analytes were measured according to a previous publication.15 The following definitions were used for CV risk factors: diabetes (fasting glucose ≥126 mg/dL, glucose after a tolerance test ≥200 mg/dL, hemoglobin A1c ≥6.5%, and self‐reported diabetes or treatment with insulin or a hypoglycemic agent); impaired fasting glucose (100 to 125 mg/dL); hypertension (HTN; systolic blood pressure [SBP] ≥140 mm Hg, diastolic blood pressure [DBP] ≥90 mm Hg, or use of hypertensive treatment); and prevalent CVD (self‐reported coronary artery disease, heart failure, or stroke).
Digital Vascular Measures
Digital vascular measures were obtained with an automated device (EndoPAT2000; Itamar Medical, Caesarea, Israel). The cuff was placed in the participant's nondominant arm, 2 cm above the cubital fossa, and PAT probes were placed on each index finger. Baseline pulse amplitude (BPA) was measured for 5 minutes. Arterial flow was interrupted on 1 side for 5 minutes by inflating the cuff at suprasystolic pressure. After 5 minutes, the cuff was deflated to induce reactive hyperemia, and the PAT signal was recorded for another 5 minutes. The contralateral finger was used to control for systemic changes. PAT ratio is the ratio of postdeflation pulse amplitude 90 to 120 seconds after cuff release to the mean BPA. This result is divided by the corresponding ratio from the control finger and transformed to its natural logarithm. PAT ratio has been shown to best reflect the variability of reactive hyperemia that can be explained by CV risk factors and includes the 90‐ to 120‐seconds interval, which is the maximum vasodilation period (Figure 1) and is dependent on NO.3,6 PAT‐AIx is calculated by the device by averaging the BPA data and using the formula: PAT‐AIx=(P2−P1)×100/P1(%) (Figure 2).10 The reproducibility of PAT in ELSA‐Brasil has been published elsewhere.17
Figure 1.

Pulse amplitude response in the hyperemic finger. Values plotted for peripheral arterial tonometry (PAT) hyperemic response are the mean value for the ratio of postdeflation pulse amplitude to baseline of the full ELSA‐Brasil sample according to time in seconds after cuff release. The region of interest used to calculate PAT ratio is shown by the black arrow (90 to 120 seconds).
Figure 2.

Peripheral arterial tonometry (PAT)‐derived pulse waveform. Augmentation index measures the contribution that wave reflection makes to the arterial pressure waveform and is expressed as a percentage of pulse pressure. It is calculated by the formula: (P2−P1)×100/P1(%).
Statistical Analyses
Dichotomous variables are expressed as frequencies and continuous variables as mean±SD, unless stated otherwise. BPA, triglycerides, and C‐reactive protein (CRP) were transformed to their natural logarithm because of skewed distributions. To determine the correlates of digital vascular measures, adjusting for age and sex we calculated partial correlation coefficients for SBP, DBP, HR, BMI, CRP, ratio of total to high‐density lipoprotein (HDL) cholesterol, triglycerides, fasting glucose, diabetes, abdominal obesity, smoking, HTN, lipid‐lowering and HTN medication, prevalent CVD, physical activity status, level of education, and annual family income. We then performed step‐wise multivariable regression models, in which age and sex were forced in and the variables listed above, except the last 3 and HTN, were allowed to enter the models (P<0.10 to enter and P<0.05 to stay). No collinearity between variables was found using the tolerance test and the variance inflation factor analysis. HR and height were included in all PAT‐AIx models. Secondarily, we tested whether there was an effect modification by sex on the association of age and vascular measures. We analyzed the sex×age effect modification by multivariable regression models, in which we forced sex and age in and then included the CV risk factors that we had previously found significant for each digital vascular measure and an “interaction variable,” created by multiplying sex (dichotomized) by age (treated as a continuous variable). We also stratified participants according to the presence of normal (NFG) or impaired fasting glucose (IFG) or diabetes to relate these groups to the digital vascular measures.
Univariate general linear models accounting for age, sex, CV risk factors, and socioeconomic status variables were used to examine the relation of race and digital vascular function. Because we did not have many Asians or Native Brazilians, they were not included in the race analyses. For CV risk factors, all variables above except CRP and abdominal obesity were included in the models.
To evaluate the correlation between vascular measures, we estimated partial correlation coefficients for BPA, PAT ratio, PAT‐AIx, and PWV, adjusted for age, sex, HR, and height, and then in the multivariable model adjusted for CV risk factors, as described above.
All analyses were performed using SPSS 20 (SPSS, Inc., Chicago, IL). Two‐sided P<0.05 were considered statistically significant, except in the post‐hoc pair‐wise comparisons between the 3 racial groups per vascular measure, in which we used Bonferroni's adjustment (P<0.0167) for multiple comparisons.
Results
Participant Characteristics and Vascular Measures
Table 1 shows the characteristics of participants: the mean age was 52±9 years, 44% were women, and 50.8% were white. The proportion of Asians (2.5%) and Native Brazilians (0.5%) was low. Overall, the mean fasting glucose was high, contributing to an elevated prevalence of diabetes and IFG. Prevalences of HTN, diabetes, and smoking were higher for black individuals, whereas white individuals had higher values of total/HDL cholesterol and triglycerides than their black counterparts. Participants of mixed race had intermediate values between black and white individuals for most characteristics. A high proportion of sedentary and highly educated participants were observed, the latter reflecting the work‐based origin of the sample; however, there was a greater proportion of black individuals with lower level of education and annual family income, both related to lower socioeconomic status. For the digital vascular function measures in the overall sample (Table 2), except for PAT‐AIx, men had more‐impaired responses than women.
Table 1.
Clinical and Socioeconomic Characteristics of Participants
| Characteristic | Overall (n=1535) | Blacks (n=179) | Mixed (n=521) | Whites (n=768) |
|---|---|---|---|---|
| Sex, women % | 44 | 41 | 42 | 45 |
| Age, y | 52±9 | 52±8 | 51±8 | 52±9 |
| Systolic blood pressure, mmHg | 122±17 | 129±22 | 122±16 | 120±17 |
| Diastolic blood pressure, mm Hg | 78±11 | 81±13 | 79±11 | 77±10 |
| Heart rate, bpm | 69±10 | 70±10 | 69±10 | 69±10 |
| Height, cm | 167±9 | 167±9 | 166±9 | 167±10 |
| Body mass index, kg/m2 | 26.8±4.6 | 27.3±4.8 | 26.9±4.4 | 26.6±4.8 |
| C‐reactive protein*, mg/dL | 1.45 (0.74 to 3.17) | 1.63 (0.80 to 4.00) | 1.51 (0.74 to 3.27) | 1.42 (0.73 to 2.99) |
| Total/HDL cholesterol | 4.09±1.04 | 3.87±0.97 | 4.15±1.07 | 4.10±1.04 |
| Triglycerides*, mg/dL | 115 (83 to 172) | 110 (74 to 162) | 116 (84 to 173) | 117 (83 to 172) |
| Fasting glucose, mg/dL | 111±31 | 118±42 | 112±32 | 108±25 |
| Impaired fasting glucose, % | 53 | 49 | 54 | 53 |
| Diabetes mellitus, % | 16 | 26 | 17 | 14 |
| Smoking, % | 12 | 16 | 12 | 12 |
| Hypertension, % | 37 | 53 | 37 | 33 |
| Abdominal obesity, % | 35 | 37 | 37 | 34 |
| Hypertension treatment, % | 28 | 38 | 29 | 26 |
| Lipid‐lowering treatment, % | 13 | 11 | 11 | 15 |
| Prevalent cardiovascular disease, % | 4 | 6 | 5 | 4 |
| Physical activity status, % | ||||
| Sedentary | 61 | 70 | 62 | 60 |
| Moderately active | 35 | 29 | 35 | 37 |
| Active | 4 | 1 | 4 | 4 |
| Level of education, % | ||||
| <High school | 9 | 22 | 12 | 4 |
| High school | 28 | 46 | 35 | 18 |
| College | 63 | 32 | 54 | 78 |
| Annual family income, US$ | ||||
| <20 000 | 33 | 63 | 42 | 19 |
| 20 000 to 45 000 | 40 | 32 | 39 | 42 |
| >45 000 | 27 | 6 | 18 | 40 |
Asian and Native Brazilians data are not shown because of low numbers (2.5% and 0.5%, respectively). Race was not reported by 21 participants. HDL indicates high‐density level.
C‐reactive protein and triglycerides are presented as median (interquartile range).
Table 2.
Digital Vascular Measures Overall and by Race, Stratified by Sex
| Measure | Sex | Overall | Blacks | Mixed | Whites |
|---|---|---|---|---|---|
| BPA | Men | 6.28±0.73 | 6.09±0.72 | 6.27±0.78 | 6.34±0.69 |
| Women | 5.65±0.82 | 5.47±0.83 | 5.63±0.79 | 5.72±0.84 | |
| PAT ratio | Men | 0.39±0.33 | 0.52±0.35 | 0.39±0.33 | 0.36±0.32 |
| Women | 0.61±0.38 | 0.75±0.36 | 0.62±0.35 | 0.58±0.39 | |
| PAT‐AIx, % | Men | 7.27±15.82 | 12.39±19.68 | 7.90±14.96 | 5.58±15.01 |
| Women | 16.67±16.59 | 20.03±21.05 | 15.87±15.42 | 16.24±15.97 | |
| PWV, m/s | Men | 9.7±1.7 | 10.3±1.9 | 9.5±1.5 | 9.7±1.7 |
| Women | 9.0±1.7 | 9.4±1.9 | 9.0±1.5 | 9.0±1.8 |
BPA indicates baseline pulse amplitude; PAT, peripheral arterial tonometry; PAT‐AIx, augmentation index derived from PAT; PWV, carotid‐femoral pulse wave velocity.
Clinical Correlates of Digital Vascular Measures
As shown in Table 3, male sex was related to higher BPA and lower PAT ratio and advancing age was associated with higher BPA. BPA was positively and PAT ratio was inversely associated with most CV risk factors, and these correlations were stronger for BPA. Prevalent CVD was inversely correlated to PAT ratio. Regarding PAT‐AIx, it was inversely correlated to male sex, BMI, abdominal obesity, and prevalent CVD, and directly correlated to age, SBP, DBP, smoking, and HTN. Socioeconomic variables were only correlated to PAT‐AIx.
Table 3.
Partial Correlations for Cardiovascular Risk Factors Adjusted for Age and Sex and Digital Vascular Measures
| Characteristic | BPA | PAT Ratio | PAT‐AIx* | |||
|---|---|---|---|---|---|---|
| r | P Value | r | P Value | r | P Value | |
| Sex (female=0, male=1) | 0.381 | <0.0001 | −0.289 | <0.0001 | −0.153 | <0.0001 |
| Age | 0.102 | <0.0001 | −0.048 | 0.06 | 0.331 | <0.0001 |
| Systolic blood pressure | 0.062 | 0.02 | 0.029 | 0.27 | 0.225 | <0.0001 |
| Diastolic blood pressure | 0.055 | 0.03 | −0.036 | 0.16 | 0.199 | <0.0001 |
| Heart rate | −0.007 | 0.80 | −0.049 | 0.06 | — | — |
| Body mass índex | 0.267 | <0.0001 | −0.181 | <0.0001 | −0.125 | <0.0001 |
| C‐reactive protein | 0.089 | 0.001 | −0.057 | 0.02 | 0.019 | 0.47 |
| Total cholesterol/HDL | 0.160 | <0.0001 | −0.130 | <0.0001 | −0.032 | 0.21 |
| Triglycerides | 0.179 | <0.0001 | −0.131 | 0.001 | −0.015 | 0.57 |
| Fasting glucose | 0.106 | <0.0001 | −0.065 | 0.01 | −0.009 | 0.73 |
| Diabetes mellitus | 0.091 | <0.0001 | −0.040 | 0.12 | 0.004 | 0.87 |
| Abdominal obesity | 0.182 | <0.0001 | −0.131 | <0.0001 | −0.072 | <0.005 |
| Smoking | 0.010 | 0.68 | 0.012 | 0.63 | 0.223 | <0.0001 |
| Hypertension | 0.081 | 0.001 | −0.037 | 0.15 | 0.118 | <0.0001 |
| Hypertension treatment | 0.085 | 0.001 | −0.102 | <0.0001 | 0.024 | 0.36 |
| Lipid‐lowering agents | 0.034 | 0.187 | −0.030 | 0.24 | −0.043 | 0.09 |
| Prevalent cardiovascular disease | 0.020 | 0.43 | −0.103 | <0.0001 | −0.053 | 0.04 |
| Physical activity status | −0.019 | 0.46 | −0.002 | 0.46 | −0.069 | 0.007 |
| Level of education | −0.020 | 0.43 | −0.011 | 0.67 | −0.165 | <0.0001 |
| Annual family income | 0.004 | 0.89 | −0.011 | 0.66 | −0.122 | <0.0001 |
Data are presented as partial correlation coefficient and P values. The first 2 rows represent sex adjusted for age and age adjusted for sex. BPA indicates baseline pulse amplitude; HDL, high‐density lipoprotein; PAT, peripheral arterial tonometry; PAT‐AIx, augmentation index derived from PAT.
PAT‐AIx was also adjusted for heart rate and height.
In multivariable models (Table 4), the factors positively correlated to BPA and inversely correlated to PAT ratio were male sex, BMI, and total cholesterol/HDL. Advancing age and higher triglycerides also related to higher BPA, whereas lower SBP, HTN treatment, and prevalent CVD was associated with lower PAT ratio. The correlates of higher PAT‐AIx were female sex, advancing age, SBP, DBP, and smoking, whereas increasing HR, height, BMI, and prevalent CVD were related to lower PAT‐AIx. The overall models explained 22%, 14%, and 38% of the variability of BPA, PAT ratio, and PAT‐AIx, respectively, and most of this variability was owing to sex.
Table 4.
Step‐wise Models of the Relation of Risk Factors to Digital Vascular Measures
| Characteristic | BPA | PAT Ratio | PAT‐AIx | ||||||
|---|---|---|---|---|---|---|---|---|---|
| β (SE) | Partial R2 | P Value | β (SE) | Partial R2 | P Value | β (SE) | Partial R2 | P Value | |
| Sex (F=0, M=1) | 0.56 (0.04) | 0.149 | <0.0001 | −0.20 (0.02) | 0.084 | <0.0001 | −9.31 (0.99) | 0.202 | <0.0001 |
| Age | 0.01 (0.01) | 0.005 | −0.01 (0.01) | 0.35 | 0.53 (0.05) | <0.0001 | |||
| Systolic BP | — | — | — | 0.01(0.01) | 0.004 | 0.003 | 0.15(0.04) | 0.039 | <0.0001 |
| Diastolic BP | — | — | — | — | — | — | 0.20 (0.06) | 0.005 | 0.001 |
| Heart rate | — | — | — | — | — | — | −0.50 (0.04) | 0.069 | <0.0001 |
| Height | — | — | — | — | — | — | −0.24 (0.05) | 0.008 | <0.0001 |
| BMI | 0.04 (0.01) | 0.061 | <0.0001 | −0.01 (0.01) | 0.030 | <0.0001 | −0.58 (0.08) | 0.019 | <0.0001 |
| Total/HDL cholesterol | 0.05 (0.02) | 0.002 | 0.04 | −0.04 (0 .01) | 0.008 | <0.0001 | — | — | — |
| Triglygerides | 0.12 (0.05) | 0.011 | 0.01 | — | — | — | — | — | — |
| Smoking | — | — | — | — | — | — | 10.39 (1.05) | 0.041 | <0.0001 |
| Hypertensive treatment | — | — | — | −0.05 (0.02) | 0.003 | 0.03 | — | — | — |
| Prevalent CVD | — | — | — | −0.16 (0.05) | 0.008 | <0.0001 | −3.55 (1.72) | 0.002 | 0.01 |
| Model R | 0.22 | 0.14 | 0.38 | ||||||
BMI indicates body mass index; BP, blood pressure; BPA, baseline pulse amplitude; CVD, cardiovascular disease; F, female; HDL, high‐density lipoprotein; M, male; PAT, peripheral arterial tonometry; PAT‐AIx, augmentation index derived from PAT.
Race‐Related Differences in Digital Vascular Function
Figure 3A shows that individuals of black race had significantly lower BPA and higher PAT ratio in adjusted models than mixed and white individuals, consistent with better vasodilator function, but higher PAT‐AIx. When individuals of mixed race were compared to whites, these differences were not significant. In models that included socioeconomic variables, the same pattern was observed for PAT ratio and PAT‐AIx. For BPA, the difference between mixed and white individuals became significant (Figure 3B).
Figure 3.
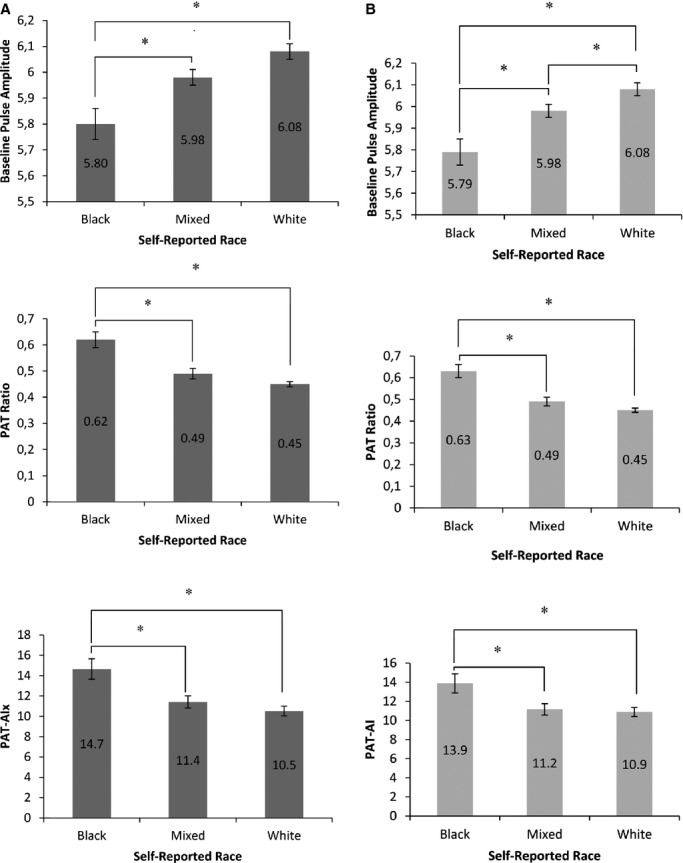
Vascular function measures by self‐reported race adjusted for age, sex, and cardiovascular risk factors (A) and with socioeconomic variables added to the models (B). Values reported are estimated means and standard errors. P<0.0001 for all models, with significance of differences between groups reported (*P≤0.0167). Asian and Native Brazilian participants were excluded from the analysis because of low numbers. PAT indicates peripheral arterial tonometry; PAT‐AIx, augmentation index derived from PAT.
Correlation of Vascular Function Measures
Table 5 reveals that, in models adjusted for sex, age, HR, and height, PAT‐AIx was directly associated with PAT ratio and PWV and inversely associated to BPA. Higher BPA was strongly associated with lower PAT ratio, and both were not correlated to PWV. In the model adjusted for CV risk factors, the correlations changed for PWV, which also was inversely associated with BPA.
Table 5.
Partial Correlations of Vascular Function Measures Adjusted for Age, Sex, Heart Rate, and Height and for Cardiovascular Risk Factors
| PAT‐AIx | BPA | PAT Ratio | ||||
|---|---|---|---|---|---|---|
| r | P Value | r | P Value | r | P Value | |
| Adjusted for age, sex, heart rate, and height | ||||||
| BPA | −0.277 | <0.0001 | — | — | — | — |
| PAT ratio | 0.340 | <0.0001 | −0.625 | <0.0001 | — | — |
| PWV | 0.134 | <0.0001 | 0.002 | 0.928 | 0.036 | 0.158 |
| Adjusted for cardiovascular risk factors | ||||||
| BPA | −0.274 | <0.0001 | — | — | — | — |
| PAT ratio | 0.326 | <0.0001 | −0.616 | <0.0001 | — | — |
| PWV | 0.080 | 0.002 | −0.059 | 0.02 | 0.043 | 0.09 |
Data are presented as partial correlation coefficients (r) and P values. BPA indicates baseline pulse amplitude; PAT, peripheral arterial tonometry; PAT‐AIx, augmentation index derived from PAT.
Secondary Analyses
Glucose metabolism profile
Higher BPA and lower PAT ratio were detected in participants with diabetes or IFG, when compared to participants with NFG (P<0.001). However, the difference between participants with diabetes and IFG was not significant (P=0.55 for BPA; P=1.00 for PAT ratio).
Effect modification by sex on the association of age and vascular measures
Effect modification by sex on the association of age and vascular measures was only observed for PAT‐AIx: The age estimated effect size for women was 0.39 and for men 0.61 (P<0.005), suggesting that the increase in PAT‐AIx with advancing age was greater in men than women. In the latter, it tended to plateau at the age of 55 years (Figure 4).
Figure 4.
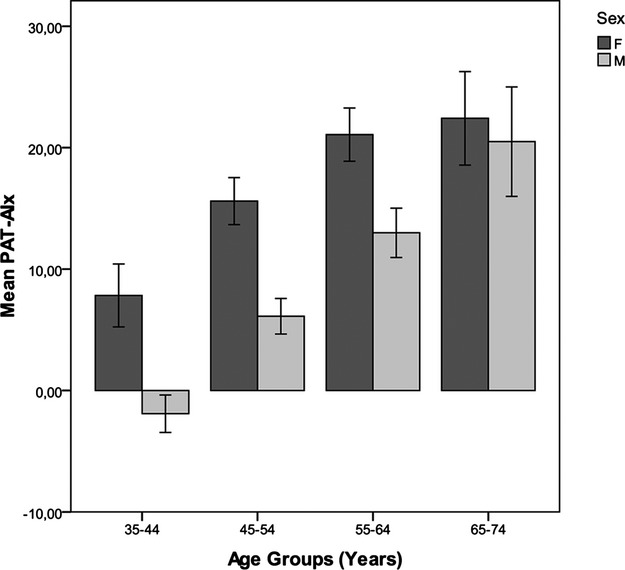
Effect modification by sex on the association of age and PAT‐AIx. Values plotted are mean PAT‐AIx for each age group and 95% confidence intervals. As displayed, the increase in PAT‐AIx with advancing age is greater in men than women, in whom it tended to plateau at the age of 55 years. F indicates female; M, male; PAT, peripheral arterial tonometry; PAT‐AIx, augmentation index derived from PAT.
Discussion
In a large Brazilian cohort representing a middle‐income country with a distinct racial background, we evaluated the correlation of CV risk factors and digital vascular measures, including basal microvascular tone (BPA), microvascular endothelial function (PAT ratio), and the contribution of wave reflection to pulse pressure (PAT‐AIx). We also extended previous work by analyzing the correlation between digital vascular measures and their relation to PWV, a measure of arterial stiffness. Our main findings are: (1) CV risk factors, particularly metabolic, relates to lower microvessel vasodilator function; however, in contrast to studies from the United States, self‐reported black race was associated with lower BPA and greater PAT ratio, indicating more‐favorable digital vasodilator response and suggesting that patterns of vascular function may vary by race across populations; (2) PAT‐AIx associates with CV risk factors, consistent with smaller studies that used PAT‐AIx and others that evaluated AIx obtained from radial tonometry, inferring that PAT‐AIx may be a valid measure of wave reflection; (3) the modest correlation of PAT‐AIx and PWV suggests that PAT‐AIx has complex determinants, including central aortic stiffness.
Previous studies have described the association of digital vascular tone and endothelial function with CV risk factors in U.S. and European studies.6–7,12 We now demonstrate similar associations in individuals from Brazil, a middle‐income country, where demographic and nutritional shifts are increasing the prevalences of metabolic risk factors that threaten to accelerate the incidence of CVDs.18–19 Indeed, we observed high prevalences of obesity, hyperlipidemia, and diabetes. We demonstrated that, in multivariable‐adjusted models, lower vasodilator function was associated with metabolic risk factors, including higher BMI, total cholesterol/HDL, and triglycerides. However, diabetes and fasting glucose were not associated with BPA and PAT ratio. We speculate that the lack of association may be owing to the high prevalence of participants with IFG in our sample, which could have reduced the difference in the vasomotor tone influenced by these variables. In fact, when participants were stratified according to NFG, IFG, or diabetes, the difference among the 3 groups was significant for BPA and PAT ratio, except between participants with IFG and diabetes. The associations of metabolic diseases with BPA and PAT ratio are consistent with the reported early damaging effects of oxidative stress and activation of proinflammatory mechanisms in the microvasculature caused by metabolic risk factors, resulting in less bioavailability of NO.20–21 The lack of association between age and PAT ratio herein described is in agreement with others and could be related to the distinct physiology of digital vasculature.22–23
When comparing data from the present study with other cohorts that used similar methodology, our results show that mean BPA and PAT ratio were more impaired in Brazilian adults, regardless of sex, and this difference was more substantial in whites than in black individuals.6–7,14 The greater impairment of digital vasodilator function in Brazilian adults might be a result of a higher prevalence of metabolic risk factors—especially diabetes—or a worse control of prevalent risk factors, reflecting the reversible aspect of endothelial dysfunction.1,24 Other hypotheses would be different risk profiles between the cohorts or characteristics of the Brazilian population. Given that multivariable models of CV risk factors only explained 22% of BPA and 14% of PAT ratio variability, we speculate that factors such as socioeconomic status, physical activity, and racial composition could partly account for the variability of PAT measures. However, no significant correlation between level of education, family income, or physical activity status and BPA or PAT ratio was found, similar to what was reported in American adults.14 The parallel findings in our study of vascular function in Brazil to previous investigations in high‐income countries may emphasize the importance of counteracting the trends toward increasing CV risk factors in the developing world.
Regarding racial composition, previous studies in American adults have shown that black race is associated with vascular dysfunction assessed by PAT.12,14 The endothelial dysfunction in black subjects has been attributed to the reduction of NO bioavailability caused by a redox state as a result of more production of superoxide (O2−).25 However, we found that black race in Brazil was associated with a more favorable vascular response, compared to white and mixed race, which persisted when accounting for concomitant CV risk factors and socioeconomic status. The composition of the Brazilian population is an admixture of diverse ethnic backgrounds: Portuguese settlers and other European immigrants; African slaves; Native Brazilians; and a small proportion of Asians.26 The Brazilian racial admixture may provide an explanation for the above‐cited findings given that, irrespective of race self‐identification, most Brazilians share European, African, and Native ancestries, making self‐reported race a poor surrogate for genetic ancestry in this country.26–27 In fact, Brazilians use the term “skin color” instead of race, reflecting that “‘racial” categorization depends not on ancestry, but on the physical appearance of the individual.26 Taken together, our findings suggest that the association of race and vascular function may vary across countries and confirm the need for additional studies to determine the genetic contributions to racial variability in vascular function.
The CV risk factors and racial correlations mentioned above were stronger for BPA than for PAT ratio, as previously reported, suggesting that the CV risk factors are more associated with structural changes.6–7 A question that arises, supported by the strong correlation between PAT ratio and BPA, is how much of the PAT ratio association with risk factors is the result of BPA and not the response to hyperemia. The influence of the resting pulse amplitude may be a physiological effect given that the already higher pulse amplitude may preclude vasodilation, or a mathematical effect, because PAT ratio is calculated using BPA in the denominator.1
In the present study, we extended previous work by showing the relation of digital vascular measures to arterial stiffness and found that BPA and PAT ratio were not correlated to PWV. Although a relationship between aortic stiffness and forearm microvascular function had been shown, this association had not yet been studied with the digital circulation.28 The lack of correlation between aortic stiffness and BPA and PAT ratio is consistent with the lack of association between BPA and PAT ratio with age or blood pressure and with the proposed initial damage of different vascular beds by specific risk factors.7,22
Regarding PAT‐AIx, higher values correlated with factors known to make the reflected wave return earlier in the cardiac cycle: lower stature and HR.29 A higher PAT‐AIx also was associated with female sex, advancing age, higher SBP and DBP, smoking, and black race. Other unexpected correlations were observed: lower PAT‐AIx related to prevalent CVD and higher BMI. When evaluated by radial tonometry, a higher AIx has been associated with CV outcomes.10 Women had significantly higher PAT‐Aix, even when accounting for height, and this difference decreased with advancing age, leading to speculation about a role for hormonal effects. The counterintuitive association between female sex and PAT‐AIx has been repeatedly described and attributed to different arterial biomechanical properties according to sex.30 The multivariable model explained 38% of PAT‐AIx variability; however, the risk factors associations with this measure were different from the correlates of BPA and PAT ratio, suggesting that they reflect different aspects of vascular impairment. Lower level of physical activity, education, and annual family income also were correlated to PAT‐AIx, inferring that lifetime exposure to adverse conditions may contribute to specific vascular dysfunction phenotypes.
There is considerable interest in measuring arterial stiffness as a predictor of HTN and CV risk. The PAT‐AIx is a novel approach to determine AIx that would allow an assessment of vasodilator response and stiffness properties during the same test. Previous studies have stated that PAT‐AIx is a surrogate measure of arterial stiffness.10 However, the positive correlation between PAT‐AIx and PWV was modest, consistent with the fact that pulse pressure augmentation has multiple components in addition to the contribution of central aortic stiffness.10,29,31 Indeed, higher AIx was associated with lower BPA, reflecting reduced peripheral compliance. Interestingly, higher PAT‐AIx was associated with higher hyperemic response, which may indicate that greater wave reflection is protective of the microcirculation by limiting the amount of energy transmitted from the forward wave to the microvessels.29 In contrast with our findings, a relationship between decreased NO and higher central AIx has been demonstrated and attributed to changes in the amplitude of the reflected wave.32 Therefore, in light of our results, the mechanisms underlying PAT‐AIx must be further elucidated.
Limitations of the current study must be considered. Because of its observational design, we could not evaluate endothelium‐independent vasodilation or preclude the use of medications. Given that our study is a cross‐sectional analysis, causal relations and the temporality of associations cannot be established. It also must be acknowledged that we only evaluated vascular function in the digits, and the evaluation in different vascular beds may provide complementary information.7,22 Regarding the ELSA‐Brasil cohort study, it may not be a representative sample of Brazilian adults, given that its participants are employed civil servants, mainly living in urban areas, and for the present study only from 1 center.15,26 To counterbalance these limitations, the strengths of our study include: a large multiethnic sample; the community‐based nature of the cohort; and a comprehensive assessment of vascular function and CV risk factors.
Perspectives
Although Brazil is living in a distinct epidemiological moment, when compared to U.S. and European countries, PAT basal tone and hyperemic response are correlated with metabolic risk factors similar to those found in cohorts from these high‐income countries. Our data corroborate the importance of vascular health in the incremental burden of CVDs in middle‐income countries. The unanticipated relations found between endothelial function and race reinforce the need for further examination of racial variation using genetic information and preclude the extrapolation of data from more‐homogeneous populations to countries with intense racial admixture. Regarding the vascular measures relations, our study suggests that PAT‐AIx may be a valid measure of wave reflection, influenced by arterial stiffness, and microvessel vasodilator function. Although it is attractive to perform 3 vascular measures with a single exam, before PAT can be applied in clinical settings, the mechanisms underlying alterations in each measure must be more clearly elucidated. Furthermore, prospective data are needed to evaluate whether digital vascular function is able to predict clinical disease, if it can guide treatment, or if it has incremental value for CV risk stratification beyond traditional risk factors.
Sources of Funding
The ELSA‐Brasil baseline study was supported by the Brazilian Ministries of Health and of Science and Technology (grants 01060010.00RS, 01060212.00BA, 01060300.00ES, 01060278.00MG, 01060115.00SP, and 01060071.00RJ). This ancillary study was supported by FAPEMIG (Minas Gerais, Brazil). Santander Bank supported the collaboration between Boston University and Universidade Federal de Minas Gerais. A.L.P.R. and S.M.B. are recipients of an award for established researchers from CNPq. Ribeiro is also a supported by a research grant (Pesquisador Mineiro) from FAPEMIG, the research agency of the State of Minas Gerais, Brazil.
Disclosures
None.
Acknowledgments
The authors thank the staff and participants of ELSA‐Brasil for their important contributions.
References
- 1.Flammer AJ, Anderson T, Celermajer DS, Creager MA, Deanfield J, Ganz P, Hamburg NM, Luscher TF, Shechter M, Taddei S, Vita JA, Lerman A. The assessment of endothelial function: from research into clinical practice. Circulation. 2012; 126:753-767. [DOI] [PMC free article] [PubMed] [Google Scholar]
- 2.Hamburg NM, Benjamin EJ. Assessment of endothelial function using digital pulse amplitude tonometry. Trends Cardiovasc Med. 2009; 19:6-11. [DOI] [PMC free article] [PubMed] [Google Scholar]
- 3.Nohria A, Gerhard‐Herman M, Creager MA, Hurley S, Mitra D, Ganz P. Role of nitric oxide in the regulation of digital pulse volume amplitude in humans. J Appl Physiol. 2006; 101:545-548. [DOI] [PubMed] [Google Scholar]
- 4.Bonetti PO, Pumper GM, Higano ST, Holmes DR, Jr, Kuvin JT, Lerman A. Noninvasive identification of patients with early coronary atherosclerosis by assessment of digital reactive hyperemia. J Am Coll Cardiol. 2004; 44:2137-2141. [DOI] [PubMed] [Google Scholar]
- 5.Matsuzawa Y, Sugiyama S, Sugamura K, Nozaki T, Ohba K, Konishi M, Matsubara J, Sumida H, Kaikita K, Kojima S, Nagayoshi Y, Yamamuro M, Izumiya Y, Iwashita S, Matsui K, Jinnouchi H, Kimura K, Umemura S, Ogawa H. Digital assessment of endothelial function and ischemic heart disease in women. J Am Coll Cardiol. 2010; 55:1688-1696. [DOI] [PubMed] [Google Scholar]
- 6.Hamburg NM, Keyes MJ, Larson MG, Vasan RS, Schnabel R, Pryde MM, Mitchell GF, Sheffy J, Vita JA, Benjamin EJ. Cross‐sectional relations of digital vascular function to cardiovascular risk factors in the Framingham Heart Study. Circulation. 2008; 117:2467-2474. [DOI] [PMC free article] [PubMed] [Google Scholar]
- 7.Schnabel RB, Schulz A, Wild PS, Sinning CR, Wilde S, Eleftheriadis M, Herkenhoff S, Zeller T, Lubos E, Lackner KJ, Warnholtz A, Gori T, Blankenberg S, Munzel T. Noninvasive vascular function measurement in the community: cross‐sectional relations and comparison of methods. Circ Cardiovasc Imaging. 2011; 4:371-380. [DOI] [PubMed] [Google Scholar]
- 8.Rubinshtein R, Kuvin JT, Soffler M, Lennon RJ, Lavi S, Nelson RE, Pumper GM, Lerman LO, Lerman A. Assessment of endothelial function by non‐invasive peripheral arterial tonometry predicts late cardiovascular adverse events. Eur Heart J. 2010; 31:1142-1148. [DOI] [PubMed] [Google Scholar]
- 9.Matsuzawa Y, Sugiyama S, Sumida H, Sugamura K, Nozaki T, Ohba K, Matsubara J, Kurokawa H, Fujisue K, Konishi M, Akiyama E, Suzuki H, Nagayoshi Y, Yamamuro M, Sakamoto K, Iwashita S, Jinnouchi H, Taguri M, Morita S, Matsui K, Kimura K, Umemura S, Ogawa H. Peripheral endothelial function and cardiovascular events in high‐risk patients. J Am Heart Assoc. 2013; 2:e00042610.1161/JAHA.113.000426 [DOI] [PMC free article] [PubMed] [Google Scholar]
- 10.Laurent S, Cockcroft J, Van Bortel L, Boutouyrie P, Giannattasio C, Hayoz D, Pannier B, Vlachopoulos C, Wilkinson I, Struijker‐Boudier H. Expert consensus document on arterial stiffness: methodological issues and clinical applications. Eur Heart J. 2006; 27:2588-2605. [DOI] [PubMed] [Google Scholar]
- 11.Haller MJ, Silverstein JH, Shuster JJ. Correlation between radial artery tonometry‐ and fingertip tonometry‐derived augmentation index in children with type 1 diabetes. Diab Vasc Dis Res. 2007; 4:66. [DOI] [PubMed] [Google Scholar]
- 12.Morris AA, Patel RS, Binongo JN, Poole J, Mheid IA, Ahmed Y, Stoyanova N, Vaccarino V, Din‐Dzietham R, Gibbons GH, Quyyumi A. Racial differences in arterial stiffness and microcirculatory function between black and white Americans. J Am Heart Assoc. 2013; 2:e00215410.1161/JAHA.112.002154 [DOI] [PMC free article] [PubMed] [Google Scholar]
- 13.Patvardhan E, Heffernan KS, Ruan J, Hession M, Warner P, Karas RH, Kuvin JT. Augmentation index derived from peripheral arterial tonometry correlates with cardiovascular risk factors. Cardiol Res Pract. 2011; 2011:253758. [DOI] [PMC free article] [PubMed] [Google Scholar]
- 14.Mulukutla SR, Venkitachalam L, Bambs C, Kip KE, Aiyer A, Marroquin OC, Reis SE. Black race is associated with digital artery endothelial dysfunction: results from the Heart SCORE Study. Eur Heart J. 2010; 31:2808-2815. [DOI] [PubMed] [Google Scholar]
- 15.Aquino EM, Barreto SM, Bensenor IM, Carvalho MS, Chor D, Duncan BB, Lotufo PA, Mill JG, Molina Mdel C, Mota EL, Passos VM, Schmidt MI, Szklo M. Brazilian Longitudinal Study of Adult Health (ELSA‐Brasil): objectives and design. Am J Epidemiol. 2012; 175:315-324. [DOI] [PubMed] [Google Scholar]
- 16.Craig CL, Marshall AL, Sjostrom M, Bauman AE, Booth ML, Ainsworth BE, Pratt M, Ekelund U, Yngve A, Sallis JF, Oja P. International physical activity questionnaire: 12‐country reliability and validity. Med Sci Sports Exerc. 2003; 35:1381-1395. [DOI] [PubMed] [Google Scholar]
- 17.Brant LC, Barreto SM, Passos VM, Ribeiro AL. Reproducibility of peripheral arterial tonometry for the assessment of endothelial function in adults. J Hypertens. 2013; 31:1984-1990. [DOI] [PubMed] [Google Scholar]
- 18.Yusuf S, Reddy S, Ounpuu S, Anand S. Global burden of cardiovascular diseases: Part I: general considerations, the epidemiologic transition, risk factors, and impact of urbanization. Circulation. 2001; 104:2746-2753. [DOI] [PubMed] [Google Scholar]
- 19.Schmidt MI, Duncan BB, Azevedo e Silva G, Menezes AM, Monteiro CA, Barreto SM, Chor D, Menezes PR. Chronic non‐communicable diseases in Brazil: burden and current challenges. Lancet. 2011; 377:1949-1961. [DOI] [PubMed] [Google Scholar]
- 20.Jonk AM, Houben AJ, de Jongh RT, Serne EH, Schaper NC, Stehouwer CD. Microvascular dysfunction in obesity: a potential mechanism in the pathogenesis of obesity‐associated insulin resistance and hypertension. Physiology. 2007; 22:252-260. [DOI] [PubMed] [Google Scholar]
- 21.Tabit CE, Chung WB, Hamburg NM, Vita JA. Endothelial dysfunction in diabetes mellitus: molecular mechanisms and clinical implications. Rev Endocr Metab Disord. 2010; 11:61-74. [DOI] [PMC free article] [PubMed] [Google Scholar]
- 22.Hamburg NM, Palmisano J, Larson MG, Sullivan LM, Lehman BT, Vasan RS, Levy D, Mitchell GF, Vita JA, Benjamin EJ. Relation of brachial and digital measures of vascular function in the community: the Framingham Heart Study. Hypertension. 2011; 57:390-396. [DOI] [PMC free article] [PubMed] [Google Scholar]
- 23.Coffman JD. Effects of endothelium‐derived nitric oxide on skin and digital blood flow in humans. Am J Physiol. 1994; 267:H2087-H2090. [DOI] [PubMed] [Google Scholar]
- 24.Yusuf S, Rangarajan S, Teo K, Islam S, Li W, Liu L, Bo J, Lou Q, Lu F, Liu T, Yu L, Zhang S, Mony P, Swaminathan S, Mohan V, Gupta R, Kumar R, Vijayakumar K, Lear S, Anand S, Wielgosz A, Diaz R, Avezum A, Lopez‐Jaramillo P, Lanas F, Yusoff K, Ismail N, Iqbal R, Rahman O, Rosengren A, Yusufali A, Kelishadi R, Kruger A, Puoane T, Szuba A, Chifamba J, Oguz A, McQueen M, McKee M, Dagenais G. Cardiovascular risk and events in 17 low‐, middle‐, and high‐income countries. N Engl J Med. 2014; 371:818-827. [DOI] [PubMed] [Google Scholar]
- 25.Kalinowski L, Dobrucki IT, Malinski T. Race‐specific differences in endothelial function: predisposition of African Americans to vascular diseases. Circulation. 2004; 109:2511-2517. [DOI] [PubMed] [Google Scholar]
- 26.Pena SD, Di Pietro G, Fuchshuber‐Moraes M, Genro JP, Hutz MH, Kehdy Fde S, Kohlrausch F, Magno LA, Montenegro RC, Moraes MO, de Moraes ME, de Moraes MR, Ojopi EB, Perini JA, Racciopi C, Ribeiro‐Dos‐Santos AK, Rios‐Santos F, Romano‐Silva MA, Sortica VA, Suarez‐Kurtz G. The genomic ancestry of individuals from different geographical regions of Brazil is more uniform than expected. PLoS One. 2011; 6:e17063. [DOI] [PMC free article] [PubMed] [Google Scholar]
- 27.Lins TC, Vieira RG, Abreu BS, Gentil P, Moreno‐Lima R, Oliveira RJ, Pereira RW. Genetic heterogeneity of self‐reported ancestry groups in an admixed Brazilian population. J Epidemiol. 2011; 21:240-245. [DOI] [PMC free article] [PubMed] [Google Scholar]
- 28.Mitchell GF, Vita JA, Larson MG, Parise H, Keyes MJ, Warner E, Vasan RS, Levy D, Benjamin EJ. Cross‐sectional relations of peripheral microvascular function, cardiovascular disease risk factors, and aortic stiffness: The Framingham Heart Study. Circulation. 2005; 112:3722-3728. [DOI] [PubMed] [Google Scholar]
- 29.Mitchell GF, Parise H, Benjamin EJ, Larson MG, Keyes MJ, Vita JA, Vasan RS, Levy D. Changes in arterial stiffness and wave reflection with advancing age in healthy men and women: The Framingham Heart Study. Hypertension. 2004; 43:1239-1245. [DOI] [PubMed] [Google Scholar]
- 30.Rossi P, Frances Y, Kingwell BA, Ahimastos AA. Gender differences in artery wall biomechanical properties throughout life. J Hypertens. 2011; 29:1023-1033. [DOI] [PubMed] [Google Scholar]
- 31.Mitchell GF, Hwang SJ, Vasan RS, Larson MG, Pencina MJ, Hamburg NM, Vita JA, Levy D, Benjamin EJ. Arterial stiffness and cardiovascular events: the Framingham Heart Study. Circulation. 2010; 121:505-511. [DOI] [PMC free article] [PubMed] [Google Scholar]
- 32.Weber T, Maas R, Auer J, Lamm G, Lassnig E, Rammer M, O'Rourke MF, Boger RH, Eber B. Arterial wave reflections and determinants of endothelial function a hypothesis based on peripheral mode of action. Am J Hypertens. 2007; 20:256-262. [DOI] [PubMed] [Google Scholar]