

Abstract
Background
Ataxia‐telangiectasia results from mutations in ataxia telangiectasia mutated kinase (ATM) gene. We recently reported that ATM deficiency attenuates left ventricular (LV) dysfunction and dilatation 7 days after myocardial infarction (MI) with increased apoptosis and fibrosis. Here we investigated the role of ATM in the induction of inflammatory response, and activation of survival signaling molecules in the heart acute post‐MI.
Methods and Results
LV structure, function, inflammatory response, and biochemical parameters were measured in wild‐type (WT) and ATM heterozygous knockout (hKO) mice 1 and 3 days post‐MI. ATM deficiency had no effect on infarct size. MI‐induced decline in heart function, as measured by changes in percent fractional shortening, ejection fraction and LV end systolic and diastolic volumes, was lower in hKO‐MI versus WT‐MI (n=10 to 12). The number of neutrophils and macrophages was significantly lower in the infarct LV region of hKO versus WT 1 day post‐MI. Fibrosis and expression of α‐smooth muscle actin (myofibroblast marker) were higher in hKO‐MI, while active TGF‐β1 levels were higher in the WT‐MI 3 days post‐MI. Myocyte cross‐sectional area was higher in hKO‐sham with no difference between the two MI groups. MMP‐9 protein levels were similarly increased in the infarct LV region of both MI groups. Apoptosis was significantly higher in the infarct LV region of hKO at both time points. Akt activation was lower, while Bax expression was higher in hKO‐MI infarct.
Conclusion
ATM deficiency results in decreased dilative remodeling and delays inflammatory response acute post‐MI. However, it associates with increased fibrosis and apoptosis.
Keywords: apoptosis, ATM, cardiac remodeling, fibrosis, inflammation, myocardial infarction
Introduction
Ataxia‐telangiectasia (A‐T) is a rare autosomal recessive genetic disorder that causes neurological degeneration. It is caused by mutations in the gene encoding for ataxia telangiectasia mutated kinase (ATM).1 This disease affects approximately 1 in 40 000 births in the United States.2 A‐T individuals are predisposed to the development of cancer, usually lymphoid cancer. In addition, these individuals suffer from immunological problems resulting in frequent sino‐pulmonary infections.2 Both humoral and cell‐mediated immunity are affected, the latter showing itself in the form of lymphopenia.3 Individuals who are recessive for this mutation usually die 7 to 8 years earlier than non‐carriers as a result of either cancer or ischemic heart disease.4
ATM, a ≈370 kDa protein kinase, is a member of the phosphatidylinositol 3‐kinase‐like protein kinase (PIKK) family. Genotoxic stress, oxidative stress, and growth factors affect ATM gene expression in various cell types.5–6 ATM is activated in response to DNA double‐strand breaks caused by ionizing radiation and V(D)J recombination in B and T lymphocyte development.3 It is also shown to be activated in cells exposed to hypoxia, insulin, and reactive oxygen species independent of DNA damage. ATM activation affects cell cycle checkpoints, apoptotic signaling, senescence, and DNA repair.7
Myocardial infarction (MI) induces cardiac cell death due to apoptosis and necrosis, thereby initiating the inflammatory process. Neutrophils are the first inflammatory cells recruited to the infarct area.8 Infiltration of neutrophils occurs within hours and peaks 1 to 3 days post‐MI.9 Neutrophils facilitate the post‐MI repair process by engulfing dead cells and tissue debris.8 During the inflammatory process cytokines such as TNF‐α, IL‐1β, and IL‐6 are induced.10–11 Neutrophils then undergo apoptosis generating annexin A1 and lactoferrin, which inhibits neutrophil recruitment and attracts phagocytic macrophages to remove neutrophils. Once the macrophages have engulfed the neutrophils, they activate the anti‐inflammatory pathway by producing molecules such as IL‐10 and TGF‐β marking the end of the inflammatory phase of infarct healing and the beginning of the proliferative phase of healing.12 During the proliferative phase, activated fibroblast (myofibroblast) produce extracellular matrix proteins aiding in the scar formation.8 Our previous work examined the role of ATM in myocardial remodeling post‐MI during the proliferative phase of infarct healing. We reported that ATM deficiency attenuates LV dysfunction and dilatation 7 days post‐MI. In addition, we provided evidence that ATM deficiency results in increased cardiac fibrosis and expression of α‐smooth muscle actin (α‐SMA, a marker for myofibroblasts) in the infarct region 7 days post‐MI.13 The objective of this study was to investigate the role of ATM deficiency in cardiac remodeling during the inflammatory phase of infarct healing. A major finding of this study is that deficiency of ATM associates with decreased inflammatory response and dilative remodeling early post‐MI without affecting infarct size. ATM deficiency also affects apoptosis, fibrosis, expression of proteins involved in fibrosis and inflammation, and activation of apoptosis‐related kinases.
Methods
Vertebrate Animals
This investigation conforms to the Guide for the Care and Use of Laboratory Animals published by the US National Institutes of Health (NIH Publication No. 85‐23, revised 1996). All of the experiments were performed in accordance with the protocols approved by the East Tennessee State University Animal Care and Use Committee. ATM transgenic mice (129xblack Swiss hybrid background) were purchased from Jackson Laboratory. Aged‐matched (≈4 month old) male and female mice were used for the study. The study used heterozygous knockout (hKO) mice since homozygous knockout (KO) mice die at ≈2 months of age mainly due to thymic lymphomas.14 Genotyping was performed by PCR using primers suggested by the Jackson Laboratory.
Myocardial Infarction
Myocardial infarction (MI) was performed as previously described.13 Briefly, mice were anesthetized using a mixture of isoflurane (2%) and oxygen (0.5 L/min), and maintained under anesthesia using isoflurane (1%) and oxygen (0.5 L/min). The mice were ventilated using a rodent ventilator. Body temperature was maintained at ≈37⁰C using a heating pad. Heart was exposed by a left thoracotomy followed by the ligation of left anterior descending artery (LAD) using 7‐0 polypropylene suture. Mice in the sham group underwent the same procedure without the ligation of LAD. At the end of the study period, 1 or 3 days post‐MI, isolated hearts were used for either histology or for molecular analyses.
Echocardiography
Transthoracic 2‐dimensional m‐mode echocardiography was performed using a Toshiba Aplio 80 Imaging System (Tochigi, Japan) equipped with a 12 MHz linear transducer as previously described.15 An individual blinded to the experimental groups recorded the cardiac structural parameters. A second individual read the recordings and calculated the functional parameters of the heart.
Morphometric Analyses
Following MI, hearts were removed and arrested in diastole using KCl (30 mmol/L). After fixing with 10% buffered formalin, hearts were cut into 3 transverse sections (base, mid‐LV, and apex) and embedded in paraffin. Cross‐sections (4 μm think) were stained using Masson's Trichrome stain in order to determine infarct size 3 days post‐MI. Infarct size was calculated as the percentage of LV circumference occupied by infarct scar.13 Infarct size 1 day post‐MI was calculated using TTC stained hearts as previously described.16 Masson's Trichrome stained sections were also used to quantify percent fibrosis.
Myocyte Cross‐Sectional Area
To measure myocyte cross‐sectional area, cross‐sections (4 μm thick) of the heart were stained with FITC‐labeled wheat germ agglutinin (WGA). The sections were visualized using fluorescent microscopy (20X; Nikon) and images were recorded using Retiga 1300 color‐cooled camera. Suitable area of the section was defined as the one with nearly circular capillary profiles and nuclei. Myocyte cross‐sectional areas were measured using Bioquant Image analysis software (Nashville, TN) as described.15
Terminal Deoxynucleotidyl Transferase Nick End Labeling (TUNEL Staining) Assay
TUNEL staining was carried out according to the manufacturer's instruction (Cell death detection assay; Roche).13 Sections were counterstained with Hoechst 33258 (Sigma) to identify nuclei. The index of apoptosis was calculated as the percentage of apoptotic nuclei/total number of nuclei.
Immunohistochemistry
Cross‐sections of the heart (4 μm thick) were deparaffinized and immunostained for neutrophils and macrophages using anti‐neutrophil (1:100; Santa Cruz) and anti‐F4/80 (macrophage; 1:200; Santa Cruz) antibodies, respectively. Detection was performed using ABC staining system (Santa Cruz). Sections were counterstained with 1% eosin. Expression of α‐SMA serves as a marker for the differentiation of fibroblasts into myofibroblasts.17 To examine expression of α‐SMA, heart sections were immunostained using anti‐α‐SMA antibodies (Sigma) as described.13 Images were acquired using Nikon TE‐2000 microscope equipped with a Regita‐1300 color‐cooled camera. Quantitative analysis was carried using Bioquant Image analysis software (Nashville, TN). At least 5 different images within the infarct area from each heart were used for quantitative purposes. Images acquired from the septal wall represented non‐infarct LV region. Images from the sham group were acquired from various regions around the LV.
Western Blot Analyses
LV lysates were prepared in RIPA buffer, separated by SDS‐PAGE and transferred to PVDF membranes. The membranes were blocked using either 5% non‐fat dry milk or 5% BSA in TBST. The membranes were then incubated overnight with antibodies against ATM, TGF‐β, Bax (Santa Cruz), MMP‐9 (Millipore), Bcl‐2, p‐Akt (ser‐473), or p‐GSK‐3β (ser‐9) (Cell Signaling). GAPDH (Santa Cruz) immunostaining or Ponceau‐S staining was used as the protein‐loading control. Band intensities were quantified using Kodak photo documentation system (Eastman Kodak Co).
MMP Activity
Gelatin in‐gel zymography was used to determine activity of MMP‐9 as previously described.18 Clear digested bands were quantified using Kodak photo documentation system (Eastman Kodak Co).
Statistical Analyses
Data are presented as mean±SEM: Shapiro‐Wilk test was used to assess the normality of the data. One‐way analysis of variance (ANOVA) or Kruskal‐Wallis was used for multiple comparisons. Pairwise comparisons were carried out using either Student t test or Mann–Whitney U test (2‐sample). When comparing BW before and after surgery, a 2‐tailed paired t test was used. Survival between the 2 genotypes was analyzed using Kaplan‐Meier survival analysis. Probability (P) values of <0.05 were considered to be significant.
Results
ATM Expression in the Heart Post‐MI
To investigate expression of ATM in the heart post‐MI, left ventricular (LV) lysates were prepared from the infarct and non‐infarct LV regions of WT and hKO 1 and 3 days post‐MI. LV lysate prepared from ATM KO heart served as a negative control. Western blot analysis using anti‐ATM antibodies showed complete absence of ATM protein (≈370 kDa) in the LV lysate prepared from the KO heart (Figure 1A; lane 1). A faint signal for ATM was observed in WT‐sham sample (data not shown). However, clear signal for ATM protein was observed in the non‐infarct and infarct LV regions of WT and hKO hearts 1 and 3 days post‐MI (Figure 1A and 1B). ATM protein levels were higher in the infarct LV regions when compared with the non‐infarct LV regions. Overall, ATM protein levels were lower (≈50%) in non‐infarct and infarct LV regions of hKO when compared with the WT counterparts.
Figure 1.
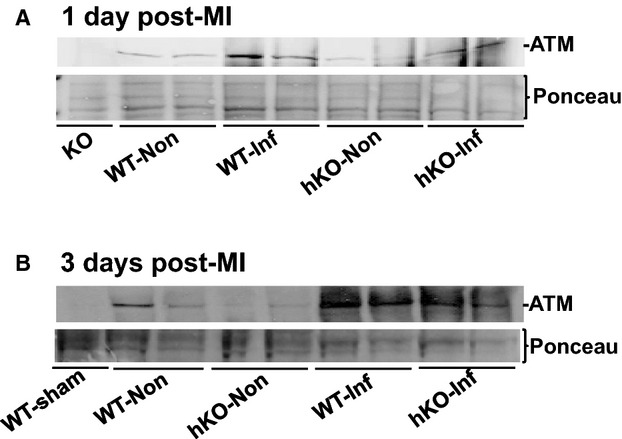
MI increases ATM expression in the heart. LV lysates prepared from WT‐sham, ATM KO, and non‐infarct (Non) and infarct (Inf) LV regions of WT and hKO 1 and 3 days post‐MI were analyzed by Western blot using anti‐ATM antibodies. A, 1 day post‐MI; B, 3 days post‐MI. Protein loading is indicated by Ponceau‐S staining. ATM indicates ataxia telangiectasia mutated; hKO, heterozygous knockout; KO, knockout; LV, left ventricle; MI, myocardial infarction; WT, wild‐type.
Morphological Analyses
No significant difference in morphometric parameters was observed between 1‐ and 3‐day sham groups; therefore, 1‐ and 3‐day sham groups were pooled. Surgery (sham or MI) significantly decreased body weights (BW) when compared with the pre‐surgery BW with no significant differences between the 2 genotypes. MI increased heart weights (HW) 3 days post‐MI in both genotypes with no significant difference between the 2 genotypes. HW/BW ratios were significantly higher 1 and 3 days post‐MI when compared to their respective sham with no significant differences between the 2 genotypes (Table 1). Infarct sizes between the 2 genotypes were not different at either 1 day or 3 days post‐MI (Table 2). The survival rate for both genotypes 1 day post‐MI was 100%, while it was 98.4% for WT and 86.2% for hKO 3 days post‐MI with no significant difference between the 2 groups.
Table 1.
Morphometric Measurements
| Pre‐BW | BW | HW | HW/BW | |
|---|---|---|---|---|
| Sham | ||||
| WT (n=11) | 26.87±0.82 | 23.96±1.11* | 124.46±4.02 | 4.73±0.11 |
| hKO (n=11) | 26.49±0.68 | 22.78±0.77* | 121.03±4.78 | 4.96±0.21 |
| 1 day post‐MI | ||||
| WT‐MI (n=17) | 28.38±1.04 | 24.21±1.06* | 135.53±6.98 | 5.17±0.23# |
| hKO‐MI (n=11) | 26.5±1.07 | 24.69±2.43* | 134.01±5.12 | 5.61±0.14# |
| 3 days post‐MI | ||||
| WT‐MI (n=15) | 24.93±0.89 | 22.28±0.80* | 143.90±4.91# | 6.43±0.24# |
| hKO‐MI (n=20) | 25.39±0.68 | 23.07±0.61* | 140.17±7.51# | 6.07±0.27# |
Values are mean±SEM. BW indicates body weight; hKO, heterozygous knockout; HW, heart weight; MI, myocardial infarction; WT, wild‐type. *P<0.001 vs pre‐BW; #P<0.05 vs Sham.
Table 2.
Infarct Size and Myocyte Cross‐Sectional Area
| Percent Infarct | Cross Sectional Area (mm2) | |
|---|---|---|
| Sham | ||
| WT (n=8) | NA | 185.06±5.08 |
| hKO (n=7 to 8) | NA | 203.72±6.64* |
| 1 day post‐MI | ||
| WT‐MI (n=4 to 7) | 32.64±4.07 | 213.23±9.0# |
| hKO‐MI (n=4 to 6) | 35.13±6.08 | 203.92±6.19 |
| 3 days post‐MI | ||
| WT‐MI (n=5 to 6) | 50.41± 2.41 | 211.36±7.29# |
| hKO‐MI (n=5 to 7) | 51.09±5.78 | 204.50±8.19 |
Values are mean±SEM. hKO, heterozygous knockout; WT, wild‐type; MI, myocardial infarction. #P<0.05 vs Sham, *P<0.05 vs WT‐Sham.
Echocardiographic Studies
Figure 2A exhibits M‐mode echocardiography images obtained from sham and MI (1 day post‐MI) groups. No significant difference in echocardiographic parameters was observed between 1‐ and 3‐day sham groups. Therefore, 1‐ and 3‐day sham groups were pooled. A significant decrease (P<0.05) in heart function, as evidenced by a decrease in percent fractional shortening (%FS) and ejection fraction (EF), was observed at 1 and 3 days post‐MI in both genotypes when compared to their respective sham groups. However, the decrease in %FS and EF was significantly lower in hKO‐MI versus WT‐MI 1 day post‐MI. No significant differences in %FS and EF were observed between the 2 genotypes 3 days post‐MI (Figure 2B and 2C). Increased LV end‐systolic volume (LVESV) is considered as a predictor of mortality post‐MI.19 WT‐MI group exhibited a significant increase in LVESV and LV end‐diastolic volume (LVEDV) 1 and 3 days post‐MI when compared with WT‐sham. In hKO‐MI, a significant increase in LVESV and LVEDV was observed 1 day, not 3 days, post‐MI when compared with hKO‐sham. Interestingly, LVESV and LVEDV were significantly higher in WT‐MI versus hKO‐MI at both time points (Figure 2D and 2E).
Figure 2.
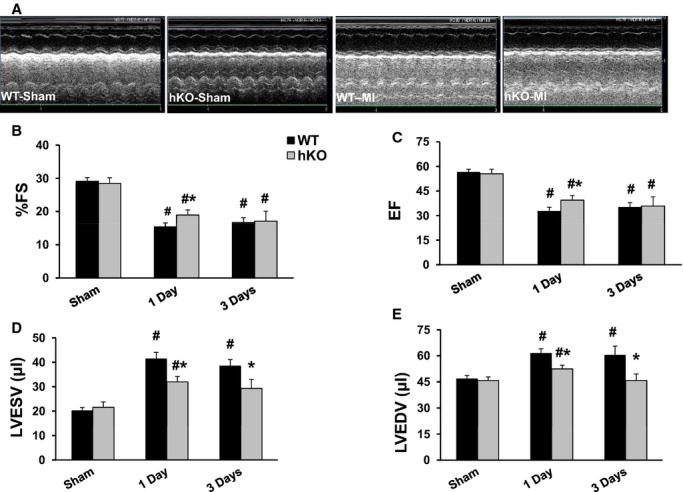
ATM deficiency improves LV function. MI was performed in WT and hKO mice. A, M‐mode echocardiographic images obtained from sham and 1 day post‐MI groups. Indices of cardiac function (percent fractional shortening, %FS; ejection fraction, EF) and volume (LV end systolic volume, LVESV; LV end diastolic volume, LVEDV) were calculated using echocardiographic images 1 and 3 days post‐MI. #P<0.005 vs Sham, *P<0.05 vs WT‐MI; n=10 to 12. ATM indicates ataxia telangiectasia mutated; hKO, heterozygous knockout; LV, left ventricle; MI, myocardial infarction; WT, wild‐type.
Inflammatory Cell Infiltration
Sham groups exhibited the presence of only a few neutrophils in the heart with no significant difference between the 2 genotypes. MI increased the number of neutrophils in the infarct LV regions of both genotypes at both time points when compared with their respective sham groups (Figure 3A and 3B). A significant increase in neutrophil number was also observed in the non‐infarct LV region of WT group 1 day post‐MI versus WT‐sham (Figure 3A). Interestingly, the number of neutrophils was significantly lower in the infarct and non‐infarct LV regions of hKO‐MI when compared with WT‐MI 1 day post‐MI (Figure 3A). The number of neutrophils in the infarct LV region decreased significantly in both MI groups 3 days post‐MI. However, the number stayed higher in the infarct LV regions when compared with the sham groups and non‐infarct LV regions in both genotypes. There was no significant difference in the number of neutrophils between the 2 genotypes 3 days post‐MI, although the number of neutrophils in the non‐infarct LV region of hKO‐MI was significantly higher when compared with hKO‐sham (Figure 3B).
Figure 3.
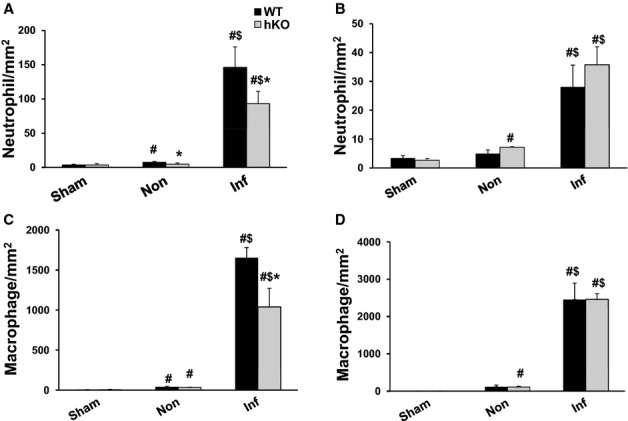
ATM deficiency results in decreased inflammatory cells in the infarct LV region 1 day post‐MI. Cross‐sections of the heart post‐MI were immunostained using anti‐neutrophil (A and B) and anti‐F4/80 (macrophage; C and D) antibodies. The number of immune‐positive cells was quantified using Bioquant Image analysis software. Quantitative analyses of neutrophils 1 (A) and 3 (B) days post‐MI. Quantitative analyses of macrophages 1 (C) and 3 (D) days post‐MI. #P<0.05 vs Sham, $P<0.05 vs Non, *P<0.05 vs WT; n=4 to 6. ATM indicates ataxia telangiectasia mutated; hKO, heterozygous knockout; Inf, infarct; LV, left ventricle; MI, myocardial infarction; WT, wild‐type.
Sham groups exhibited the presence of a few macrophages in the heart with no significant difference between the 2 genotypes. MI increased the number of macrophages in the infarct and non‐infarct LV regions of both genotypes when compared with their respective sham groups. However, the number of macrophages was significantly lower (P<0.05) in the infarct LV region of hKO‐MI versus WT‐MI 1 day post‐MI (Figure 3C). Three days post‐MI, the number of macrophages was still higher in the infarct LV regions of both genotypes when compared with their respective sham groups, however, there was no significant difference between the 2 genotypes. In addition, the number of macrophages in the non‐infarct LV region of hKO‐MI was significantly higher when compared with hKO‐sham (Figure 3D).
Fibrosis, Apoptosis, and Myocyte Cross‐Sectional Area
Quantitative analysis of fibrosis using Masson's Trichrome‐stained sections revealed no change in fibrosis between 1‐ and 3‐day sham groups, therefore the sham groups were pooled. The amount of fibrosis was significantly higher in hKO‐sham versus WT‐sham. MI increased fibrosis in the infarct LV region of both groups 3 days post‐MI. However, the amount of fibrosis was significantly higher in hKO‐MI versus WT‐MI (Figure 4).
Figure 4.
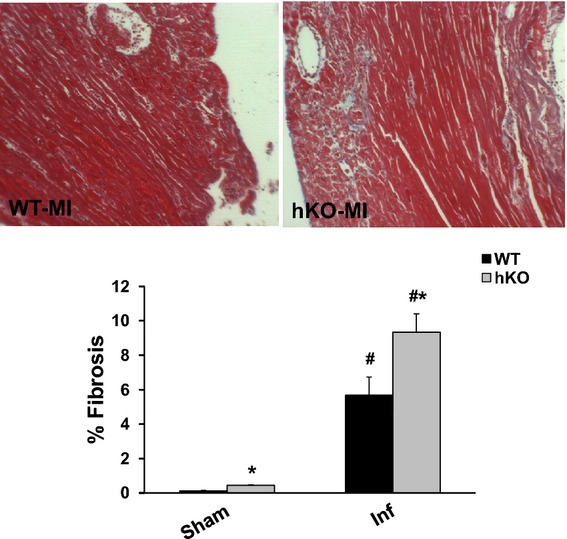
ATM deficiency results in increased fibrosis. Masson's trichrome stained sections of the heart were used for quantitative measurement of fibrosis. Upper panel depicts Masson's trichrome‐stained sections exhibiting fibrosis in WT and hKO hearts 3 days post‐MI. Lower panel exhibits quantitative analysis of fibrosis. #P<0.05 vs Sham, *P<0.05 vs WT‐MI; n=5 to 6. ATM indicates ataxia telangiectasia mutated; hKO, heterozygous knockout; Inf, infarct; MI, myocardial infarction; WT, wild‐type.
Only a few apoptotic cells were detected in the sham and non‐infarct LV regions of WT‐MI and hKO‐MI 1 day post‐MI. MI significantly increased the number of apoptotic cells in the infarct LV region of both genotypes 1 day post‐MI (Figure 5A). However, the number of apoptotic cells was significantly greater in the hKO‐MI (P<0.05) versus WT‐MI. Three days post‐MI, the level of apoptosis in the infarct LV regions decreased in both genotypes versus 1 day post‐MI. However, it remained higher when compared with their respective sham groups and non‐infarct LV regions (Figure 5B). Interestingly, hKO‐MI continued to have a significantly higher number of apoptotic cells (P<0.05) in the infarct LV region versus WT‐MI. hKO‐MI also exhibited a significant increase (P<0.05) in apoptosis in the non‐infarct LV region when compared with hKO‐sham and non‐infarct WT‐MI.
Figure 5.
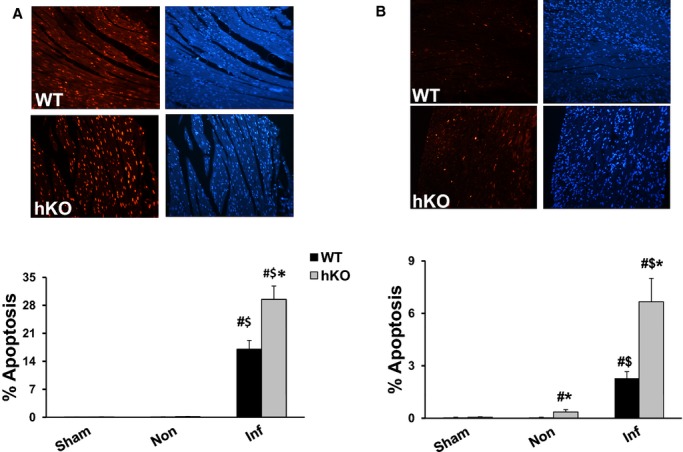
ATM deficiency results in enhanced apoptosis post‐MI. Quantitative analysis of cardiac cell apoptosis in the non‐infarct (Non) and infarct (Inf) LV regions 1 (A) and 3 (B) days post‐MI. Upper panels depict TUNEL‐stained and Hoechst‐stained images obtained from WT and hKO hearts 1 and 3 days post‐MI. Red fluorescent staining indicates TUNEL‐positive (apoptotic) nuclei, while blue fluorescent staining indicates total number of nuclei. The lower panels exhibit quantitative analysis. #P<0.05 vs Sham *P<0.05 vs WT, $P<0.05 vs Non; n=4 to 6. ATM indicates ataxia telangiectasia mutated; hKO, heterozygous knockout; Inf, infarct; LV, left ventricle; MI, myocardial infarction; WT, wild‐type.
Myocyte cross‐sectional area was significantly higher in hKO‐sham group versus WT‐sham. Myocyte cross‐sectional area in the non‐infarct LV region remained unchanged in the hKO‐MI group 1 and 3 days post‐MI. However, a significant increase in myocyte cross‐sectional area was observed in WT‐MI group when compared with WT‐sham 1 and 3 days post‐MI (Table 2).
Expression of TGF‐β1
The anti‐inflammatory cytokine TGF‐β1 plays an important role in myocardial remodeling post‐MI via its involvement in the differentiation of fibroblasts into myofibroblasts and ECM deposition.8 One source of TGF‐β1 is macrophages as they phagocytose apoptotic neutrophils.12 Western blot analysis showed no presence of active TGF‐β1 protein (23 kDa band) in the sham groups, non‐infarct or infarct LV regions 1 day post‐MI (data not shown). Presence of active TGF‐β1 band was only observed in the infarct LV regions of both genotypes 3 days post‐MI. However, the levels of active TGF‐β1 were significantly higher in the WT‐MI versus hKO‐MI (Figure 6).
Figure 6.
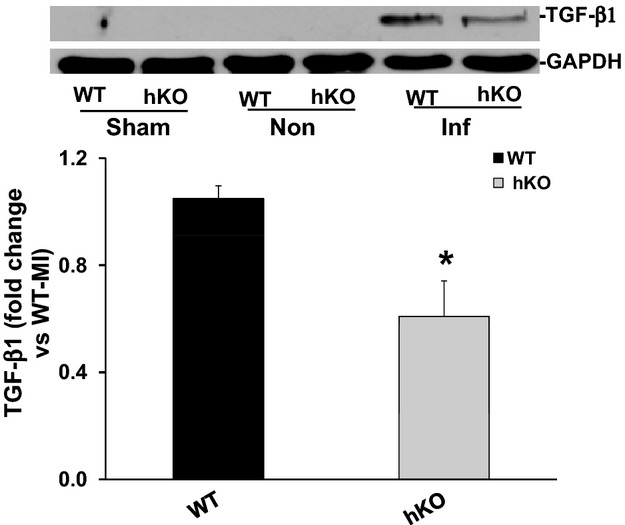
Expression of TGF‐β1. Total LV lysates, prepared from sham and non‐infarct (Non) and infarct (Inf) LV regions 3 days post‐MI, were analyzed by Western blot using anti‐TGF‐β1 antibodies. The upper panel depicts autoradiogram indicating immunostaining for active TGF‐β1 (≈26 kDa band) and GAPDH. The lower panel exhibits quantitative analysis of TGF‐β1 in the Inf LV regions of WT and hKO groups normalized to GAPDH. *P<0.05 vs WT‐Inf; n=8 to 9. hKO indicates heterozygous knockout; Inf, infarct; LV, left ventricle; MI, myocardial infarction; TGF‐β1, transforming growth factor‐beta 1; WT, wild‐type.
Expression of α‐Smooth Muscle Actin (α‐SMA)
Increased α‐SMA expression is considered as a marker for the differentiation of fibroblasts into myofibroblast.20 One day post‐MI, little to no expression of α‐SMA expression was observed in the infarct LV regions of either group (data not shown). Three days post‐MI, a significant increase in α‐SMA expression was observed in the infarct LV region of both genotypes when compared with their respective sham groups. However, the increase in α‐SMA expression was significantly higher (P<0.05) in hKO‐MI versus WT‐MI (Figure 7).
Figure 7.
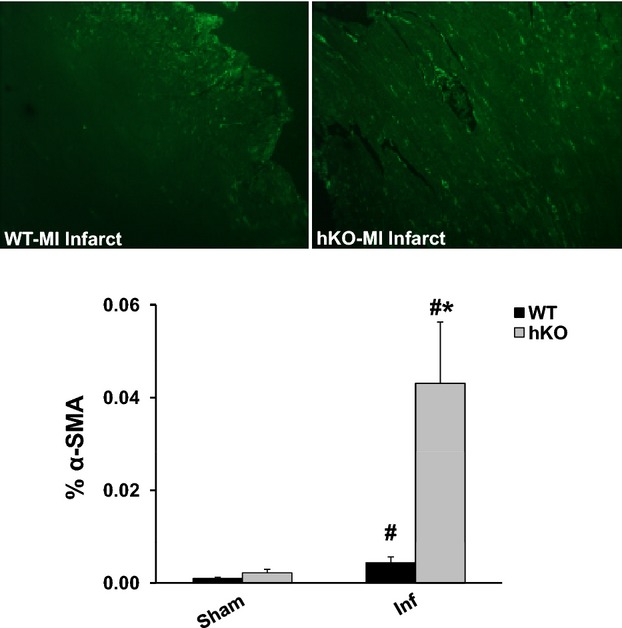
Quantitative analysis of α‐smooth muscle actin (α‐SMA) expression. Cross‐sections of the heart were immunostained using anti‐α‐SMA antibodies. Upper panel depicts α‐SMA‐stained images from the infarct (Inf) LV regions of WT and hKO hearts 3 days post‐MI. Lower panel exhibits quantitative immunocytochemical analysis of α‐SMA in sham and Inf LV regions 3 days post‐MI. #P<0.05 vs Sham, *P<0.05 vs WT‐Inf; n=4 to 5. hKO indicates heterozygous knockout; LV, left ventricle; MI, myocardial infarction; WT, wild‐type.
Expression and Activity of MMP‐9
MMP‐9 regulates the remodeling processes of the heart that involves inflammation and fibrosis.21 MMP‐9 levels in the ischemic region of the heart increase within minutes after MI and stay higher during the first few days in animal models.21–22 Western blot analysis revealed increased MMP‐9 protein levels in the infarct LV regions of both genotypes 1 day post‐MI when compared with their respective sham groups. However, no significant differences were observed between the 2 genotypes (Figure 8A). MMP‐9 expression remained higher in the infarct LV regions of both genotypes 3 days post‐MI with no significant difference between the 2 genotypes (Figure 8B). In‐gel zymography revealed increased MMP‐9 activity in the infarct LV regions of both genotypes (data not shown).
Figure 8.
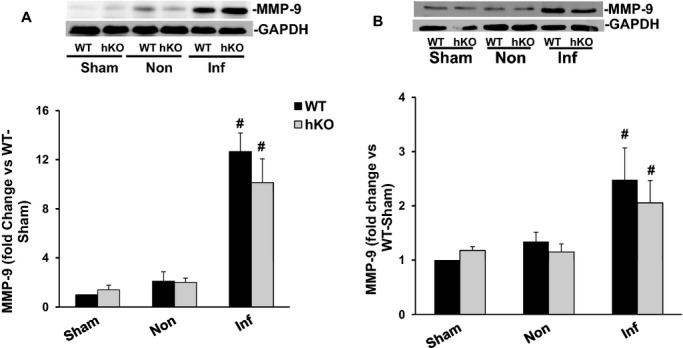
Expression of MMP‐9. Total LV lysates, prepared from sham, non‐infarct (Non) and infarct (Inf) LV regions 1 and 3 day post‐MI, were analyzed by Western blot using anti‐MMP‐9 antibodies. The upper panels depict autoradiograms indicating immunostaining for MMP‐9 and GAPDH. The lower panels exhibit quantitative analyses of MMP‐9 normalized to GAPDH. A, MMP‐9 protein levels 1 day post‐MI (n=6). B, MMP‐9 protein levels 3 days post‐MI (n=5) #P<0.05 vs sham. hKO indicates heterozygous knockout; Inf, infarct; LV, left ventricle; MI, myocardial infarction; MMP, matrix metalloproteinase; WT, wild‐type.
Activation and Expression of Apoptosis‐Related Proteins
Increased phosphorylation (activation) of Akt is generally considered as an anti‐apoptotic signal.23 Phosphorylation of Akt remained unchanged in the WT‐MI 1 day post‐MI. However, Akt phosphorylation was significantly lower in the non‐infarct and infarct LV regions of hKO‐MI versus hKO‐sham. In addition, Akt phosphorylation was significantly lower in the hKO‐MI infarct LV region versus WT‐MI infarct LV region (Figure 9A). No significant change in Akt phosphorylation was observed among the groups 3 days post‐MI (data not shown).
Figure 9.
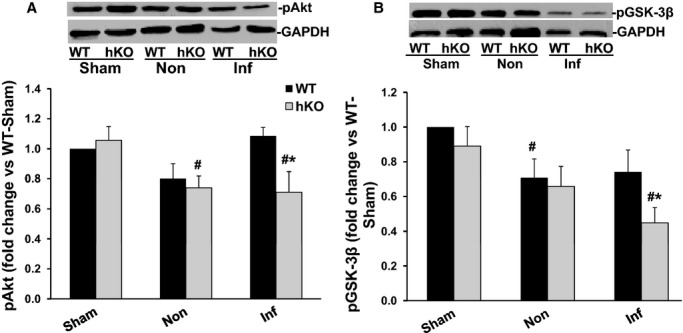
Phosphorylation of Akt and GSK‐3β. Total LV lysates, prepared from sham, non‐infarct (Non) and infarct (Inf) LV regions 1 day post‐MI, were analyzed by Western blot using phospho‐specific antibodies for Akt (ser‐473) and GSK‐3β (ser‐9). The upper panels depict autoradiograms indicating immunostaining for p‐Akt, p‐GSK‐3β and GAPDH. The lower panels exhibit quantitative analyses of p‐Akt (A) and p‐GSK‐3β (B) normalized to GAPDH. #P<0.05 vs Sham; *P<0.05 vs WT‐Inf; n=6. GSK, glycogen synthase kinase; hKO indicates heterozygous knockout; LV, left ventricle; MI, myocardial infarction; WT, wild‐type.
Activation of GSK‐3β plays a pro‐apoptotic role in β‐adrenergic receptor‐stimulated apoptosis.24 Phosphorylation of N‐terminal serine‐9 inactivates GSK‐3β.25 GSK‐3β phosphorylation (serine‐9) was lower in the non‐infarct LV region of WT‐MI versus WT‐sham 1 day post‐MI. In the infarct LV region, hKO‐MI exhibited a significant decrease in GSK‐3β phosphorylation when compared to hKO‐sham and WT‐MI infarct LV region (Figure 9B). Three days post‐MI, GSK‐3β phosphorylation was significantly lower (P<0.05) in infarct and non‐infarct region of both WT and hKO mice when compared with their respective sham groups with no significant difference between the 2 MI groups (data not shown).
Bax, a pro‐apoptotic protein, is a transmembrane protein located in the outer mitochondrial membrane. Homodimerization of Bax increases cytochrome c release resulting in the induction of apoptosis. Bcl‐2 can inhibit Bax induced apoptosis by forming a heterodimer with Bax.26 Western blot analyses showed no difference in Bax or Bcl‐2 protein levels between the 2 genotypes in the infarct LV regions 1 day post‐MI (data not shown). Bax expression was significantly higher in the infarct LV region of hKO when compared to WT group 3 days post‐MI. However, there was no significant difference in Bcl2 expression between the 2 genotypes 3 days post‐MI (Figure 10).
Figure 10.
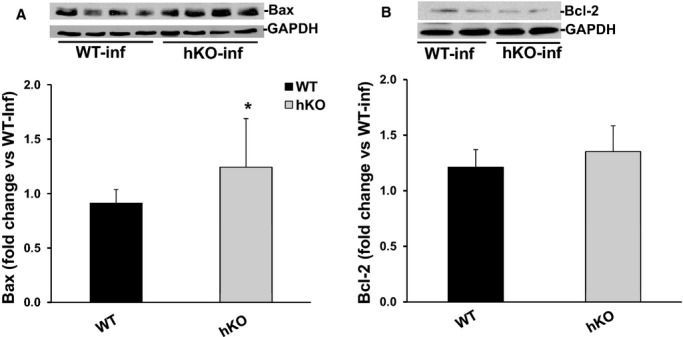
Expression of Bax and Bcl‐2. Total LV lysates, prepared from infarct LV regions 3 days post‐MI, were analyzed by Western blot using anti‐Bax and anti‐Bcl‐2 antibodies. The upper panels depict autoradiograms indicating immunostaining for Bax (A), Bcl‐2 (B) and GAPDH. The lower panels exhibit quantitative analyses of Bax (A) and Bcl‐2 (B) normalized to GAPDH. *P<0.05 vs WT‐MI; n=6 to 8. hKO indicates heterozygous knockout; Inf, infarct; LV, left ventricle; MI, myocardial infarction; WT, wild‐type.
Discussion
Previously we provided evidence that ATM deficiency results in improved heart function and decreased LV dilatation 7 days post‐MI. A major finding of this study is that ATM deficiency associates with delayed inflammatory response post‐MI. This is evidenced by the decreased number of neutrophils and macrophages 1 day post‐MI, and decreased expression of TGF‐β1 in the infarct area 3 days post‐MI. ATM deficiency also associated with increased apoptosis, fibrosis and expression of α‐SMA in the heart post‐MI. Activation of pro‐survival kinase, Akt, was lower, while activation of pro‐apoptotic kinase, GSK‐3β, was higher in ATM deficient hearts 1 day post‐MI. The data presented here support our previous findings,13 and suggest multifaceted role of ATM in myocardial remodeling post‐MI.
ATM normally becomes activated in response to DNA damage, particularly due to the formation of DNA double‐strand breaks. This activation occurs due to its autophosphorylation on Ser1981.27 Genotoxic agents, oxidative stress and growth factors also increase ATM expression in certain cell types.5–6 In peripheral blood mononuclear cells, maximum increase in ATM expression in response to mitogenic stimuli was observed 3 to 4 days after exposure.6 Previously, we have shown that β‐AR stimulation increases ATM expression in adult rat ventricular myocytes and heart.28 This study provides evidence that MI increases ATM expression in the heart. The increase in ATM could be a result of either increased sympathetic nerve activity and/or increased oxidative stress, both of which increase in the heart following MI.29–30
MI usually leads to increased chamber diameter which results in increased loading capacity of the heart represented by increased LVESV and LVEDV. Increased LVESV is suggested as one of the major determinants of survival post‐MI.19 Previously, we provided evidence that deficiency of ATM attenuates LV dysfunction and dilatation 7 days post‐MI.13 The data presented here suggest that the attenuation of LV dysfunction and dilation during ATM deficiency can be observed as early as 1 day post‐MI. ATM deficient mice exhibit a lesser degree of impairment in systolic parameters as evidenced by higher %FS and EF 1 day post‐MI. It was interesting to note that %FS and EF were not different between the 2 genotypes 3 days post‐MI, although LVESV and LVEDV were significantly lower in ATM‐deficient hearts at both time points. The better LV function 1 day post‐MI during ATM deficiency did not correlate with infarct size since infarct sizes remained unchanged between the 2 genotypes 1 and 3 days post‐MI. Other factors such as infarct thickness, myocardial fibrosis, and myocyte hypertrophy also influence heart function post‐MI.31 ATM deficient hearts exhibited increased infarct thickness, increased fibrosis and increased α‐SMA expression 7 days post‐MI.13 While increased levels of fibrosis late post‐MI is a predictor of heart failure, early fibrosis may play a protective role in the healing process by preventing infarct expansion.32 Infarct thickness remained unchanged between the 2 genotypes 1 and 3 days post‐MI. Expression of α‐SMA was higher in ATM deficient hearts 3 days post‐MI. Therefore, slightly better function exhibited by ATM deficient hearts 1 day post‐MI cannot be explained by infarct thickness or expression of α‐SMA. ATM deficiency associates with increased myocyte cross‐sectional area and fibrosis at basal levels, and results in delayed inflammatory response post‐MI. Therefore, myocyte hypertrophy, myocardial fibrosis and delayed inflammatory response may help explain better function during ATM deficiency 1 day post‐MI.
Neutrophils begin to infiltrate into the infarcted myocardium within hours of the ischemic event peaking 24 hours post‐MI.9 Neutrophil infiltration activates resident monocytes to differentiate into macrophage in the infarct LV region shortly after MI. Macrophage number stays relatively stable from 1 to 7 days post MI.12 Macrophages play a number of roles in post‐MI healing process. They phagocytose dead cells, tissue debris, and apoptotic neutrophils. In addition, they secret MMPs and their inhibitors to aid in extracellular matrix reorganization.12 Consistent with these data, we observed increased number of neutrophils and macrophages in the myocardium of both genotypes at both time points. Interestingly, the number of inflammatory cells was significantly lower in ATM‐deficient hearts 1 day post‐MI. Three days post‐MI, the number of neutrophils decreased, while the number of macrophages increased in the infarct LV regions of both genotypes. However, the number of neutrophils and macrophages was not significantly different between the 2 genotypes. These data suggest a delayed inflammatory response during ATM deficiency early post‐MI. Neutrophils are recruited to the site of inflammation via chemokines and cytokines.8 However, signals such as lactoferrin and annexin 1 released by apoptotic cells can inhibit recruitment of neutrophils to the site of the injury.33–34 ATM‐deficient hearts exhibit increased apoptotic response when compared with their WT counterparts. This increase in apoptosis during ATM deficiency can have an inhibitory effect on neutrophil migration. A decrease in inflammatory receptors (selectins, integrins, and adhesion receptors) may also influence neutrophil recruitment.35 Further investigations are required to investigate the involvement of these molecular signals in the inflammatory response in the heart post‐MI during ATM deficiency.
Phagocytosis of neutrophils by macrophages initiates the release of anti‐inflammatory signal involved in resolution of inflammation.12 Suppression of inflammatory response may involve a variety of signals, including a secreted protein TGF‐β. TGF‐β1, an anti‐inflammatory signal, can affect infarct healing by modulating the release of cytokines and chemokines, synthesis of ECM proteins and transdifferentiation of fibroblasts into myofibroblasts.36 In rat MI model, increased expression of TGF‐β1 mRNA was observed 3 days post‐MI.37 Here we observed increased levels of active TGF‐β1 in the heart 3 days post‐MI. ATM deficiency associated with decreased macrophage count 1 day post‐MI and decreased active TGF‐β1 levels 3 days post‐MI. This is consistent with the fact that macrophages are a major producer of TGF‐β post‐MI.8 It is interesting to note that ATM deficiency also associates with increased expression of α‐SMA and fibrosis 3 days post‐MI. While TGF‐β is a known activator of fibroblast differentiation, TGF‐β alone does not trigger fibroblast differentiation. Myofibroblast transformation also requires specialized ECM proteins like the ED‐A splice variant of fibronectin as well as increased mechanical stress. Under normal conditions, fibroblasts are protected against mechanical stress via cross‐linkage of the ECM. During injury, the ECM begins remodeling itself leading to the activation of myofibroblast.38 Therefore, it is possible that the enhanced apoptosis in the heart during ATM deficiency increases mechanical stress leading to enhanced myofibroblast activation.
Extracellular matrix (ECM) plays a critical role in the restructuring of the heart post‐MI. Changes in MMP abundance and activity is shown to be associated with changes in ECM deposition and myocardial remodeling post‐MI.21 MMP‐9 levels increase in the heart within minutes and remain elevated during the first few days post‐MI.22,39 Previously, we have shown that ATM deficiency associates with higher MMP‐9 protein levels and activity in the infarct LV region 7 days post‐MI when compared with WT.13 Neutrophils are identified as a source of MMP‐9 during acute ischemia/reperfusion myocardial injury.40 This expression of MMP‐9 was suggested to aid in the migration of neutrophils. Here, we observed increased MMP‐9 protein levels in both genotypes at both time points. However, MMP‐9 protein levels were not different between the 2 MI groups. Furthermore, reduced neutrophil numbers did not result in reduced MMP‐9 expression during ATM deficiency, suggesting other cell types of the heart post‐MI may participate in MMP‐9 expression.21 Of note, neutrophils isolated from MMP‐9 null mice show no defect in transendothelial migration under flow in vitro.41
The extent of cardiac myocyte death is a major determinant of myocardial remodeling post‐MI. Myocyte death can occur due to necrosis and apoptosis in the ischemic zone. During the inflammatory phase, infiltrated neutrophils also die due to apoptosis as part of the healing process.36 Cardiac cell apoptosis was significantly higher in ATM‐deficient hearts 1 and 3 days post‐MI. Although not investigated, this number most likely includes apoptotic neutrophils and macrophages. Mitochondria play a crucial role in determination of cell fate with respect to cell survival and apoptosis.42 Bcl2 family proteins, Bcl2 and Bax, modulate mitochondrial membrane potential and activation of caspases.26 ATM deficiency resulted in enhanced expression of Bax in the infarct LV region. Although there was no change in Bcl2 expression, the increase in Bax may induce loss of mitochondrial membrane potential and apoptosis. The increase in apoptotic cells during ATM deficiency also associated with decreased activation of anti‐apoptotic kinase, Akt and enhanced activation of pro‐apoptotic kinase, GSK‐3β 1 day post‐MI. In fact, Akt exerts its anti‐apoptotic effect, in part, through inactivation of GSK‐3β.43 Previously, we have shown decreased activation of Akt in the myocardium of mice lacking ATM in response to β‐AR stimulation.15 However, β‐AR stimulation had no effect on GSK‐3β activation during ATM deficiency. Collectively, these data suggest activation of Akt, via ATM, as a common signaling event during myocardial stress. Activation of GSK‐3β appears to be modulated differentially in response to different myocardial stress during ATM deficiency.
In summary, ATM deficiency results in improved heart function as determined by a decrease in dilative remodeling and inflammatory response acute post‐MI. However, it also associates with negative remodeling as determined by increased apoptosis and decreased activation of anti‐apoptotic kinase, Akt. In addition, ATM deficiency results in an increase in fibrosis and expression of α‐SMA. These studies, together with our previous findings,13 suggest that ATM has the potential to modulate the remodeling processes of the heart post‐MI. Further investigations are needed to define the long‐term impact of ATM deficiency in the healing processes of the heart post‐MI.
Acknowledgment
Technical help received from Barbara A. Connelly is appreciated.
Sources of Funding
This work was supported by a Merit Review award (number BX000640) from the Biomedical Laboratory Research and Development Service of the Veterans Affairs Office of Research and Development, grants from the National Heart, Lung, and Blood Institute (grant numbers R21HL‐091405 and R21HL‐092459), and funds from Institutional Research and Improvement account (Singh).
Disclosures
None.
Reference
- 1.Taylor AM, Byrd PJ. Molecular pathology of ataxia telangiectasia. J Clin Pathol. 2005; 58:1009-1015. [DOI] [PMC free article] [PubMed] [Google Scholar]
- 2.Chun HH, Gatti RA. Ataxia‐telangiectasia, an evolving phenotype. DNA Repair (Amst). 2004; 3:1187-1196. [DOI] [PubMed] [Google Scholar]
- 3.Nowak‐Wegrzyn A, Crawford TO, Winkelstein JA, Carson KA, Lederman HM. Immunodeficiency and infections in ataxia‐telangiectasia. J Pediatr. 2004; 144:505-511. [DOI] [PubMed] [Google Scholar]
- 4.Su Y, Swift M. Mortality rates among carriers of ataxia‐telangiectasia mutant alleles. Ann Intern Med. 2000; 133:770-778. [DOI] [PubMed] [Google Scholar]
- 5.Fang ZM, Lee CS, Sarris M, Kearsley JH, Murrell D, Lavin MF, Keating K, Clarke RA. Rapid radiation‐induction of ATM protein levels in situ. Pathology. 2001; 33:30-36. [PubMed] [Google Scholar]
- 6.Fukao T, Kaneko H, Birrell G, Gatei M, Tashita H, Yoshida T, Cross S, Kedar P, Watters D, Khana KK, Misko I, Kondo N, Lavin MF. ATM is upregulated during the mitogenic response in peripheral blood mononuclear cells. Blood. 1999; 94:1998-2006. [PubMed] [Google Scholar]
- 7.Ditch S, Paull TT. The ATM protein kinase and cellular redox signaling: beyond the DNA damage response. Trends Biochem Sci. 2012; 37:15-22. [DOI] [PMC free article] [PubMed] [Google Scholar]
- 8.Frangogiannis NG. The immune system and cardiac repair. Pharmacol Res. 2008; 58:88-111. [DOI] [PMC free article] [PubMed] [Google Scholar]
- 9.Ma Y, Yabluchanskiy A, Lindsey ML. Neutrophil roles in left ventricular remodeling following myocardial infarction. Fibrogenesis Tissue Repair. 2013; 6:11. [DOI] [PMC free article] [PubMed] [Google Scholar]
- 10.Deten A, Volz HC, Briest W, Zimmer HG. Cardiac cytokine expression is upregulated in the acute phase after myocardial infarction. Experimental studies in rats. Cardiovasc Res. 2002; 55:329-340. [DOI] [PubMed] [Google Scholar]
- 11.Nah DY, Rhee MY. The inflammatory response and cardiac repair after myocardial infarction. Korean Circ J. 2009; 39:393-398. [DOI] [PMC free article] [PubMed] [Google Scholar]
- 12.Frangogiannis NG. Regulation of the inflammatory response in cardiac repair. Circ Res. 2012; 110:159-173. [DOI] [PMC free article] [PubMed] [Google Scholar]
- 13.Foster CR, Daniel LL, Daniels CR, Dalal S, Singh M, Singh K. Deficiency of ataxia telangiectasia mutated kinase modulates cardiac remodeling following myocardial infarction: involvement in fibrosis and apoptosis. PLoS One. 2013; 8:e83513. [DOI] [PMC free article] [PubMed] [Google Scholar]
- 14.Barlow C, Hirotsune S, Paylor R, Liyanage M, Eckhaus M, Collins F, Shiloh Y, Crawley JN, Ried T, Tagle D, Wynshaw‐Boris A. Atm‐deficient mice: a paradigm of ataxia telangiectasia. Cell. 1996; 86:159-171. [DOI] [PubMed] [Google Scholar]
- 15.Foster CR, Zha Q, Daniel LL, Singh M, Singh K. Lack of ataxia telangiectasia mutated kinase induces structural and functional changes in the heart: role in beta‐adrenergic receptor‐stimulated apoptosis. Exp Physiol. 2012; 97:506-515. [DOI] [PMC free article] [PubMed] [Google Scholar]
- 16.Liu Z, Kastis GA, Stevenson GD, Barrett HH, Furenlid LR, Kupinski MA, Patton DD, Wilson DW. Quantitative analysis of acute myocardial infarct in rat hearts with ischemia‐reperfusion using a high‐resolution stationary SPECT system. J Nucl Med. 2002; 43:933-939. [PMC free article] [PubMed] [Google Scholar]
- 17.Desmouliere A, Geinoz A, Gabbiani F, Gabbiani G. Transforming growth factor‐beta 1 induces alpha‐smooth muscle actin expression in granulation tissue myofibroblasts and in quiescent and growing cultured fibroblasts. J Cell Biol. 1993; 122:103-111. [DOI] [PMC free article] [PubMed] [Google Scholar]
- 18.Xie Z, Singh M, Singh K. Differential regulation of matrix metalloproteinase‐2 and ‐9 expression and activity in adult rat cardiac fibroblasts in response to interleukin‐1beta. J Biol Chem. 2004; 279:39513-39519. [DOI] [PubMed] [Google Scholar]
- 19.White HD, Norris RM, Brown MA, Brandt PW, Whitlock RM, Wild CJ. Left ventricular end‐systolic volume as the major determinant of survival after recovery from myocardial infarction. Circulation. 1987; 76:44-51. [DOI] [PubMed] [Google Scholar]
- 20.Eddy RJ, Petro JA, Tomasek JJ. Evidence for the nonmuscle nature of the “myofibroblast” of granulation tissue and hypertropic scar. An immunofluorescence study. Am J Pathol. 1988; 130:252-260. [PMC free article] [PubMed] [Google Scholar]
- 21.Halade GV, Jin YF, Lindsey ML. Matrix metalloproteinase (MMP)‐9: a proximal biomarker for cardiac remodeling and a distal biomarker for inflammation. Pharmacol Ther. 2013; 139:32-40. [DOI] [PMC free article] [PubMed] [Google Scholar]
- 22.Etoh T, Joffs C, Deschamps AM, Davis J, Dowdy K, Baicu HJ, S, Mukherjee R, Manhaini M, Spinale FG. Myocardial and interstitial matrix metalloproteinase activity after acute myocardial infarction in pigs. Am J Physiol Heart Circ Physiol. 2001; 281:H987-H994. [DOI] [PubMed] [Google Scholar]
- 23.Nishida K, Kaziro Y, Satoh T. Anti‐apoptotic function of Rac in hematopoietic cells. Oncogene. 1999; 18:407-415. [DOI] [PubMed] [Google Scholar]
- 24.Menon B, Johnson JN, Ross RS, Singh M, Singh K. Glycogen synthase kinase‐3beta plays a pro‐apoptotic role in beta‐adrenergic receptor‐stimulated apoptosis in adult rat ventricular myocytes: role of beta1 integrins. J Mol Cell Cardiol. 2007; 42:653-661. [DOI] [PMC free article] [PubMed] [Google Scholar]
- 25.Stambolic V, Woodgett JR. Mitogen inactivation of glycogen synthase kinase‐3 beta in intact cells via serine 9 phosphorylation. Biochem J. 1994; 303:701-704. [DOI] [PMC free article] [PubMed] [Google Scholar]
- 26.Abbate A, Biondi‐Zoccai GG, Baldi A. Pathophysiologic role of myocardial apoptosis in post‐infarction left ventricular remodeling. J Cell Physiol. 2002; 193:145-153. [DOI] [PubMed] [Google Scholar]
- 27.Tanaka T, Huang X, Halicka HD, Zhao H, Traganos F, Albino AP, Dai W, Darzynkiewicz Z. Cytometry of ATM activation and histone H2AX phosphorylation to estimate extent of DNA damage induced by exogenous agents. Cytometry A. 2007; 71:648-661. [DOI] [PMC free article] [PubMed] [Google Scholar]
- 28.Foster CR, Singh M, Subramanian V, Singh K. Ataxia telangiectasia mutated kinase plays a protective role in beta‐adrenergic receptor‐stimulated cardiac myocyte apoptosis and myocardial remodeling. Mol Cell Biochem. 2011; 353:13-22. [DOI] [PMC free article] [PubMed] [Google Scholar]
- 29.Jardine DL, Charles CJ, Ashton RK, Bennett SI, Whitehead M, Frampton CM, Nicholls MG. Increased cardiac sympathetic nerve activity following acute myocardial infarction in a sheep model. J Physiol. 2005; 565:325-333. [DOI] [PMC free article] [PubMed] [Google Scholar]
- 30.Ide T, Tsutsui H, Kinugawa S, Utsumi H, Kang D, Hattori N, Uchida K, Arimura K, Egashira K. Mitochondrial electron transport complex I is a potential source of oxygen free radicals in the failing myocardium. Circ Res. 1999; 85:357-363. [DOI] [PubMed] [Google Scholar]
- 31.French BA, Kramer CM. Mechanisms of post‐infarct left ventricular remodeling. Drug Discov Today Dis Mech. 2007; 4:185-196. [DOI] [PMC free article] [PubMed] [Google Scholar]
- 32.See F, Watanabe M, Kompa AR, Wang BH, Boyle AJ, Kelly DJ, Gilbert RE, Krum H. Early and delayed tranilast treatment reduces pathological fibrosis following myocardial infarction. Heart Lung Circ. 2012; 22:122-132. [DOI] [PubMed] [Google Scholar]
- 33.Bournazou I, Pound JD, Duffin R, Bournazos S, Melville LA, Brown SB, Rossi AG, Gregory CD. Apoptotic human cells inhibit migration of granulocytes via release of lactoferrin. J Clin Invest. 2009; 119:20-32. [DOI] [PMC free article] [PubMed] [Google Scholar]
- 34.Hayhoe RP, Kamal AM, Solito E, Flower RJ, Cooper D, Perretti M. Annexin 1 and its bioactive peptide inhibit neutrophil‐endothelium interactions under flow: indication of distinct receptor involvement. Blood. 2006; 107:2123-2130. [DOI] [PubMed] [Google Scholar]
- 35.Choi EY, Santoso S, Chavakis T. Mechanisms of neutrophil transendothelial migration. Front Biosci (Landmark Ed). 2009; 14:1596-1605. [DOI] [PMC free article] [PubMed] [Google Scholar]
- 36.Chen W, Frangogiannis NG. Fibroblasts in post‐infarction inflammation and cardiac repair. Biochim Biophys Acta. 2013; 1833:945-953. [DOI] [PMC free article] [PubMed] [Google Scholar]
- 37.Deten A, Holzl A, Leicht M, Barth W, Zimmer HG. Changes in extracellular matrix and in transforming growth factor beta isoforms after coronary artery ligation in rats. J Mol Cell Cardiol. 2001; 33:1191-1207. [DOI] [PubMed] [Google Scholar]
- 38.Goldsmith EC, Bradshaw AD, Spinale FG. Cellular mechanisms of tissue fibrosis. 2. Contributory pathways leading to myocardial fibrosis: moving beyond collagen expression. Am J Physiol Cell Physiol. 2013; 304:C393-C402. [DOI] [PMC free article] [PubMed] [Google Scholar]
- 39.Romson JL, Hook BG, Kunkel SL, Abrams GD, Schork MA, Lucchesi BR. Reduction of the extent of ischemic myocardial injury by neutrophil depletion in the dog. Circulation. 1983; 67:1016-1023. [DOI] [PubMed] [Google Scholar]
- 40.Romanic AM, Harrison SM, Bao W, Burns‐Kurtis CL, Pickering S, Gu J, Grau E, Mao J, Sathe GM, Ohlstein EH, Yue TL. Myocardial protection from ischemia/reperfusion injury by targeted deletion of matrix metalloproteinase‐9. Cardiovasc Res. 2002; 54:549-558. [DOI] [PubMed] [Google Scholar]
- 41.Allport JR, Lim YC, Shipley JM, Senior RM, Shapiro SD, Matsuyoshi N, Vestweber D, Luscinskas FW. Neutrophils from MMP‐9‐ or neutrophil elastase‐deficient mice show no defect in transendothelial migration under flow in vitro. J Leukoc Biol. 2002; 71:821-828. [PubMed] [Google Scholar]
- 42.Chen L, Knowlton AA. Mitochondria and heart failure: new insights into an energetic problem. Minerva Cardioangiol. 2010; 58:213-229. [PMC free article] [PubMed] [Google Scholar]
- 43.Jope RS, Johnson GV. The glamour and gloom of glycogen synthase kinase‐3. Trends Biochem Sci. 2004; 29:95-102. [DOI] [PubMed] [Google Scholar]