

Abstract
Background
Mitochondrial dysfunction has been shown to play an important role in the development of atherosclerosis and nonalcoholic fatty liver disease (NAFLD). Mitochondrial aldehyde dehydrogenase (ALDH2), an enzyme responsible for the detoxification of reactive aldehydes, is considered to exert protective function in mitochondria. We investigated the influence of Alda‐1, an activator of ALDH2, on atherogenesis and on the liver steatosis in apolipoprotein E knockout (apoE−/−) mice.
Methods and Results
Alda‐1 caused decrease of atherosclerotic lesions approximately 25% as estimated by “en face” and “cross‐section” methods without influence on plasma lipid profile, atherosclerosis‐related markers of inflammation, and macrophage and smooth muscle content in the plaques. Plaque nitrotyrosine was not changed upon Alda‐1 treatment, and there were no changes in aortic mRNA levels of factors involved in antioxidative defense, regulation of apoptosis, mitogenesis, and autophagy. Hematoxylin/eosin staining showed decrease of steatotic changes in liver of Alda‐1‐treated apoE−/− mice. Alda‐1 attenuated formation of 4‐hydroxy‐2‐nonenal (4‐HNE) protein adducts and decreased triglyceride content in liver tissue. Two‐dimensional electrophoresis coupled with mass spectrometry identified 20 differentially expressed mitochondrial proteins upon Alda‐1 treatment in liver of apoE−/− mice, mostly proteins related to metabolism and oxidative stress. The most up‐regulated were the proteins that participated in beta oxidation of fatty acids.
Conclusions
Collectively, Alda‐1 inhibited atherosclerosis and attenuated NAFLD in apoE−/− mice. The pattern of changes suggests a beneficial effect of Alda‐1 in NAFLD; however, the exact liver functional consequences of the revealed alterations as well as the mechanism(s) of antiatherosclerotic Alda‐1 action require further investigation.
Keywords: Alda‐1, ALDH2, atherosclerosis, mitochondria, nonalcoholic fatty liver disease
Introduction
Atherosclerosis and its complications are the leading causes of mortality in Western countries.1 Atherosclerosis is a chronic inflammatory disease of the arterial wall, characterized by endothelial dysfunction, infiltration of inflammatory cells, and finally, formation of atherosclerotic plaque with its lipid‐rich core and rupture‐prone fibrous cap.2 A growing body of evidence shows that nonalcoholic fatty liver disease (NAFLD), the most common liver disorder, is an important independent risk factor for development of atherosclerosis.3 NAFLD is primarily manifested by various extents of triglyceride (TG) accumulation in hepatocytes, but encompasses a broad spectrum of pathological conditions ranging from simple steatosis (accumulation of fat) to steatohepatitis (steatosis accompanied by inflammatory response), fibrosis, and, finally, hepatocellular carcinoma.4
Recently, it has been proposed that mitochondrial dysfunction could represent a common mechanistic background for the development of atherosclerosis and NAFLD.5–7 Many factors related to endothelial injury and atherogenesis (eg, proinflammatory cytokines and hypercholesterolemia) have been shown to increase mitochondrial reactive oxygen species (ROS) generation and impair major mitochondrial functions, leading to decreased cellular production of ATP, derangement of lipid, steroid, and aminoacid metabolism, as well as dysregulation of cell cycle and increase of apoptosis.8–9 Excessive production of ROS by dysfunctional mitochondria leads to oxidative modification of mitochondrial proteins, lipids, and DNA and subsequent further impairment of mitochondria. ROS‐dependent peroxidation of polyunsaturated fatty acids is associated with generation of toxic aldehydes, such as 4‐hydroxy‐2‐nonenal (4‐HNE) and acrolein,10 which are highly reactive toward thiols and amino groups of cysteine, histidine, and lysine; hence, 4‐HNE can easily form adducts with proteins and affect their function. Importantly, accumulation of 4‐HNE has been described in atherosclerosis, NAFLD, diabetes, ischemia, and neurodegenerative diseases.11–12
Mitochondrial aldehyde dehydrogenase (ALDH2), mostly known for its role in ethanol metabolism, is a key enzyme involved in the degradation of toxic reactive aldehydes, such as 4‐HNE and acrolein, to unreactive acids and therefore play a role in mitochondrial protection. Activation of ALDH2 has been proposed as a potential therapeutic strategy in cardiovascular diseases (CVDs).13 Recently, a small‐molecular‐weight activator of ALDH2—N‐(1,3‐benzodioxol‐5‐ylmethyl)‐2,6‐dichlorobenzamide (Alda‐1)—has been described.14–15 Interestingly, ALDH2 activation by Alda‐1 has been shown to restore angiogenesis and prevent β‐amyloid‐induced endothelial dysfunction in vitro and exert protective action against acute ischemic injury in the heart.15–16 However, there is no information whether prolonged activation of ALDH2 may offer any benefits in chronic processes associated with mitochondrial accumulation of aldehydes. Thus, we hypothesized that by increasing the detoxification activity of ALDH2 by use of the selective ALDH2 activator, Alda‐1, we would be able to reduce atherosclerosis and NAFLD.
Apolipoprotein E (apoE)‐knockout mice (apoE−/−) are widely used in atherosclerosis studies because they spontaneously develop hypercholesterolemia, dyslipidemia, and arterial lesions.17 Importantly, apoE−/−mice along with atherosclerosis develop, over 6 months, changes in liver resembling mild hepatic steatosis and fibrosis.18 The aim of our study was to comprehensively examine the influence of prolonged treatment with Alda‐1 on the development of atherosclerotic plaques and fatty liver in apoE−/− mice using morphological, biochemical, molecular, and proteomic methods.
Methods
Animal Experiments
All animal procedures were performed to conform to the guidelines from Directive 2010/63/EU of the European Parliament on the protection of animals used for scientific purposes and approved by the Jagiellonian University Ethical Committee on Animal Experiments (no. 73/2011). Female apoE‐knockout mice, on a C57BL/6J background, were obtained from Taconic (Ejby, Denmark). Mice were maintained on 12‐hour dark/light cycles in air‐conditioned rooms (22.5±0.5°C, 50±5% humidity) with access to diet and water ad libitum in the Animal House of Chair of Immunology of Jagiellonian University Medical College (Krakow, Poland). At the age of 8 weeks, mice were put on chow diet made by Ssniff (Soest, Germany). Two groups of animals were studied: control group (apoE−/− mice wthout treatment, on chow diet as above; n=10) and Alda‐1‐treated mice (n=10). In this group, Alda‐1 (ChemBridge, San Diego, CA) was mixed without heating with the same diet and administered to mice at a dose of 10 mg per kg of body weight per day (according to a calculation taking into account average body mass of mice and their daily diet requirement). At the age of 6 months, mice from both groups were killed using a carbon monoxide chamber 5 minutes after injection of fraxiparine (1000 UI; Sanofi‐Synthelabo, Paris, France) into the peritoneum. Next, the blood from the right ventricle was collected and hearts, livers, and aortas were dissected.
Quantification of Atherosclerosis: “En Face” Method
The aorta from arch to bifurcation was fixed in 4% formaldehyde. Then, it was opened longitudinally, pinned onto black wax plates, and stained with Sudan‐IV (Sigma‐Aldrich, St. Louis, MO). Aortic lesion and total aortic areas were calculated using LSM Image Browser software.
Quantification of Atherosclerosis: “Cross‐Section” Method
The heart and ascending aorta were embedded in optimal cutting temperature compound (CellPath, Newtown, UK) and snap‐frozen. Ten‐micrometer‐thick cryosections were cut from the proximal 1 mm of the aortic root. Eight adjacent sections were collected at 100‐μm intervals starting at a 100‐μm distance from the appearance of the aortic valves. Sections were thaw‐mounted on poly‐l‐lysine–coated slides and air dried. After fixation in 4% paraformaldehyde (pH 7.0), sections were stained with Oil Red O (ORO; Sigma‐Aldrich). ORO‐stained sections were examined under an Olympus BX50 (Olympus, Tokyo, Japan) microscope and used for quantitative evaluation. Images of the aorta were recorded using an Olympus Camedia DP71 digital camera. Total area of the lesion was measured semiautomatically in each slide using LSM Image Browser software (Zeiss, Jena, Germany). For each animal, a mean lesion area was calculated from 8 sections, reflecting the cross‐section area covered by atherosclerosis.
Immunohistochemistry Staining of Aortic Roots
For indirect immunohistochemistry (IHC), acetone‐fixed sections of ascending aorta were used. Sections were preincubated overnight with 5% of nonimmunogenic goat serum with 2% fat‐free milk to block nonspecific binding of antibodies (Abs). Incubations with primary Abs were performed overnight at room temperature in wet chambers in the following combination of sera: cyanine 3 (Cy3)‐conjugated anti‐alpha‐smooth muscle actin (α‐SMA; dilution 1:800; Sigma‐Aldrich) and rat anti‐mouse CD68 (dilution 1:800; Serotec, Kidlington, UK). Then, goat anti‐rat immunoglobulin G biotinylated Abs, followed by dichlorotriazinylaminofluorescein (DTAF)‐conjugated streptavidin (Jackson ImmunoResearch, West Grove, PA), were applied to visualize rat Abs. Sections were examined using an epifluorescence Olympus BX50 microscope equipped with appropriate filter cubes to show Cy3 (red) and DTAF (green) fluorescence. Images were registered with a Camedia DP71 digital camera (Olympus). In each section, the total area occupied by CD68‐immunopositive macrophages and α‐SMA‐positive cells were measured using LSM Image Browser software. For staining of 4‐HNE‐protein adducts and nitrotyrosine, a primary monoclonal mouse antibody, anti‐4‐hydroxynonenal (HNEJ‐2; Abcam, Cambridge, MA), and a polyclonal rabbit antibody, anti‐nitrotyrosine (Sigma‐Aldrich), were used. IHC was performed using a standard protocol. Slides were dewaxed, rehydrated, and incubated in a 3% peroxide solution to block endogenous peroxidase activity. Antigen retrieval was carried out by water bath cooking in citrate buffer (pH 6.0). The LabVision (Thermo Fisher Scientific, Fremont, CA) detection system was used, and 3,3′‐diaminobenzidine (DAB) served as the chromogen. Slides were counterstained with Mayer's hematoxylin. The intensity of the IHC reaction was evaluated using a light microscope (Nikon eclipse 50i; Nikon, Tokyo, Japan).
Real‐Time Reverse‐Transcriptase Polymerase Chain Reaction
Total RNA was isolated from the homogenized mouse aortas using the RNeasy Fibrous Tissue Mini Kit (QIAGEN, Valencia, CA), according to the manufacturer's instructions. Extracted RNA was dissolved in 30 μL of nuclease‐free water (Fermentas Canada, Burlington, Ontario, Canada). The RNA concentration of each sample was measured at a wavelength of 260 nm (A260) in an EPOCH microplate spectrophotometer (BioTek Instruments, Inc., Winooski, VT). The purity of extracted total RNA was determined by the A260/A280 ratio. cDNA was synthesized by the reverse transcription of 1000 ng of total RNA from each sample using 0.5 μL of oligo(dT)18 primer (Fermentas Canada) and 0.4 μL of M‐MuLV reverse transcriptase (200 U/μL; Fermentas Canada) in a total volume of 10 μL (including also: 2 μL 5× reaction buffer for M‐MuLV RT [containing 250 mmol/L of Tris‐HCl (pH 8.3) at 25°C, 250 mmol/L of KCl, 20 mmol/L of MgCl2, and 50 mmol/L DTT], 0.5 μL of dNTPs mixture [10 mmol/L], 0.3 μL of RiboLock RNAse Inhibitor [40 U/μL], and nuclease‐free water; Fermentas). The reaction was performed in a T3 Thermocycler (Biometra, Göttingen, Germany) at 42°C during 1 hour, and the enzyme was then denatured at 95°C for 5 minutes. The cDNA was diluted 8‐fold before polymerase chain reaction (PCR) amplification.
Relative gene expression analysis in aortas, with GAPDH as the internal reference gene, was carried out using the 7900HT fast real‐time PCR System (Applied Biosystems, Foster City, CA) in triplicate. Primers were designed with Primer BLAST software (http://www.ncbi.nlm.nih.gov/tools/primer-blast) for Atg5, Lc3a, Lc3b, Becn1, Ppargc1a, and Sirt1 genes or purchased using commercially available TaqMan Gene Expression Assays (Applied Biosystems) for Bax, Bcl2, Cat, Gpx1, and Sod2 genes. Sequences of the designed primers were as follows: 5′ ACC ACA AGC AGC TCT GGA TGG GAC T 3′ (forward) and 5′ GCC GCT CCG TCG TGG TCT GAT AT 3′ (reverse) for Atg5; 5′ TTG GTC AAG ATC ATC CGG C 3′ (forward) and 5′ GCT CAC CAT GCT GTG CTG G 3′ (reverse) for Lc3a; 5′ CAC TGC TCT GTC TTG TGT AGG TTG 3′ (forward) and 5′ TCG TTG TGC CTT TAT TAG TGC ATC 3′ (reverse) for Lc3b; 5′ GGG GTT TGC GGT TTT TCT GGG AC 3′ (forward) and 5′ TCT CCA CGT CCA TCC ATC CTG TAC GGA AG 3′ (reverse) for Becn1; 5′ CCT TGG AGC AGG TTG CAG GAA TCC 3′ (forward) and 5′ AGG GCA CCG AGG AAC TAC CTG ATT 3′ (reverse) for Sirt1; and 5′ TCA CTC TCA GTA AGG GGC TGG TTG C 3′ (forward) and 5′ TCC TCA CCA ACC AGA GCA GCA CAC 3′ (reverse) for Ppargc1a. Reactions were carried out using GoTaq quantitative PCR Master Mix (Promega, Madison, WI) or TaqMan Gene Expression Master Mix (Applied Biosystems), according to the manufacturer's instructions. Analysis of the data was performed using Data Assist v3.01 software (Applied Biosystems).
Histology and IHC of the Liver
Samples of liver tissue were formalin fixed, routinely processed, and embedded in paraffin. From paraffin blocks 2 μm sections were prepared and stained with the hematoxylin‐eosin method. For IHC, a primary monoclonal mouse Ab, anti‐HNEJ‐2 (Abcam), was used. IHC was performed using a standard protocol. Slides were dewaxed, rehydrated, and incubated in a 3% peroxide solution to block endogenous peroxidase activity. Antigen retrieval was carried out by water bath cooking in citrate buffer (pH 6.0). The LabVision (Thermo Fisher Scientific) detection system was used, and DAB served as the chromogen. Slides were counterstained with Mayer's hematoxylin. The intensity of the IHC reaction was evaluated using a light microscope (Nikon eclipse 50i).
Biochemical Methods
The blood was collected from the right ventricle. Plasma was separated by centrifugation at 1000g at 4°C for 10 minutes and stored in −80°C until assayed. Total cholesterol, level of high‐density lipoproteins (HDLs) and low‐density lipoproteins (LDLs), as well as triglycerides (TGs) were assayed using commercially available kits (Roche Molecular Biochemical, Pleasanton, CA). In addition, levels of some inflammation markers, such as interleukin 6 (IL)‐6), IL‐12, vascular cell adhesion protein 1 (VCAM‐1), and monocyte chemoattractant protein 1 (MCP‐1), were measured by ELISA using commercially available kits (R&D Systems, Minneapolis, MN). Aspartate aminotransferase (AST) and alanine aminotransferase (ALT) plasma levels were assayed using commercially available kits: Reflotron GPT, Reflotron GOT (Roche, Mannheim, Germany), and Reflovet Plus equipment (Roche, Germany).
Apart from that, the level of TGs in the liver was measured using Triglyceride Colorimetric Assay Kit (Cayman Chemical, Ann Arbor, MI), according to the manufacturer's instructions.
RT2 Profiler PCR Array
Total RNA was isolated from liver of 3 mice from the Alda‐1 group and 3 mice from the control group using QIAzol Lysis Reagent (QIAGEN), according to manufacturer's instructions. RNA concentration of each sample was measured at a wavelength of 260 nm (A260) in an EPOCH Microplate Spectrophotometer (BioTek Instruments). Purity of extracted total RNA was determined by the A260/A280 ratio. All samples had A260/A280 ratios of 1.9 to 2.1. Integrity of RNA samples was confirmed by denaturing agarose gel electrophoresis. One thousand nanograms of total RNA were used as a template to synthesize cDNA with the RT2 First Strand Kit (SABiosciences, Frederick, MD). The RT2 Profiler PCR Arrays (PAMM‐157Z; SABiosciences) were used to analyze the expression levels of 84 key genes involved in fatty liver disease. The cDNA sample and 2×SABiosciences RT2 qPCR MasterMix were added to the PCR array plates, and PCR reactions were performed using the 7900HT Fast Real‐Time PCR System (Applied Biosystems). Data were normalized to the values for the housekeeping genes panel using a ΔΔCt method and analyzed by online RT2 Profiler PCR Array Data Analysis Software (http://www.pcrdataanalysis.sabiosciences.com/pcr/arrayanalysis.php).
Subcellular Fractionation
Isolation of mitochondria was performed at 4°C from freshly harvested mouse liver. Two animals were pooled for samples to obtain sufficient material for proteomic analysis. Homogenization was carried out in 250 mmol/L of sucrose and 1 mmol/L of EGTA (pH 7.8) with the addition of PMSF (1 mmol/L) and a mix of protease inhibitors (approximately 100 μL for 3 g of tissue; Sigma‐Aldrich). Nuclei and unbroken cells were pulled down by centrifugation at 1000g for 10 minutes. Then, the mitochondrial fraction was obtained by centrifugation of the supernatant at 12 000g for 10 minutes. The mitochondrial pellet was then purified by 3 cycles of resuspension, homogenization, and centrifugation (at 12 000g for 15, 20, and 15 minutes). The cytosolic fraction was obtained by further centrifugation of the supernatant (90 minutes at 125 000g, 4°C). Samples were collected and stored at −80°C until assayed.
Two‐Dimensional Electrophoresis and Gel Image Analysis
Mitochondrial pellets were resuspended in 1 mL of lysis buffer containing 9.5 mol/L of urea, 4% CHAPS, 2% dithiothreitol (DTT), 0.5% Bio‐Lyte 3‐10 (Bio‐Rad, Hercules, CA), and a mix of protease inhibitors (100 μL for 3 mg of sample). Samples were vortexed and left at 25°C for 30 minutes to ensure maximal protein solubilization, then centrifuged at 12 000g for 15 minutes. The supernatant was harvested, and the protein concentration was determined with the Bradford method.19 The supernatant was then divided into aliquots containing the appropriate amount of protein for single IPG strips (200 μg for analytical gels) and stored at −80°C. Before loading, samples were purified by precipitation with two‐dimensional (2D) electrophoresis (2DE) Clean‐up kit (GE Healthcare, Wilmington, MA) and resuspension in 300 μL of rehydration buffer (8 mol/L of urea, 0.5% CHAPS, 0.2% DTT, and 0.2% Bio‐Lyte 3‐10). Then, samples were loaded on linear 3‐10 immobilized pH gradient 17‐cm strips (Bio‐Rad) using an in‐gel rehydration method and were rehydrated overnight in a reswelling tray. Strips were focused with a multistep voltage gradient from 400 to 3500 V (max 50 mA/IPG strip, 20°C) for a total of 66 kVh. Once isoelectric focusing was completed, the strips were equilibrated in buffer (6 mol/L urea, 30% glycerol, 2% SDS, and 0.01% bromophenol blue) with the addition of 1% w/v DTT (20 minutes) and 4.8% (w/v) iodoacetamide (20 minutes), to ensure sufficient reduction and alkylation of proteins. Second dimension (SDS‐PAGE) was performed using 12% T (total acrylamide concentration), 2.6% C (degree of cross‐linking) polyacrylamide gels without a stacking gel, using the Protean II xi system (Bio‐Rad). After electrophoresis, gels were fixed overnight in ethanol/acetic acid/water solution (4:1:5 v/v/v). Finally, protein profiles were visualized by silver staining, using the Plus One silver staining kit (GE Healthcare) with modifications to provide compatibility with subsequent mass spectrometry (MS) analysis.20 For analysis, silver‐stained gels images were taken using a Gel Doc XR scanner (Bio‐Rad). PDQuest 8.0.1 (Bio‐Rad) was used for gel image analysis, quantification, and statistical validation. In total, n=3 animals representing each group with n=2 replicates for each animal (n=6 gel images per group) were analyzed. All results were carefully verified manually, including verification of housekeeping proteins chosen for normalization (local regression model) to ensure accurate quantification. Student t‐test with the level of significance set at P<0.05 was used to reveal statistically significant differences in protein expression. Significant differences were further analyzed with a liquid chromatography tandem MS (LC MS/MS) system to identify proteins of interest.
LC MS/MS
Gel pieces containing protein spots of interest were destained, reduced, alkylated, and digested with modified trypsin (Sigma‐Aldrich), according to the protocol described by Shevchenko et al.21 Peptide mixtures were lyophilized and stored at −80°C for further LC/MS analysis. Each sample was resuspended in 0.1% trifluoroacetic acid and injected in an Acclaim PepMap100 RP C18 75 μm i.d. × 25 cm column (LC Packings/Dionex, Sunnyvale, CA) by trap column (PepMap100 RP C18 300 μm i.d. × 5 mm column; LC Packings/Dionex; Dionex). Peptides were separated in an acetonitrile gradient (buffer A, 5% acetonitrile and 0.1% formic acid; buffer B, 95% acetonitrile and 0.1% formic acid) with a flow rate of 300 nL/min with a Switchos/UltiMate 3000 RSLC nano HPLC system (LC Packings/Dionex) and applied online to an LCQ (Thermo Finnigan, San Jose, CA) ion‐trap mass spectrometer. The mobile‐phase gradient was started with an increase from 0% to 25% B within 35 minutes, then increasing to 40% B in 40 minutes, next rapidly increasing to 80% B within 12 seconds, followed by 80% B isocratic for 5 minutes. Finally, B phase was rapidly decreased to 0% and left isocratic 100% A for column equilibration for 30 minutes. The main working liquid‐junction electrospray ionization ion source parameters were as follows: ion spray voltage, 1.5 kV; capillary voltage, 10 V; and capillary temperature, 200°C. Spectra were collected in full scan mode (270 to 1600 Da), followed by 3 MS/MS scans of the 3 most intense ions from full scan using dynamic exclusion criteria. Collected data were analyzed by X!Tandem search algorithm (The Global Proteome Machine Organization) and statistically validated with Trans‐Proteomic Pipeline software (Institute for Systems Biology, Seattle, WA). Search parameters were set as follows: taxonomy: mouse (SwissProt), enzyme: trypsin, missed cleavage sites allowed: 3, fixed modification: carbamidomethyl, variable modifications: oxidation of methionine, peptide fragment mass tolerance: 0.4 Da and selected device and parent δm: ion trap (4 Da).
Immunoblotting
The purity of the fractions was assessed by immunoblotting of cytochrome c oxidase (COX‐IV) and α‐tubulin. Isolated mitochondria were lysed in PBS containing 1% Triton X‐100, 0.1% SDS, 1 mmol/L of phenylmethylsulfonyl fluoride (PMSF), 100 μmol/L of leupeptin, and 50 μmol/L of pepstatin A. Samples, containing equal amounts of total protein (as estimated with the Bradford method), were mixed with gel loading buffer (50 mmol/L of Tris, 10% SDS, 10% glycerol, 10% 2‐mercaptoethanol, and 2 mg/mL of bromophenol blue) in a 4:1 ratio (v/v) and incubated at 95°C for 5 minutes. Samples (50 μg of protein) were separated on SDS‐PAGEs (7.5% to 15%, Mini Protean II; Bio‐Rad) using the Laemmli buffer system, and proteins were semidry transferred to nitrocellulose membranes (Amersham Biosciences). Membranes were blocked overnight at 4°C with 5% (w/v) nonfat dried milk in TTBS and incubated 3 hours at room temperature with specific primary Abs: 1:5000 ANTI‐COX‐IV, 1:250 ANTI‐α‐tubulin (Sigma‐Aldrich), 1:1000 ANTI‐ECHS1 (Sigma‐Aldrich), and 1:1000 ANTI‐ACAA2 (Sigma‐Aldrich), then for 1 hour with HRP‐conjugated secondary Abs (Amersham Biosciences). Bands were developed with the use of ECL‐system reagents (Amersham Biosciences). Rainbow markers (Amersham Biosciences) were used for molecular‐weight determinations. Protein pattern images were taken using ImageQuant Las 500 (GE Healthcare, Chalfont, UK).
Hep2G Cell Culture
Human HepG2 cells were grown in a humidified incubator containing 5% CO2 and 95% air at 37°C. They were grown in DMEM medium (Sigma‐Aldrich), supplemented with 5% FBS (Gibco BRL, Gaithersburg, MD) and streptomycin (100 μg/mL), penicillin (100 U/mL), and fungizone (0.25 μg/mL). Cells were placed in 6‐well plates (106 cells per well) in 2 mL of culture medium and treated with palmitic acid (50 μmol/L) and Alda‐1 (10 μmol/L) versus vehicle (0.1% DMSO) for 24 hours. Then, cells were lysed in lysis buffer (1% Triton X‐100, 0.1% SDS in PBS containing 1 mmol/L of PMSF, 100 μmol/L of leupeptin, and 50 μmol/L of pepstatin A). Protein concentrations of lysates were determined using the Bradford method, and immunoblotting with ANTI‐ACAA2 (Sigma‐Aldrich) and ANTI‐β‐actin (Sigma‐Aldrich) Abs was performed as described above.
Statistical Analysis
Results are presented as a mean+SEM. Equality of variance and normality of the data were checked, and then the nonparametric Mann‐Whitney's U test (“en face” and “cross‐section” methods) or t test (other methods) were used for statistical analysis of the data. P<0.05 was considered as statistically significant.
Results
Effects of Alda‐1 on Atherosclerosis
Treatment with Alda‐1 resulted in decrease of atherosclerotic lesions in aortas of apoE−/− mice, as evidenced by the en face (8.5±1.2% vs. 16.7±2.2%; P<0.05; Figure 1A) and cross section methods (65 249±6943 μm2 vs. 87 817±7213 μm2; P<0.05; Figure 1B).
Figure 1.
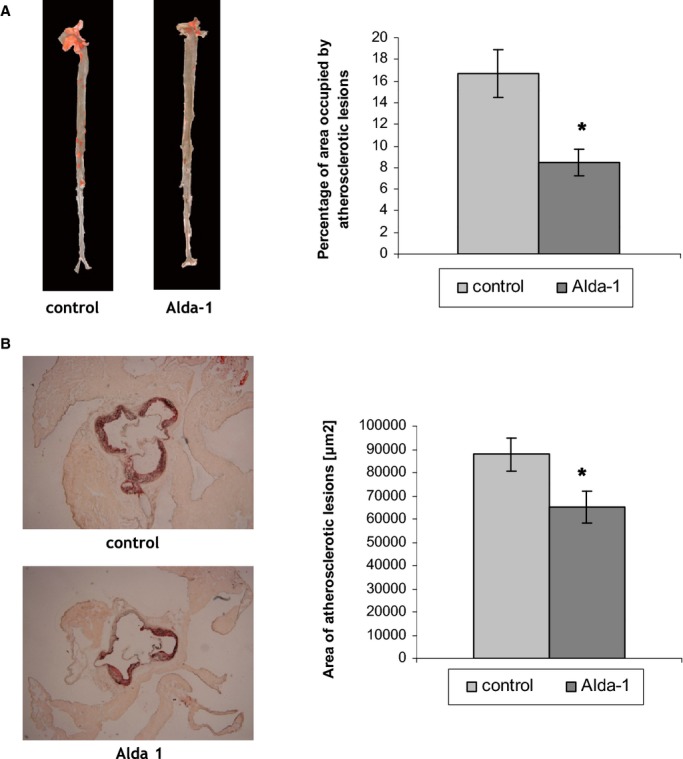
A, Sudan IV–stained representative aortas in control group and Alda‐1‐treated group. Percentage of area occupied by atherosclerotic lesions measured by the en face method in the control group and Alda‐1‐treated group (P<0.05; n=10 per group). B, Representative micrographs showing Oil Red O–stained lesions in control group and Alda‐1‐treated group. Atherosclerotic lesions area is measured by the cross‐section method in control group and Alda‐1‐treated group (P<0.05; n=10 per group). Alda‐1 indicates N‐(1,3‐benzodioxol‐5‐ylmethyl)‐2,6‐dichlorobenzamide.
Alda‐1 treatment did not significantly changed macrophage content in atherosclerotic lesions, as evidenced by CD68 staining (29±2.4% vs. 35.8±2.5%; P=0.07; Figure 2) and content of α‐SMA staining in the fibromuscular cap (2.8±0.6% vs. 3.6±0.9%; P=0.46; Figure 2). Alda‐1 tended to weaken 4‐HNE protein adducts and nitrotyrosine staining in atherosclerotic lesions from aortas of apoE−/− mice; however, such actions were not statistically significant (Figure 2).
Figure 2.
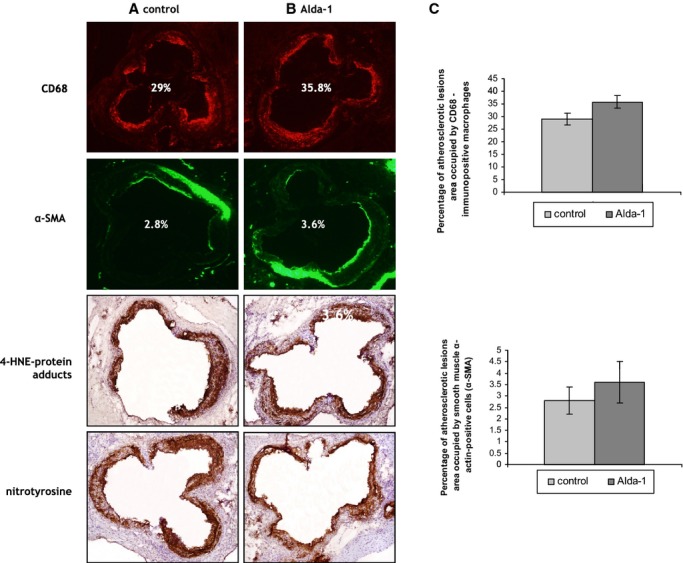
The immunohistochemical staining of aortic roots from control (A) and Alda‐1‐treated (B) apoE knockout mice. The figure shows immunohistochemical visualization of (A and B) CD68‐positive macrophages, SMA‐positive smooth muscle cells, 4‐HNE‐protein adducts, and nitrotyrosine staining and quantitative analysis of (C) CD68‐positive macrophages (top panel) and SMA‐positive smooth muscle cells (lower panels). Magnification, ×40. Mean±SEM; P>0.05; n=10 per group. Alda‐1 indicates N‐(1,3‐benzodioxol‐5‐ylmethyl)‐2,6‐dichlorobenzamide; apoE, apolipoprotein E; 4‐HNE, 4‐hydroxy‐2‐nonenal; α‐SMA, alpha‐smooth muscle actin.
Treatment with Alda‐1 did not change the expression of genes connected with oxidative stress (catalase, superoxide dismutase 2, and glutathione peroxidase 1), apoptosis (Bax and Bcl‐2), and autophagy (Atg5, Beclin1, LC3A, and LC3B) processes and mitochondrial function (PGC1α and Sirt1) in aortas from apoE−/− mice (Figure 3).
Figure 3.
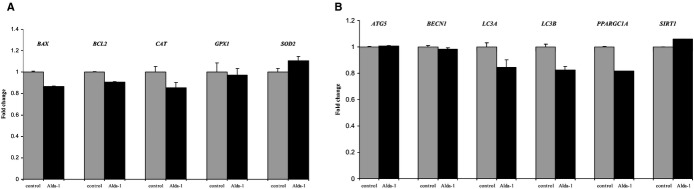
Relative expression of genes connected with oxidative stress, apoptosis (A), and autophagy processes (B) in aortas from Alda‐1‐treated apoE−/− mice, in comparison to control. Mean±SEM; P>0.05; n=5 per group. Alda‐1 indicates N‐(1,3‐benzodioxol‐5‐ylmethyl)‐2,6‐dichlorobenzamide; apoE, apolipoprotein E;
The levels of total cholesterol, HDLs, LDLs, TGs, VCAM‐1, MCP‐1, IL‐12, and IL‐6 in blood did not change significantly upon Alda‐1 treatment in apoE−/− mice (Table 1).
Table 1.
Plasma Level of Total Cholesterol, High‐Density Lipoproteins (HDL), Low‐Density Lipoproteins (LDL), Triglycerides (TG), Vascular Cell Adhesion Protein 1 (VCAM‐1), Monocyte Chemoattractant Protein 1 (MCP‐1), Interleukin‐12 (IL‐12), and Interleukin‐6 (IL‐6) in a Control and Alda‐1‐Treated Group
| Total Cholesterol (mmol/L) | HDL (mmol/L) | LDL (mmol/L) | TG (mmol/L) | VCAM‐1 (ng/mL) | MCP‐1 (pg/mL) | IL‐12 (pg/mL) | IL‐6 (pg/mL) | |
|---|---|---|---|---|---|---|---|---|
| Control | 13.38±0.59 | 3.73±0.76 | 8.25±0.85 | 1.36±0.22 | 9.23±0.33 | 73.34±7.42 | 11.44±0.86 | 9.87±3.95 |
| Alda‐1 | 10.80±2.87 | 2.75±0.21 | 8.60±2.22 | 1.60±0.21 | 9.19±0.12 | 76.20±7.07 | 8.76±0.92 | 6.97±0.83 |
Data presented as a mean±SEM; P>0.05, n=10 per group.
Effects of Alda‐1 on Liver Steatosis and 4‐HNE Staining
H&E staining did not reveal major disturbances of liver structure in both untreated and Alda‐1‐treated mice. Portal spaces were not enlarged, with only minimal lymphocytic infiltrates in part of them. In both groups, signs of hepatocyte damage were visible: In livers of untreated mice, cytoplasm was granular with small and sometimes bigger, clear droplets present in 80% to 90% of hepatocytes (Figure 4A). The picture was consistent with severe microvesicular steatosis. Moreover, some hepatocytes had enlarged, hyperchromatic nuclei and single cells were binucleated. In livers of Alda‐1‐treated mice, similar, but less pronounced, cytoplasmic changes in hepatocytes were visible: Small lipid droplets were present in approximately 30% to 40% of hepatocytes (especially in centrilobular locations; Figure 4B). Bigger lipid droplets were not visible. Cells with enlarged, hyperchromatic nuclei and binucleated cells were still detectable. Moreover, treatment with Alda‐1 resulted in a significant decrease of TG level in liver of apoE−/− mice (Figure 4). Plasma AST and ALT levels also did not differ between C57BL/6J (wild‐type), apoE−/−, and Alda‐1‐treated apoE−/− mice (Figure 5).
Figure 4.
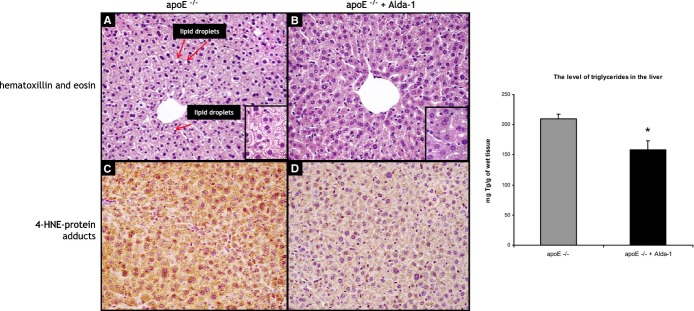
Representative images of livers of 6‐month‐old apoE−/− mice (A and C) and Alda‐1‐treated apoE−/− mice (B and D). The figure shows hematoxylin and eosin staining (A and B), immunohistochemical visualization of 4‐HNE protein adducts (C and D), and quantitative analysis of the triglyceride content in the liver (right panel). Magnification, ×40. Mean±SEM; P<0.05; n=5 per group. Alda‐1 indicates N‐(1,3‐benzodioxol‐5‐ylmethyl)‐2,6‐dichlorobenzamide; apoE, apolipoprotein E; 4‐HNE, 4‐hydroxy‐2‐nonenal.
Figure 5.
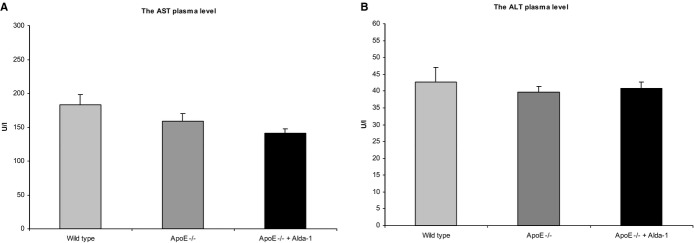
The aspartate aminotransferase (AST) (A) and the alanine aminotransferase (ALT) (B) plasma levels in C57BL/6J (wild‐type) mice, apoE −/− mice, and Alda‐1‐treated apoE −/− mice. Mean±SEM; P>0.05; n=8 per group. Alda‐1 indicates N‐(1,3‐benzodioxol‐5‐ylmethyl)‐2,6‐dichlorobenzamide; ALT, alanine aminotransferase; apoE, apolipoprotein E; AST, aspartate aminotransferase.
4‐HNE staining of livers revealed a decrease of 4‐HNE signal in Alda‐1‐treated apoE−/− mice, as compared to untreated mice (Figure 4C and 4D).
RT2 Profiler PCR Array
Use of Mouse Fatty Liver RT² Profiler PCR Array revealed that Alda‐1 treatment was associated with significant changes of expression of 3 genes; 1 (glucose‐6‐phosphate dehydrogenase X‐linked) was up‐regulated and 2 (acyl‐coenzyme A [CoA] oxidase 1 and insulin‐like growth factor binding protein 1) were down‐regulated (Table 2; Figure 6).
Table 2.
Genes Involved in Fatty Liver Disease and Expressed Differently Between Alda‐1 Group and Control Group
| Gene Name | Description | Fold Change | P Value (t test) |
|---|---|---|---|
| G6pdx | Glucose‐6‐phosphate dehydrogenase X‐linked | 2.03 | 0.008217 |
| Acox1 | Acyl‐coenzyme A oxidase 1, palmitoyl | –2.20 | 0.007957 |
| Igfbp1 | Insulin‐like growth factor‐binding protein 1 | –2.94 | 0.004703 |
Fold change >2.0; P<0.05; n=3 per group.
Figure 6.
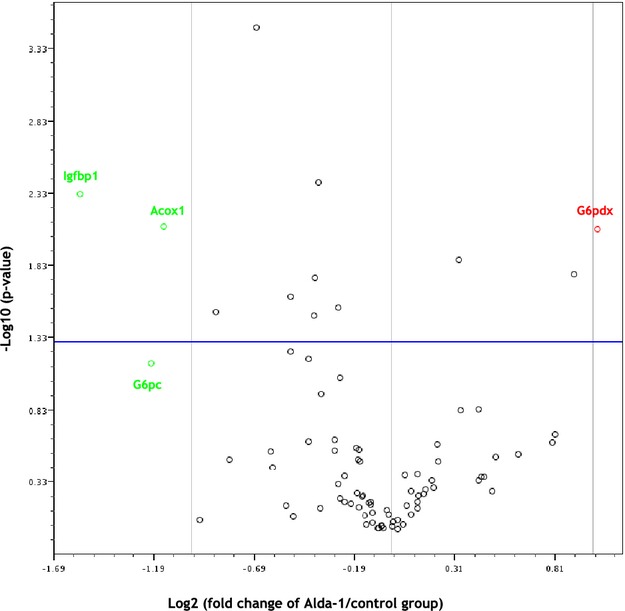
Volcano plot graphs of mouse fatty liver PCR array. Graph shows the log2 of fold change of gene expression between the Alda‐1 group and control group versus P value from the t test. up‐regulation, down‐regulation. Blue line indicates threshold 0.05 for P value. Acox indicates acyl‐CoA oxidase 1; Alda‐1, N‐(1,3‐benzodioxol‐5‐ylmethyl)‐2,6‐dichlorobenzamide; G6pc, glucose‐6‐phosphate, catalytic; G6pdx, glucose‐6‐phosphate dehydrogenase X‐linked; Igfbp1, insulin‐like growth factor binding protein 1.
Influence of Alda‐1 on Liver Mitoproteome
The representative 2DE gel image of liver mitochondrial proteins of apoE−/−, as well as selected pairs of spots showing differences between apoE−/− and Alda‐1‐treated apoE−/− mice, are presented in Figure 7A and 7B, respectively. LC‐MS/MS analysis from numbered spots showing significant differences are listed in Table 3. Quantitative results of differences in expression of mitochondrial proteins are shown in Figure 8. Accuracy of the isolation protocol and purity of the mitochondrial fractions were assessed by immunoblotting for α‐tubulin and COX‐IV (Figure 7C). Furthermore, the Alda‐1‐related increase in enoyl‐CoA hydratase (ECHS1) and 3‐ketoacyl‐CoA thiolase (ACAA2) levels in mitochondria were confirmed by Western blotting (Figure 9A). COX‐IV was used as a mitochondrial loading control. Interestingly, Alda‐1 slightly up‐regulated COX‐IV expression in liver mitochondria of apoE−/− mice (Figure 9A).
Figure 7.

Representative 2D map of mitochondrial proteins expressed in 6‐month‐old apolipoprotein E–deficient mice (A), with magnifications of spot pairs corresponding to enoyl‐CoA hydratase (ECHS1), 3‐ketoacyl‐CoA thiolase (ACAA2), and glutathione peroxidase 1 (GPX1) (B). Purity of mitochondrial fraction was assessed by the Western blotting method, showing the absence of cytosolic α‐tubulin l in mitochondrial fraction (C). Alda‐1 indicates N‐(1,3‐benzodioxol‐5‐ylmethyl)‐2,6‐dichlorobenzamide; apoE, apolipoprotein E; COX‐IV, cytochrome c oxidase.
Table 3.
Differentially Expressed Proteins in Liver Mitochondria of Alda‐1‐Treated ApoE−/− Mice*
| No. | Protein | UniProtKB Accession No. | Molecular Mass (kDa) | pI | Unique Peptides | Total Peptides | Protein Coverage (%) | Tandem Score |
|---|---|---|---|---|---|---|---|---|
| 1 | Tropomyosin 1, alpha | Q8BP43 | 32.8 | 4.69 | 6 | 16 | 15.8 | −48.4 |
| 2 | Cytochrome b5 | P56395 | 15.2 | 4.96 | 3 | 14 | 41.0 | −53.5 |
| 3 | Cathepsin Z | Q9WUU7 | 34 | 6.13 | 5 | 20 | 16.3 | −41.6 |
| 4 | Superoxide dismutase [Cu‐Zn] | P08228 | 15.9 | 6.02 | 4 | 14 | 32.5 | −39.1 |
| 5 | Component of pyruvate dehydrogenase complex, mitochondrial | Q8BMF4 | 67.9 | 8.81 | 8 | 24 | 16.0 | −37.2 |
| 6 | Glutathione peroxidase 1 | P11352 | 22.3 | 6.73 | 3 | 9 | 14.9 | −51.0 |
| 7 | Isovaleryl coenzyme A dehydrogenase | Q9JHI5 | 46.3 | 8.53 | 8 | 38 | 19.8 | −67.5 |
| 8 | Hydroxymethylglutaryl‐CoA lyase, mitochondrial | P38060 | 34.1 | 8.55 | 4 | 14 | 16.0 | −43.1 |
| 9 | Acyl‐coenzyme A oxidase 1 | Q9R0H0 | 74.6 | 8.64 | 3 | 7 | 5.6 | −25.0 |
| 10 | Fumarylacetoacetate hydrolase domain‐containing protein 2A | Q3TC72 | 34.7 | 8.42 | 3 | 8 | 8.9 | −20.1 |
| 11 | Probable 4‐hydroxy‐2‐oxoglutarate aldolase, mitochondrial | Q9DCU9 | 34.6 | 7.61 | 6 | 21 | 21.5 | −17.4 |
| 12 | Isocitrate dehydrogenase NADP, cytoplasmic | O88844 | 47.4 | 6.48 | 3 | 6 | 9.5 | −20.6 |
| 13 | Uricase | P25688 | 35 | 8.48 | 6 | 16 | 23.0 | −35.0 |
| 14 | Medium‐chain–specific acyl‐CoA dehydrogenase, mitochondrial | P45952 | 46.5 | 8.6 | 13 | 46 | 25.0 | −109.5 |
| 15 | Histidine triad nucleotide‐binding protein 2 | Q9D0S9 | 17.3 | 9.83 | 5 | 15 | 30.1 | −25.5 |
| 16 | Hydroxyacyl‐coenzyme A dehydrogenase, mitochondrial | Q61425 | 34.4 | 8.76 | 4 | 12 | 9.9 | −8.9 |
| 17 | 3‐Ketoacyl‐CoA thiolase, mitochondrial | Q8BWT1 | 41.8 | 8.33 | 11 | 42 | 38.0 | −122.6 |
| 18 | Uricase | P25688 | 35 | 8.48 | 28 | 98 | 48.2 | −233.9 |
| 19 | Enoyl‐CoA hydratase, mitochondrial | Q8BH95 | 31.5 | 8.76 | 9 | 32 | 34.5 | −69.6 |
| 20 | ATP synthase subunit alpha | Q03265 | 54.6 | 9.22 | 4 | 9 | 9.9 | −18.1 |
pI indicates isoelectric point. Tandem score is the log10 of expectation value, which reflects the number of matches expected to be found by chance in a database.*P<0.05; n=3 per group.
Figure 8.
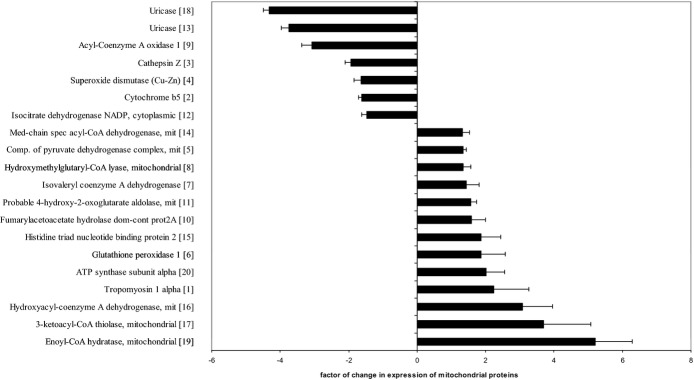
Relative changes in expression of mitochondrial proteins in 6‐month‐old Alda‐1‐treated apoE−/− group, compared to apoE−/− mitochondria. Corresponding spot numbers are shown in brackets (n=3 per group). Alda‐1, N‐(1,3‐benzodioxol‐5‐ylmethyl)‐2,6‐dichlorobenzamide; apoE, apolipoprotein E;.
Figure 9.
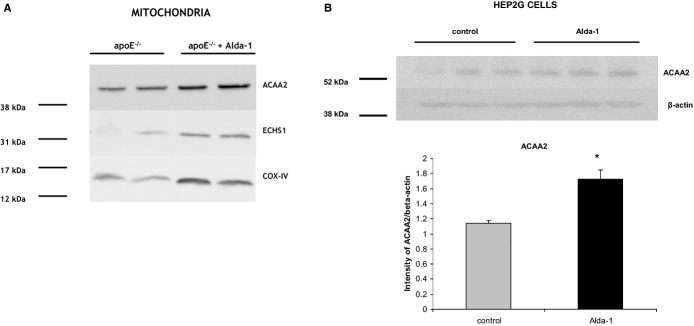
Western blotting of ECHS1, ACAA2, and COX‐IV in liver's mitochondria of 6‐month‐old apoE−/− mice and Alda‐1‐treated apoE−/− mice (A). Expression of ACAA2 in the human hepatocyte cell culture (HepG2) treated with palmitic acid (50 μmol/L) and Alda‐1 (10 μmol/L) versus palmitic acid (50 μmol/L) alone (control) (B). Mean±SEM; P<0.05; n=3 per group. ACAA2 indicates 3‐ketoacyl‐CoA thiolase; Alda‐1, N‐(1,3‐benzodioxol‐5‐ylmethyl)‐2,6‐dichlorobenzamide; apoE, apolipoprotein E; COX‐IV, cytochrome c oxidase; ECHS1, enoyl‐CoA hydratase; GPX1, glutathione peroxidase 1.
Alda‐1 Treatment of Hep2G Cells
Alda‐1 administration (10 μmol/L) resulted in the increase of ACAA2 level in human Hep2G cells treated with palmitic acid (50 μmol/L), as assessed by Western blotting (Figure 9B).
Discussion
It is known that ROS‐dependent peroxidation of polyunsaturated fatty acids, associated with generation of toxic aldehydes, is related to dysfunction of mitochondria and plays a role in atherogenesis and steatosis of the liver.22–23 In the present study, we observed that use of Alda‐1—an activator of ALDH2, which is the main mitochondrial enzyme responsible for detoxification of aldehydes—is associated with inhibition of atherogenesis and attenuation of hepatic steatosis in apoE−/− mice. To the best of our knowledge, this is the first report about the direct antiatherosclerotic activity of ALDH2 and possibility of use of its small‐molecular‐weight activator to inhibit atherogenesis in vivo. The relationship between ALDH2 and atherosclerosis has been only suggested in a few reports pertaining to the associations of certain ALDH2 polymorphisms and plasma HDL‐C levels as well as incidence/severity of coronary heart disease in humans.24–25 In our hands, however, the decrease of atherosclerotic lesions caused by Alda‐1 was not associated with any significant changes in plasma lipid profile. The action of Alda‐1 in apoE−/− mice was not associated with its influence on inflammatory processes related to progression of atherogenesis, because Alda‐1 neither changed the macrophage content in the plaques nor influenced levels of atherosclerosis‐related plasma markers of inflammation (slight decrease in levels of proinflammatory cytokines, such as IL‐12 and IL‐6, did not reach statistical significance).
Recently, the beneficial influence of ALDH2 stimulation in acute ischemia‐reperfusion injury of heart or brain has been attributed to many possible mechanisms, including attenuation of oxidative stress and clearance of reactive aldehydes,26 improvement of mitochondrial function and decrease of apoptosis,27 and augmentation28 or inhibition of autophagy.29 In our setting, Alda‐1 tended to decrease the content of 4‐HNE protein adducts and nitrotyrosine in atherosclerotic plaques, but such action did not reached statistical significance. Moreover, there were no changes upon Alda‐1 treatment in aortic mRNA levels of selected factors involved in antioxidative defense (SOD2, CAT, GPX1), regulation of apoptosis (Bax and Bcl‐2), mitogenesis (PGC1α and Sirt1), and autophagy (Atg5, Beclin1, LC3A, and LC3B). Thus, the question about exact molecular mechanism of antiatherosclerotic action of Alda‐1 in apoE−/− mice remains open. Our study does not allow for determining the cellular target of antiatherosclerotic action of Alda‐1. Previous reports clearly show the presence and biological function of ALDH2 in smooth muscle cells and endothelium. Interestingly, recently, Solito et al. have shown that Alda‐1‐dependent activation of ALDH2 prevents endothelial cell dysfunction induced by β‐amyloid in vitro.16 Whether endothelial action of Alda‐1 could be responsible for its antiatherosclerotic effect requires further investigation.
Growing number of evidence point to important mutual relationships between hepatic steatosis and atherosclerosis: NAFLD may serve as a predictor of CVD, and atherosclerosis seems to be a major player in the natural course of NAFLD.30–31 Importantly, mitochondrial dysfunction represents an important possible mechanism linking NAFLD and atherosclerosis.5–6 In our hands, stimulation of mitochondrial ALDH2 by Alda‐1 attenuated hepatic steatosis in apoE−/− mice and decreased tissue TG content, which was accompanied by lower 4‐HNE protein adduct formation. To understand the mechanism of Alda‐1 action in liver of apoE−/− mice, we first screened the influence of Alda‐1 on expression of a set of genes typically linked to fatty liver disease; Alda‐1 exerted only a small effect: Levels of only 3 of 84 genes were modestly changed. Liver expression of mRNA of insulin‐like growth factor binding protein 1 (IGFBP‐1) was down‐regulated upon treatment, which, at first glance, seems to be contradictory to results of Li et al., who described that elevated IGFBP‐1 liver and serum levels to be candidates for markers of early liver steatosis.32 However, although these investigators used mouse model, they fed animals with alcohol and studied an early stage of alcohol induced liver injury, not NAFLD. Interestingly, a recent study of Kwon et al. shows that deficiency of ALDH2 worsens liver inflammation and fibrosis in mice, but makes the hepatocytes more resistant to steatosis.33 Importantly, these results, somehow contradictory to ours, were again relevant to alcoholic fatty liver disease.
Mitochondria are at the crossroads of many cellular processes related to supply of energy, metabolism of lipids and amino acids, signaling, regulation of cell death, and cell growth. It was demonstrated that mitochondrial dysfunction plays an important role in fatty liver disease.6–7,34 Over the last decade, the proteomic approach has been increasingly used to describe the role that mitochondria play in various disorders.35 The proteomic analysis of atherosclerotic plaques in apoE−/− mice, first done by Mayr et al., still represents a methodological challenge36 therefore, in this study, we focused on liver mitochondria. The analysis of liver mitoproteome‐treated apoE−/− mice revealed 20 differentially expressed proteins upon Alda‐1 treatment. Among them, the most up‐regulated were proteins related to beta‐oxidation of fatty acids in mitochondria including enoyl‐CoA hydratase (ECHS1), ACAA2, 3‐hydroxyacyl‐CoA thiolase (HCDH), and medium‐chain acyl‐CoA dehydrogenase (MCAD). All these proteins take part in fatty acid oxidation (FAO) of medium‐ and short‐chain‐length fatty acids.37 Interestingly, COX‐IV levels in mitochondrial fractions tended to follow the pattern of ACAA2 and ECHS1, which may indicate a positive influence of Alda‐1 on mitogenesis in the liver. Of note, the influence of Alda‐1 on expression of ACAA2 is preserved in a crude in vitro model of lipotoxicity—Hep2G cells cultured in the presence of palmitic acid.
Surprisingly, Alda‐1 administration down‐regulated expression of peroxisomal acyl‐CoA oxidase 1 (ACOX1), both at the gene and protein level. It should be noted, however, that ACOX1 is involved in the first step of peroxisomal FAO of very long fatty acids, which is not coupled to ATP synthesis and yields toxic hydrogen peroxide.38 It is recognized that impairment of liver FAO is a hallmark of NAFLD. Zhang et al. have shown that down‐regulation of ECHS1 is associated with hepatic steatosis in rats after exposure to a high‐fat diet.39 ECHS1/HCDH/ACAA2 constitute heterotrimeric MTP protein that mediates the last 3 steps of FAO for long‐chain‐length fatty acids.40 It was shown that mice heterozygous for the MTP defect (MTP+/−) develop hepatic steatosis and insulin resistance.41 Clearly, up‐regulation by Alda‐1 of proteins involved in mitochondrial FAO could represent the mechanism of its beneficial action in hepatic steatosis.
In our hands, treatment with Alda‐1 resulted in a significant increase in mitochondrial expression of histidine triad nucleotide‐binding protein 2 (HINT2). Interestingly, Martin et al. have shown that Hint2 knockout (KO) mice have decreased cellular respiration, display deformed mitochondria, and develop fatty liver.42 Of note, Hint2 KO mice show a global increase in mitochondrial protein acetylation, which could reduce the activity of proteins involved in FAO. Given that HINT2 positively regulates mitochondrial lipid metabolism, respiration, and glucose homeostasis, it is tempting to speculate that up‐regulation of HINT2 by Alda‐1 may be responsible for reduction of hepatic steatosis in apoE−/− mice.
Mitochondrial oxidative stress plays a pivotal role in the development of NAFLD.43 The mitochondrial abnormalities associated with NAFLD include ultrastructural lesions, depletion of mtDNA, decreased activity of respiratory chain complexes, and impaired mitochondrial β‐oxidation.7 Mitochondrial respiratory chain dysfunction can directly lead to the production of ROS. Moreover, cytochrome c oxidase can be inhibited by low levels of ROS and 4‐HNE.7 Importantly, Alda‐1 changed the expression of proteins related to oxidative stress in liver mitochondria of apoE−/− mice; it up‐regulated glutathione peroxidase‐1 (GPX1), as well as down‐regulated uricase (UOX), at protein levels and up‐regulated glucose‐6‐phosphate dehydrogenase X‐linked (G6PDX) mRNA. GPX1 is a crucial antioxidant enzyme presented in cytosol and mitochondria and involved in preventing the harmful accumulation of intracellular hydrogen peroxides and lipid peroxides by converting them to water and alcohols, respectively.44 In our previous study, we have shown that GPX1 is down‐regulated in liver mitochondria of apoE−/− mice, compared to C57BL/6J mice.45 Furthermore, it was demonstrated that deficiency of GPX1 accelerates the progression of atherosclerosis in apoE−/− mice.46–47 Of note, G6PDX, up‐regulated by Alda‐1 at the gene level, catalyzes the rate‐determining step in the pentose phosphate pathway and produces the NADPH necessary to fuel glutathione recycling for use by GPX to remove excess hydrogen peroxides.48 In turn, uric acid is a powerful antioxidant and down‐regulation of UOX, which catalyzes the oxidation of uric acid to 5‐hydroxyisourate, may result in maintaining its high levels in mitochondria. On the other hand, Alda‐1 treatment was associated with down‐regulation of superoxide dismutase [Cu‐Zn] (SOD1), an antioxidant enzyme localized mainly in the cytosol with a smaller fraction in the intermembrane space (IMS) of mitochondria.49 The trafficking of SOD1 to mitochondria seems to be required in protecting cells against mitochondria‐derived oxidative stress. However, it was shown that SOD1 competes with cytochrome c for superoxide in IMS and generates hydroperoxide, which then could react with cytochrome c and form a strong oxidant—peroxidase compound I‐type intermediate, leading to mitochondrial injury and apoptosis.50 Interestingly, one of the mitochondrial FAO proteins up‐regulated by Alda‐1, ACAA2, was found to colocalize with BCL2/adenovirus E1B 19 kDa‐interacting protein 3 (BNIP3) in mitochondria and to abolish BNIP3‐mediated apoptosis in vitro.51 Clearly, further investigation is required to clarify the effect of Alda‐1 on proteins related to mitochondrial oxidative stress and regulation of apoptosis.
It was shown that the association between regular alcohol intake and incident carotid atherosclerosis (early atherogenesis) is J‐shaped, with light drinkers facing a lower risk than either heavy drinkers or abstainers.52 Interestingly, the exact molecular mechanism of such a phenomenon is still not clear. It has been demonstrated that mitochondrial ALDH2 is a key enzyme downstream of ethanol‐induced protection in the heart ischemia model.15 Given that stimulation of ALDH2 activity by Alda‐1 mimics the induction of the enzyme by regular intake of low amounts of ethanol, we are tempted to speculate that ALDH2 induction may represent a plausible explanation of the beneficial action of low amounts of ethanol.
In summary, we have shown that prolonged use of ALDH2 activator Alda‐1 was associated with a decrease of atherosclerosis and attenuation of hepatic steatosis in apoE−/− mice. The antiatherosclerotic action of Alda‐1 in apoE−/− mice was not associated with changes in plasma lipid profile. The analysis of liver mitoproteome revealed multiple effects of Alda‐1 on mitochondrial proteins related to beta‐oxidation and oxidative stress defense. The pattern of changes suggests a beneficial, mitochondrial effect of Alda‐1 in NAFLD; however, the exact liver functional consequences of the revealed alterations as well as the mechanism(s) of anti‐atherosclerotic Alda‐1 action require further investigation.
Sources of Funding
This study was supported by grants from National Science Centre (NCN; 2011/01/N/NZ4/01145).
Disclosures
None.
Acknowledgments
A. Stachowicz and K. Głombik acknowledge the financial support from the project Interdisciplinary PhD Studies “Molecular sciences for medicine” (cofinanced by the European Social Fund within the Human Capital Operational Program). Publication was supported by the Faculty of Medicine of Jagiellonian University Medical College (Leading National Research Centre 2012–2017).
References
- 1.Lloyd‐Jones DM. Cardiovascular risk prediction: basic concepts, current status, and future directions. Circulation. 2010; 121:1768-1777. [DOI] [PubMed] [Google Scholar]
- 2.Libby P, Okamoto Y, Rocha VZ, Folco E. Inflammation in atherosclerosis: transition from theory to practice. Circ J. 2010; 74:213-220. [DOI] [PubMed] [Google Scholar]
- 3.Targher G. Non‐alcoholic fatty liver disease, the metabolic syndrome and the risk of cardiovascular disease: the plot thickens. Diabet Med. 2007; 24:1-6. [DOI] [PubMed] [Google Scholar]
- 4.Cohen JC, Horton JD, Hobbs HH. Human fatty liver disease: old questions and new insights. Science. 2011; 332:1519-1523. [DOI] [PMC free article] [PubMed] [Google Scholar]
- 5.Grattagliano I, de Bari O, Bernardo TC, Oliveira PJ, Wang DQ, Portincasa P. Role of mitochondria in nonalcoholic fatty liver disease—from origin to propagation. Clin Biochem. 2012; 45:610-618. [DOI] [PubMed] [Google Scholar]
- 6.Victor VM, Apostolova N, Herance R, Hernandez‐Mijares A, Rocha M. Oxidative stress and mitochondrial dysfunction in atherosclerosis: mitochondria‐targeted antioxidants as potential therapy. Curr Med Chem. 2009; 16:4654-4667. [DOI] [PubMed] [Google Scholar]
- 7.Begriche K, Massart J, Robin MA, Bonnet F, Fromenty B. Mitochondrial adaptations and dysfunctions in nonalcoholic fatty liver disease. Hepatology. 2013; 58:1497-1507. [DOI] [PubMed] [Google Scholar]
- 8.Hulsmans M, Van Dooren E, Holvoet P. Mitochondrial reactive oxygen species and risk of atherosclerosis. Curr Atheroscler Rep. 2012; 14:264-276. [DOI] [PubMed] [Google Scholar]
- 9.Hulsmans M, Holvoet P. The vicious circle between oxidative stress and inflammation in atherosclerosis. J Cell Mol Med. 2010; 14:70-78. [DOI] [PMC free article] [PubMed] [Google Scholar]
- 10.Dmitriev LF, Titov VN. Lipid peroxidation in relation to ageing and the role of endogenous aldehydes in diabetes and other age‐related diseases. Ageing Res Rev. 2010; 9:200-210. [DOI] [PubMed] [Google Scholar]
- 11.Min AK, Kim MK, Kim HS, Seo HY, Lee KU, Kim JG, Park KG, Lee IK. Alpha‐lipoic acid attenuates methionine choline deficient diet‐induced steatohepatitis in C57BL/6 mice. Life Sci. 2012; 90:200-205. [DOI] [PubMed] [Google Scholar]
- 12.Ohta S, Ohsawa I. Dysfunction of mitochondria and oxidative stress in the pathogenesis of Alzheimer's disease: on defects in the cytochrome c oxidase complex and aldehyde detoxification. J Alzheimers Dis. 2006; 9:155-166. [DOI] [PubMed] [Google Scholar]
- 13.Chen CH, Sun L, Mochly‐Rosen D. Mitochondrial aldehyde dehydrogenase and cardiac diseases. Cardiovasc Res. 2010; 88:51-57. [DOI] [PMC free article] [PubMed] [Google Scholar]
- 14.Perez‐Miller S, Younus H, Vanam R, Chen CH, Mochly‐Rosen D, Hurley TD. Alda‐1 is an agonist and chemical chaperone for the common human aldehyde dehydrogenase 2 variant. Nat Struct Mol Biol. 2010; 17:159-164. [DOI] [PMC free article] [PubMed] [Google Scholar]
- 15.Chen CH, Budas GR, Churchill EN, Disatnik MH, Hurley TD, Mochly‐Rosen D. Activation of aldehyde dehydrogenase‐2 reduces ischemic damage to the heart. Science. 2008; 321:1493-1495. [DOI] [PMC free article] [PubMed] [Google Scholar]
- 16.Solito R, Corti F, Chen CH, Mochly‐Rosen D, Giachetti A, Ziche M, Donnini S. Mitochondrial aldehyde dehydrogenase‐2 activation prevents beta‐amyloid‐induced endothelial cell dysfunction and restores angiogenesis. J Cell Sci. 2013; 126:1952-1961. [DOI] [PMC free article] [PubMed] [Google Scholar]
- 17.Kolovou G, Anagnostopoulou K, Mikhailidis DP, Cokkinos DV. Apolipoprotein E knockout models. Curr Pharm Des. 2008; 14:338-351. [DOI] [PubMed] [Google Scholar]
- 18.Bonomini F, Filippini F, Hayek T, Aviram M, Keidar S, Rodella LF, Coleman R, Rezzani R. Apolipoprotein E and its role in aging and survival. Exp Gerontol. 2010; 45:149-157. [DOI] [PubMed] [Google Scholar]
- 19.Bradford MM. A rapid and sensitive method for the quantitation of microgram quantities of protein utilizing the principle of protein‐dye binding. Anal Biochem. 1976; 72:248-254. [DOI] [PubMed] [Google Scholar]
- 20.Yan JX, Wait R, Berkelman T, Harry RA, Westbrook JA, Wheeler CH, Dunn MJ. A modified silver staining protocol for visualization of proteins compatible with matrix‐assisted laser desorption/ionization and electrospray ionization‐mass spectrometry. Electrophoresis. 2000; 21:3666-3672. [DOI] [PubMed] [Google Scholar]
- 21.Shevchenko A, Tomas H, Havlis J, Olsen JV, Mann M. In‐gel digestion for mass spectrometric characterization of proteins and proteomes. Nat Protoc. 2006; 1:2856-2860. [DOI] [PubMed] [Google Scholar]
- 22.Konishi M, Iwasa M, Araki J, Kobayashi Y, Katsuki A, Sumida Y, Nakagawa N, Kojima Y, Watanabe S, Adachi Y, Kaito M. Increased lipid peroxidation in patients with non‐alcoholic fatty liver disease and chronic hepatitis C as measured by the plasma level of 8‐isoprostane. J Gastroenterol Hepatol. 2006; 21:1821-1825. [DOI] [PubMed] [Google Scholar]
- 23.Chapple SJ, Cheng X, Mann GE. Effects of 4‐hydroxynonenal on vascular endothelial and smooth muscle cell redox signaling and function in health and disease. Redox Biol. 2013; 1:319-331. [DOI] [PMC free article] [PubMed] [Google Scholar]
- 24.Hao PP, Xue L, Wang XL, Chen YG, Wang JL, Ji WQ, Xu F, Wei SJ, Zhang Y. Association between aldehyde dehydrogenase 2 genetic polymorphism and serum lipids or lipoproteins: a meta‐analysis of seven East Asian populations. Atherosclerosis. 2010; 212:213-216. [DOI] [PubMed] [Google Scholar]
- 25.Narita M, Kitagawa K, Nagai Y, Hougaku H, Hashimoto H, Sakaguchi M, Yang X, Takeshita T, Morimoto K, Matsumoto M, Hori M. Effects of aldehyde dehydrogenase genotypes on carotid atherosclerosis. Ultrasound Med Biol. 2003; 29:1415-1419. [DOI] [PubMed] [Google Scholar]
- 26.Fu SH, Zhang HF, Yang ZB, Li TB, Liu B, Lou Z, Ma QL, Luo XJ, Peng J. Alda‐1 reduces cerebral ischemia/reperfusion injury in rat through clearance of reactive aldehydes. Naunyn Schmiedebergs Arch Pharmacol. 2014; 387:87-94. [DOI] [PubMed] [Google Scholar]
- 27.Gomes KM, Campos JC, Bechara LR, Queliconi B, Lima VM, Disatnik MH, Magno P, Chen CH, Brum PC, Kowaltowski AJ, Mochly‐Rosen D, Ferreira JC. Aldehyde dehydrogenase 2 activation in heart failure restores mitochondrial function and improves ventricular function and remodelling. Cardiovasc Res. 2014; 103:498-508. [DOI] [PMC free article] [PubMed] [Google Scholar]
- 28.Guo Y, Yu W, Sun D, Wang J, Li C, Zhang R, Babcock SA, Li Y, Liu M, Ma M, Shen M, Zeng C, Li N, He W, Zou Q, Zhang Y, Wang H. A novel protective mechanism for mitochondrial aldehyde dehydrogenase (ALDH2) in type I diabetes‐induced cardiac dysfunction: role of AMPK‐regulated autophagy. Biochim Biophys Acta. 2014. ‐‐10.1016/j.bbadis.2014.05.017 [DOI] [PubMed] [Google Scholar]
- 29.Sun A, Cheng Y, Zhang Y, Zhang Q, Wang S, Tian S, Zou Y, Hu K, Ren J, Ge J. Aldehyde dehydrogenase 2 ameliorates doxorubicin‐induced myocardial dysfunction through detoxification of 4‐HNE and suppression of autophagy. J Mol Cell Cardiol. 2014; 71:92-104.10.1016/j.yjmcc.2014.01.002 [DOI] [PubMed] [Google Scholar]
- 30.Lonardo A, Sookoian S, Chonchol M, Loria P, Targher G. Cardiovascular and systemic risk in nonalcoholic fatty liver disease ‐ atherosclerosis as a major player in the natural course of NAFLD. Curr Pharm Des. 2013; 19:5177-5192. [PubMed] [Google Scholar]
- 31.Ahmed MH, Barakat S, Almobarak AO. Nonalcoholic fatty liver disease and cardiovascular disease: has the time come for cardiologists to be hepatologists? J Obes. 2012; 201210.1155/2012/483135 [DOI] [PMC free article] [PubMed] [Google Scholar]
- 32.Li HH, Doiron K, Patterson AD, Gonzalez FJ, Fornace AJ., Jr Identification of serum insulin‐like growth factor binding protein 1 as diagnostic biomarker for early‐stage alcohol‐induced liver disease. J Transl Med. 2013; 1110.1186/1479‐5876‐11‐266 [DOI] [PMC free article] [PubMed] [Google Scholar]
- 33.Kwon HJ, Won YS, Park O, Chang B, Duryee MJ, Thiele GE, Matsumoto A, Singh S, Abdelmegeed MA, Song BJ, Kawamoto T, Vasiliou V, Thiele GM, Gao B. Aldehyde dehydrogenase 2 deficiency ameliorates alcoholic fatty liver but worsens liver inflammation and fibrosis in mice. Hepatology. 2014; 60:146-157. [DOI] [PMC free article] [PubMed] [Google Scholar]
- 34.Stachowicz A, Suski M, Olszanecki R, Madej J, Okon K, Korbut R. Proteomic analysis of liver mitochondria of apolipoprotein E knockout mice treated with metformin. J Proteomics. 2012; 77:167-175.10.1016/j.jprot.2012.08.015 [DOI] [PubMed] [Google Scholar]
- 35.Warda M, Kim HK, Kim N, Ko KS, Rhee BD, Han J. A matter of life, death and diseases: mitochondria from a proteomic perspective. Expert Rev Proteomics. 2013; 10:97-111. [DOI] [PubMed] [Google Scholar]
- 36.Mayr M, Chung YL, Mayr U, Yin X, Ly L, Troy H, Fredericks S, Hu Y, Griffiths JR, Xu Q. Proteomic and metabolomic analyses of atherosclerotic vessels from apolipoprotein E‐deficient mice reveal alterations in inflammation, oxidative stress, and energy metabolism. Arterioscler Thromb Vasc Biol. 2005; 25:2135-2142. [DOI] [PubMed] [Google Scholar]
- 37.Serra D, Mera P, Malandrino MI, Mir JF, Herrero L. Mitochondrial fatty acid oxidation in obesity. Antioxid Redox Signal. 2013; 19:269-284. [DOI] [PMC free article] [PubMed] [Google Scholar]
- 38.Hashimoto T. Peroxisomal beta‐oxidation enzymes. Cell Biochem Biophys. 2000; 32:63-72. [DOI] [PubMed] [Google Scholar]
- 39.Zhang X, Yang J, Guo Y, Ye H, Yu C, Xu C, Xu L, Wu S, Sun W, Wei H, Gao X, Zhu Y, Qian X, Jiang Y, Li Y, He F. Functional proteomic analysis of nonalcoholic fatty liver disease in rat models: enoyl‐coenzyme a hydratase down‐regulation exacerbates hepatic steatosis. Hepatology. 2010; 51:1190-1199. [DOI] [PubMed] [Google Scholar]
- 40.Rector RS, Payne RM, Ibdah JA. Mitochondrial trifunctional protein defects: clinical implications and therapeutic approaches. Adv Drug Deliv Rev. 2008; 60:1488-1496. [DOI] [PMC free article] [PubMed] [Google Scholar]
- 41.Ibdah JA, Perlegas P, Zhao Y, Angdisen J, Borgerink H, Shadoan MK, Wagner JD, Matern D, Rinaldo P, Cline JM. Mice heterozygous for a defect in mitochondrial trifunctional protein develop hepatic steatosis and insulin resistance. Gastroenterology. 2005; 128:1381-1390. [DOI] [PubMed] [Google Scholar]
- 42.Martin J, Maurhofer O, Bellance N, Benard G, Graber F, Hahn D, Galinier A, Hora C, Gupta A, Ferrand G, Hoppeler H, Rossignol R, Dufour JF, St Pierre MV. Disruption of the histidine triad nucleotide‐binding hint2 gene in mice affects glycemic control and mitochondrial function. Hepatology. 2013; 57:2037-2048. [DOI] [PubMed] [Google Scholar]
- 43.Petrosillo G, Portincasa P, Grattagliano I, Casanova G, Matera M, Ruggiero FM, Ferri D, Paradies G. Mitochondrial dysfunction in rat with nonalcoholic fatty liver involvement of complex I, reactive oxygen species and cardiolipin. Biochim Biophys Acta. 2007; 1767:1260-1267. [DOI] [PubMed] [Google Scholar]
- 44.Lubos E, Loscalzo J, Handy DE. Glutathione peroxidase‐1 in health and disease: from molecular mechanisms to therapeutic opportunities. Antioxid Redox Signal. 2011; 15:1957-1997. [DOI] [PMC free article] [PubMed] [Google Scholar]
- 45.Suski M, Olszanecki R, Madej J, Toton‐Zuranska J, Niepsuj A, Jawien J, Bujak‐Gizycka B, Okon K, Korbut R. Proteomic analysis of changes in protein expression in liver mitochondria in apoE knockout mice. J Proteomics. 2011; 74:887-893. [DOI] [PubMed] [Google Scholar]
- 46.Torzewski M, Ochsenhirt V, Kleschyov AL, Oelze M, Daiber A, Li H, Rossmann H, Tsimikas S, Reifenberg K, Cheng F, Lehr HA, Blankenberg S, Forstermann U, Munzel T, Lackner KJ. Deficiency of glutathione peroxidase‐1 accelerates the progression of atherosclerosis in apolipoprotein E‐deficient mice. Arterioscler Thromb Vasc Biol. 2007; 27:850-857. [DOI] [PubMed] [Google Scholar]
- 47.Lewis P, Stefanovic N, Pete J, Calkin AC, Giunti S, Thallas‐Bonke V, Jandeleit‐Dahm KA, Allen TJ, Kola I, Cooper ME, de Haan JB. Lack of the antioxidant enzyme glutathione peroxidase‐1 accelerates atherosclerosis in diabetic apolipoprotein E‐deficient mice. Circulation. 2007; 115:2178-2187. [DOI] [PubMed] [Google Scholar]
- 48.Hecker PA, Leopold JA, Gupte SA, Recchia FA, Stanley WC. Impact of glucose‐6‐phosphate dehydrogenase deficiency on the pathophysiology of cardiovascular disease. Am J Physiol Heart Circ Physiol. 2013; 304:H491-H500. [DOI] [PMC free article] [PubMed] [Google Scholar]
- 49.Fukai T, Ushio‐Fukai M. Superoxide dismutases: role in redox signaling, vascular function, and diseases. Antioxid Redox Signal. 2011; 15:1583-1606. [DOI] [PMC free article] [PubMed] [Google Scholar]
- 50.Goldsteins G, Keksa‐Goldsteine V, Ahtoniemi T, Jaronen M, Arens E, Akerman K, Chan PH, Koistinaho J. Deleterious role of superoxide dismutase in the mitochondrial intermembrane space. J Biol Chem. 2008; 283:8446-8452. [DOI] [PubMed] [Google Scholar]
- 51.Cao W, Liu N, Tang S, Bao L, Shen L, Yuan H, Zhao X, Lu H. Acetyl‐Coenzyme A acyltransferase 2 attenuates the apoptotic effects of BNIP3 in two human cell lines. Biochim Biophys Acta. 2008; 1780:873-880. [DOI] [PubMed] [Google Scholar]
- 52.Kiechl S, Willeit J, Rungger G, Egger G, Oberhollenzer F, Bonora E. Alcohol consumption and atherosclerosis: what is the relation? Prospective results from the Bruneck Study. Stroke. 1998; 29:900-907. [DOI] [PubMed] [Google Scholar]