

Abstract
Background
We developed risk models for predicting acute kidney injury (AKI) and AKI requiring dialysis (AKI‐D) after percutaneous coronary intervention (PCI) to support quality assessment and the use of preventative strategies.
Methods and Results
AKI was defined as an absolute increase of ≥0.3 mg/dL or a relative increase of 50% in serum creatinine (AKIN Stage 1 or greater) and AKI‐D was a new requirement for dialysis following PCI. Data from 947 012 consecutive PCI patients and 1253 sites participating in the NCDR Cath/PCI registry between 6/09 and 7/11 were used to develop the model, with 70% randomly assigned to a derivation cohort and 30% for validation. AKI occurred in 7.33% of the derivation and validation cohorts. Eleven variables were associated with AKI: older age, baseline renal impairment (categorized as mild, moderate, and severe), prior cerebrovascular disease, prior heart failure, prior PCI, presentation (non‐ACS versus NSTEMI versus STEMI), diabetes, chronic lung disease, hypertension, cardiac arrest, anemia, heart failure on presentation, balloon pump use, and cardiogenic shock. STEMI presentation, cardiogenic shock, and severe baseline CKD were the strongest predictors for AKI. The full model showed good discrimination in the derivation and validation cohorts (c‐statistic of 0.72 and 0.71, respectively) and identical calibration (slope of calibration line=1.01). The AKI‐D model had even better discrimination (c‐statistic=0.89) and good calibration (slope of calibration line=0.99).
Conclusion
The NCDR AKI prediction models can successfully risk‐stratify patients undergoing PCI. The potential for this tool to aid clinicians in counseling patients regarding the risk of PCI, identify patients for preventative strategies, and support local quality improvement efforts should be prospectively tested.
Keywords: kidney injury, percutaneous coronary intervention, renal function, renal insufficiency, risk assessment, risk prediction
Introduction
Acute kidney injury (AKI) is a serious complication of PCI and is associated with an increased risk of myocardial infarction, dialysis and death.1–5 It is common, with a reported incidence after PCI of between 3% and 19% and can be mitigated by the use of hydration and the avoidance of excess contrast.6–9 It is also associated with a number of pre‐procedural clinical factors such as pre‐existing chronic kidney disease that make it an ideal target for risk modeling. However, previous models of AKI were developed over 10 years ago, prior to the contemporary use of hydration protocols and low‐osmolar contrast agents, and were not based on the Acute Kidney Injury Network (AKIN) criteria, which has become the contemporary consensus criteria for defining AKI.2,5,10 Moreover, the importance of such a model has expanded in the current era, where there is a growing focus on safety, quality improvement, patient‐centered care, and personalized medicine.11–12
With respect to quality assessment and improvement, the American College of Cardiology (ACC) sought to provide risk‐adjusted AKI rates to hospitals participating in its National Cardiovascular Data Registry (NCDR) so that comparative benchmarking and quality improvement could occur. Moreover, by prospectively knowing the AKI risk of an individual patient, it would also be possible to tailor treatment (eg, use of hydration protocols, low‐osmolar contrast agents, staging of multi‐vessel PCI procedures for patient safety reasons to minimize acute contrast exposure, etc.) to maximize safety and outcomes. Risk‐adjusted models of other outcomes are increasingly being used to facilitate medical decision making,13 personalize informed consent documents,14 and support quality improvement efforts15 and have been used in to improve patients' engagement and understanding of the risks and benefits of PCI.16–19 Accordingly, we used the ACC NCDR to develop and validate a parsimonious risk model for AKI and AKI requiring dialysis (AKI‐D) to support more accurate informed consent, safer care, and quality improvement.
Methods
Study Population
The NCDR Cath‐PCI registry, co‐sponsored by the ACC and the Society for Cardiovascular Angiography and Interventions, has been previously described.20–21 The registry catalogs data on patient and hospital characteristics, clinical presentation, treatments, and outcomes associated with PCI from >1000 sites across the United States. The data are entered into ACC‐certified software at participating institutions. There is a comprehensive data quality program, including both data quality report specifications for data capture and transmission and an auditing program.22 The data collected are exported in a standard format to the ACC Heart House (Washington, DC). Complete definitions of all variables were prospectively defined by an ACC committee and are available at the ACC NCDR web site (http://www.acc.org/ncdr/cathlab.htm).
For this study, we identified all patients receiving PCI between June 1, 2009 and June 30, 2011 enrolled in the NCDR CathPCI Registry (N=1 254 089). We excluded patients discharged on the day of their procedure (n=42 029; 3.4%), without a pre‐ and post‐procedure serum creatinine (n=207 789; 16.6%), patients undergoing multiple PCI's during a single hospitalization (n=32 999; 2.6%), and patients currently on dialysis at the time of their PCI (n=24 517; 2.0%). The final analytic cohort included 947 012 patients receiving PCI that were randomly divided into a 70% derivation (n=662 504) and 30% validation cohort (n=284 508; Figure 1). A comparison of those with and without creatinine levels before or after their procedure with those included in the cohort revealed minimal differences (results available from authors upon request).
Figure 1.
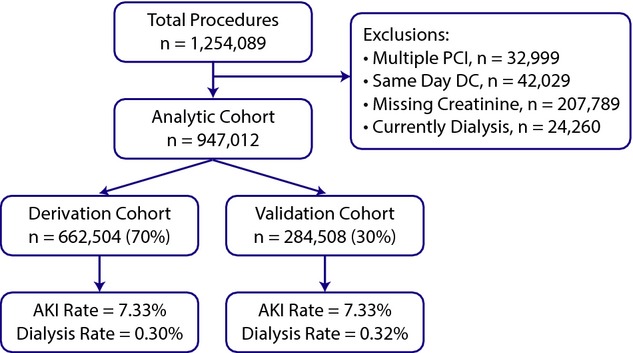
Study flow.
Study Outcomes and Variables
The primary outcome was AKI, using the change from pre‐procedure to peak serum creatinine after the procedure. We used the contemporary standardized definition for AKI as described by the Acute Kidney Injury Network for Stage 1 or greater injury, which is defined as a ≥0.3 mg/dL absolute or ≥1.5‐fold relative increase in post‐PCI creatinine or new initiation of dialysis.23 As urine output is not collected within the NCDR registry, this facet of the definition was omitted, which may have led to some patients developing a reduction in urine output without a rise in their creatinine being misclassified as not having AKI. AKI requiring dialysis (AKI‐D) was identified using a pre‐defined NCDR data element for acute or worsening renal failure necessitating new renal dialysis by the participating centers. Patients with AKI‐D were included in the AKI group but were also examined separately, given its clinical importance, to identify independent predictors for requiring dialysis after PCI.
Framing of the Analysis
The purpose of risk‐adjustment to support quality assessment/improvement or tailored approaches to treatment is to account for patient characteristics prior to the initiation of treatment.24 We therefore considered potential predictor variables to be those that existed prior to the initiation of PCI. Although contrast is clearly known to be associated with the development of AKI and AKI‐D, it was not considered as a potential predictor as the amount of contrast needed is not known at the start of PCI, varies substantially by operator and hospital, and may mask differences in the safety of PCI across centers if it were accounted for in the risk model.
Data Analysis
Data are described as proportions or mean±SD. Baseline patient characteristics and variables with clinical or statistically significant associations with both AKI and AKI‐D were included in separate multivariable logistic regression models. In the derivation cohort, iterative model construction was used to identify significant bivariate associations of clinically relevant variables with AKI and dialysis. The full list of candidate variables included: Age, Gender, BMI, IABP Before Procedure, baseline CKD status (mild=eGFR 45 to 60, moderate=30 to 45, severe <30 mL/min), HF within the prior 2 weeks, Diabetes, Hypertension, Prior MI, Prior HF, Prior PCI, Prior CABG, Prior CVD, Prior PAD, CLD, NSTEMI/Unstable Angina, STEMI, Prior Shock, Prior Cardiac Arrest, Anemia (Hgb<10), and Transfer‐in Status. Missing categorical variables (<1%) were imputed to the most common value, and missing continuous variables were imputed to relevant group‐specific medians.
To create a more parsimonious, practical model for clinical use, variables were ranked by the strength of their association with AKI and sequentially removed until the adjusted R2 of the logistic regression model reached 95% of the full model.25 The loss of discriminatory power with the reduced model was compared with the full model using the computed integrated discrimination improvement (IDI)26 and the difference in c‐statistics. To further support prospective clinical use of the model, we created a simple integer‐scoring model by assigning a weighted integer coefficient value corresponding to each variable's β‐weight for the prediction of both AKI and AKI‐D.27
Finally, model calibration and discrimination for both the full and integer models of AKI and AKI‐D were evaluated in the 30% validation sample using the c‐statistics and the slope of the predicted versus observed rates of AKI/Dialysis within deciles of predicted AKI/Dialysis risk. SAS (version 9.2; SAS Institute, Cary, NC) statistical software was used for all statistical testing.
Sensitivity Analysis
To address whether a single model can adequately risk stratify patients with distinctly different clinical settings, we tested a number of interaction terms including, STEMI, NSTEMI, and baseline CKD and a spline term for age. None of the interaction terms were significant suggesting the model performed well in those patient subsets and arguing against separate models. Observed versus expected plots for the clinically important subsets of patients with severe CKD, STEMI, NSTEMI, and Non‐ACS were also examined and the c‐statistics and calibration slope of the model within each subgroup assessed.
Results
Baseline characteristics, in‐hospital treatments, and outcomes of the 662 504 patients used to develop the model (derivation cohort) and 284 508 used to test the model (validation cohort) are shown in Table 1. There were no statistically or clinically significant differences in baseline demographics, comorbidities, treatment, or outcomes between the derivation and validation cohorts. The mean age was 64.8±12.2 years and 67% were men. More than 80% had a history of hypertension and hyperlipidemia, with 28% either currently smoking or having quit within the past year. Approximately 36% of patients had a history of diabetes and 30% had a history of myocardial infarction. Most patients underwent PCI for an acute coronary syndrome, either high‐risk NSTEMI/unstable angina (55.3%) or immediate PCI for STEMI (15.7%).
Table 1.
Baseline Characteristics of the Cohorts
| Total (n = 947 012) | Cohort | ||
|---|---|---|---|
| Derivation (n = 662 504) | Validation (n = 284 508) | ||
| Demographics | |||
| Age, y | 64.8±12.2 | 64.8±12.2 | 64.9±12.2 |
| Sex | |||
| Male | 635 967 (67.2%) | 445 016 (67.2%) | 190 951 (67.1%) |
| Female | 311 045 (32.8%) | 217 488 (32.8%) | 93 557 (32.9%) |
| Race | |||
| White | 838 384 (88.5%) | 586 634 (88.5%) | 251 750 (88.5%) |
| Black or African American | 74 840 (7.9%) | 52 341 (7.9%) | 22 499 (7.9%) |
| Body mass index | 30.1±11.8 | 30.1±11.1 | 30.1±13.2 |
| Baseline GFR | |||
| Mean GFR | 72.9±22.6 | 72.9±22.6 | 72.9±22.6 |
| GFR level | |||
| Normal GFR ≥60 | 670 408 (70.8%) | 468 966 (70.8%) | 201 442 (70.8%) |
| Mild GFR 45 to 60 | 161 968 (17.1%) | 113 230 (17.1%) | 48 738 (17.1%) |
| Moderate GFR 30 to 45 | 86 811 (9.2%) | 60 875 (9.2%) | 25 936 (9.1%) |
| Severe GFR <30 | 27 664 (2.9%) | 19 318 (2.9%) | 8346 (2.9%) |
| History | |||
| Anemia | 34 994 (3.7%) | 24 500 (3.7%) | 10 494 (3.7%) |
| Current/recent smoker (within 1 year) | 264 100 (27.9%) | 184 900 (27.9%) | 79 200 (27.9%) |
| Hypertension | 774 402 (81.8%) | 541 819 (81.8%) | 232 583 (81.7%) |
| Dyslipidemia | 756 834 (80.0%) | 529 302 (80.0%) | 227 532 (80.1%) |
| Family history of premature CAD | 231 480 (24.5%) | 162 086 (24.5%) | 69 394 (24.4%) |
| Prior MI | 282 294 (29.8%) | 197 560 (29.8%) | 84 734 (29.8%) |
| Prior heart failure | 109 973 (11.6%) | 77 072 (11.6%) | 32 901 (11.6%) |
| Prior valve surgery/procedure | 13 880 (1.5%) | 9582 (1.4%) | 4298 (1.5%) |
| Prior PCI | 376 113 (39.7%) | 262 832 (39.7%) | 113 281 (39.8%) |
| Prior CABG | 176 030 (18.6%) | 123 078 (18.6%) | 52 952 (18.6%) |
| Cerebrovascular disease | 115 909 (12.2%) | 81 093 (12.2%) | 34 816 (12.2%) |
| Peripheral arterial disease | 116 008 (12.2%) | 81 280 (12.3%) | 34 728 (12.2%) |
| Chronic lung disease | 144 137 (15.2%) | 101 031 (15.2%) | 43 106 (15.2%) |
| Diabetes mellitus | 339 158 (35.8%) | 237 100 (35.8%) | 102 058 (35.9%) |
| Cath lab presentation | |||
| CAD presentation | |||
| No symptom, no angina | 89 318 (9.4%) | 62 495 (9.4%) | 26 823 (9.4%) |
| Symptom unlikely to be ischemic | 27 610 (2.9%) | 19 347 (2.9%) | 8263 (2.9%) |
| Stable angina | 157 610 (16.6%) | 110 524 (16.7%) | 47 086 (16.6%) |
| Unstable angina | 344 792 (36.4%) | 240 946 (36.4%) | 103 846 (36.5%) |
| Non‐STEMI | 178 569 (18.9%) | 124 983 (18.9%) | 53 586 (18.8%) |
| ST‐Elevation MI (STEMI) or equivalent | 148 797 (15.7%) | 103 991 (15.7%) | 44 806 (15.8%) |
| Anginal classification within 2 weeks | |||
| No symptoms | 130 327 (13.8%) | 91 224 (13.8%) | 39 103 (13.8%) |
| CCS I | 58 543 (6.2%) | 40 881 (6.2%) | 17 662 (6.2%) |
| CCS II | 189 328 (20.1%) | 132 556 (20.1%) | 56 772 (20.0%) |
| CCS III | 300 612 (31.9%) | 210 536 (31.9%) | 90 076 (31.8%) |
| CCS IV | 264 940 (28.1%) | 184 999 (28.0%) | 79 941 (28.2%) |
| IABP before procedure | 2329 (0.2%) | 1651 (0.2%) | 678 (0.2%) |
| Anti‐anginal medication within 2 weeks | 649 300 (68.6%) | 454 279 (68.6%) | 195 021 (68.6%) |
| Heart failure within 2 weeks | 95 633 (10.1%) | 67 262 (10.2%) | 28 371 (10.0%) |
| Left ventricular systolic dysfunction | 94 346 (10.0%) | 66 321 (10.0%) | 28 025 (9.9%) |
| Pre‐operative evaluation before non‐cardiac surgery | 17 035 (1.8%) | 11 901 (1.8%) | 5134 (1.8%) |
| Cardiogenic shock within 24 hours | 17 125 (1.8%) | 12 002 (1.8%) | 5123 (1.8%) |
| Cardiac arrest within 24 hours | 16 983 (1.8%) | 11 813 (1.8%) | 5170 (1.8%) |
| Multiple procedures | 62 299 (6.6%) | 43 645 (6.6%) | 18 654 (6.6%) |
| Pre‐PCI left ventricular ejection fraction | 52.3±12.5 | 52.3±12.5 | 52.3±12.5 |
| Contrast use and IABP during procedure | |||
| Average contrast volume | 198.9±91.2 | 198.9±91.2 | 198.9±91.0 |
| Average contrast/GFR ratio | 3.1±2.5 | 3.1±2.5 | 3.1±2.5 |
| Level of contrast/GFR ratio | |||
| Contrast/GFR <2× | 287 084 (30.4%) | 201 001 (30.4%) | 86 083 (30.4%) |
| Contrast/GFR 2× to 3× | 284 245 (30.1%) | 198 900 (30.1%) | 85 345 (30.1%) |
| Contrast/GFR >3× | 372 453 (39.5%) | 260 353 (39.4%) | 112 100 (39.5%) |
| Contrast volumes | |||
| Contrast volume 0 to 50 mL | 16 307 (1.7%) | 11 504 (1.7%) | 4803 (1.7%) |
| Contrast volume 51 to 100 | 96 475 (10.2%) | 67 494 (10.2%) | 28 981 (10.2%) |
| Contrast volume 101 to 150 | 212 242 (22.5%) | 148 464 (22.5%) | 63 778 (22.5%) |
| Contrast volume 151 to 200 | 244 911 (25.9%) | 171 311 (25.9%) | 73 600 (26.0%) |
| Contrast volume 201 to 250 | 170 088 (18.0%) | 118 954 (18.0%) | 51 134 (18.0%) |
| Contrast volume 251 to 300 | 100 654 (10.7%) | 70 397 (10.7%) | 30 257 (10.7%) |
| Contrast volume 301 to 350 | 49 377 (5.2%) | 34 520 (5.2%) | 14 857 (5.2%) |
| Contrast volume 351 to 400 | 27 028 (2.9%) | 18 891 (2.9%) | 8137 (2.9%) |
| Contrast volume >400 | 26 859 (2.8%) | 18 832 (2.9%) | 8027 (2.8%) |
| Fluoroscopy time | 14.7±11.6 | 14.7±11.7 | 14.6±11.6 |
| IABP | 23 718 (2.5%) | 16 508 (2.5%) | 7210 (2.5%) |
| In‐ hospital outcomes | |||
| Discharge status | |||
| Alive | 936 750 (98.9%) | 655 352 (98.9%) | 281 398 (98.9%) |
| Deceased | 10 258 (1.1%) | 7149 (1.1%) | 3109 (1.1%) |
| CVA/stroke | 2325 (0.2%) | 1639 (0.2%) | 686 (0.2%) |
| Other vascular complications requiring treatment | 4535 (0.5%) | 3182 (0.5%) | 1353 (0.5%) |
| Length of stay | 2.3±4.4 | 2.3±4.5 | 2.3±4.4 |
| RBC/whole blood transfusion | 27 788 (2.9%) | 19 482 (2.9%) | 8306 (2.9%) |
| AKI rates | |||
| Pre‐procedure creatinine | 1.1±0.5 | 1.1±0.5 | 1.1±0.5 |
| Post‐procedure creatinine | 1.1±0.6 | 1.1±0.6 | 1.1±0.6 |
| AKI stage | |||
| No AKI | 877 559 (92.67%) | 613 911 (92.67%) | 263 648 (92.67%) |
| Stage I | 59 659 (6.3%) | 41 768 (6.3%) | 17 891 (6.3%) |
| Stage II | 4507 (0.5%) | 3143 (0.5%) | 1364 (0.5%) |
| Stage III | 2412 (0.3%) | 1703 (0.3%) | 709 (0.2%) |
| New dialysis | 2875 (0.3%) | 1979 (0.3%) | 896 (0.3%) |
AKI indicates acute kidney injury; CABG, coronary artery bypass grafting; CAD, coronary artery disease; CCS, Canadian Cardiovascular Society classification; MI, myocardial infarction; PCI, percutaneous coronary intervention; STEMI, ST elevation myocardial infarction.
Overall, 1.1% of patients died in the hospital with 7.1% developing AKI and 0.3% developing AKI‐D. In‐hospital AKI was similar in the development (7.3%, n=48 818) and validation cohorts (7.3%, n=20 849). The baseline characteristics of those who did and did not develop AKI are shown in Table 2.
Table 2.
Characteristics of Those With and Without AKI in the Derivation Cohort
| Total (n=662 504) | AKI Category | P Value | ||
|---|---|---|---|---|
| Developed AKI (n=48 593) | No AKI (n=613 911) | |||
| Demographics | ||||
| Age, y | 64.8±12.2 | 68.2±12.4 | 64.6±12.1 | <0.001 |
| Sex | ||||
| Male | 445 016 (67.2%) | 29 724 (61.2%) | 415 292 (67.6%) | <0.001 |
| Female | 217 488 (32.8%) | 18 869 (38.8%) | 198 619 (32.4%) | |
| Race | ||||
| White | 586 634 (88.5%) | 41 574 (85.6%) | 545 060 (88.8%) | <0.001 |
| Black or African American | 52 341 (7.9%) | 5212 (10.7%) | 47 129 (7.7%) | <0.001 |
| Body mass index | 30.1±11.1 | 30.5±16.9 | 30.0±10.6 | <0.001 |
| Baseline GFR | ||||
| Mean GFR | 72.9±22.6 | 64.2±28.3 | 73.6±21.9 | <0.001 |
| GFR level | ||||
| Normal GFR ≥60 | 468 966 (70.8%) | 25 439 (52.5%) | 443 527 (72.2%) | <0.001 |
| Mild GFR 45 to 60 | 113 230 (17.1%) | 9669 (19.9%) | 103 561 (16.9%) | |
| Moderate GFR 30 to 45 | 60 875 (9.2%) | 8222 (17.0%) | 52 653 (8.6%) | |
| Severe GFR <30 | 19 318 (2.9%) | 5148 (10.6%) | 14170 (2.3%) | |
| History | ||||
| Anemia | 24 500 (3.7%) | 5123 (10.5%) | 19 377 (3.2%) | <0.001 |
| Current/recent smoker (within 1 year) | 184 900 (27.9%) | 11 396 (23.5%) | 173 504 (28.3%) | <0.001 |
| Hypertension | 541 819 (81.8%) | 42 130 (86.7%) | 499 689 (81.4%) | <0.001 |
| Dyslipidemia | 529 302 (80.0%) | 37 815 (77.9%) | 491 487 (80.1%) | <0.001 |
| Family history of premature CAD | 162 086 (24.5%) | 9743 (20.1%) | 152 343 (24.8%) | <0.001 |
| Prior MI | 197 560 (29.8%) | 15 799 (32.5%) | 181 761 (29.6%) | <0.001 |
| Prior heart failure | 77 072 (11.6%) | 11 056 (22.8%) | 66 016 (10.8%) | <0.001 |
| Prior valve surgery/procedure | 9582 (1.4%) | 979 (2.0%) | 8603 (1.4%) | <0.001 |
| Prior PCI | 262 832 (39.7%) | 17 738 (36.5%) | 245 094 (39.9%) | <0.001 |
| Prior CABG | 123 078 (18.6%) | 10 356 (21.3%) | 112 722 (18.4%) | <0.001 |
| Cerebrovascular disease | 81 093 (12.2%) | 8984 (18.5%) | 72 109 (11.7%) | <0.001 |
| Peripheral arterial disease | 81 280 (12.3%) | 8906 (18.3%) | 72 374 (11.8%) | <0.001 |
| Chronic lung disease | 101 031 (15.2%) | 9902 (20.4%) | 91 129 (14.8%) | <0.001 |
| Diabetes mellitus | 237 100 (35.8%) | 23 875 (49.1%) | 213 225 (34.7%) | <0.001 |
| Cath lab presentation | ||||
| CAD presentation | ||||
| No symptom, no angina | 62 495 (9.4%) | 3700 (7.6%) | 58 795 (9.6%) | <0.001 |
| Symptom unlikely to be ischemic | 19 347 (2.9%) | 1283 (2.6%) | 18 064 (2.9%) | |
| Stable angina | 110 524 (16.7%) | 4563 (9.4%) | 105 961 (17.3%) | |
| Unstable angina | 240 946 (36.4%) | 14 156 (29.1%) | 226 790 (37.0%) | |
| Non‐STEMI | 124 983 (18.9%) | 13 162 (27.1%) | 111 821 (18.2%) | |
| ST‐Elevation MI (STEMI) or equivalent | 103 991 (15.7%) | 11 718 (24.1%) | 92 273 (15.0%) | |
| Anginal classification within 2 weeks | ||||
| No symptoms | 91 224 (13.8%) | 6791 (14.0%) | 84 433 (13.8%) | <0.001 |
| CCS I | 40 881 (6.2%) | 2098 (4.3%) | 38 783 (6.3%) | |
| CCS II | 132 556 (20.1%) | 6770 (14.0%) | 125 786 (20.6%) | |
| CCS III | 210 536 (31.9%) | 14 280 (29.5%) | 196 256 (32.1%) | |
| CCS IV | 184 999 (28.0%) | 18 478 (38.2%) | 166 521 (27.2%) | |
| IABP before procedure | 1651 (0.2%) | 560 (1.2%) | 1091 (0.2%) | <0.001 |
| Anti‐anginal medication within 2 weeks | 454 279 (68.6%) | 34 448 (70.9%) | 419 831 (68.4%) | <0.001 |
| Heart failure within 2 weeks | 67 262 (10.2%) | 12 157 (25.0%) | 55 105 (9.0%) | <0.001 |
| Left ventricular systolic dysfunction | 66 321 (10.0%) | 8680 (17.9%) | 57 641 (9.4%) | <0.001 |
| Pre‐operative evaluation before non‐cardiac surgery | 11 901 (1.8%) | 806 (1.7%) | 11 095 (1.8%) | 0.018 |
| Cardiogenic shock within 24 hours | 12 002 (1.8%) | 4028 (8.3%) | 7974 (1.3%) | <0.001 |
| Cardiac arrest within 24 hours | 11 813 (1.8%) | 2766 (5.7%) | 9047 (1.5%) | <0.001 |
| Multiple procedures in hospital | 43 645 (6.6%) | 4529 (9.3%) | 39 116 (6.4%) | <0.001 |
| Pre‐PCI left ventricular ejection fraction | 52.3±12.5 | 46.8±15.0 | 52.7±12.3 | <0.001 |
| Contrast use and IABP during procedure | ||||
| Contrast volume | 198.9±91.2 | 206.9±101.2 | 198.3±90.4 | <0.001 |
| Average contrast/GFR ratio | 3.1±2.5 | 4.1±3.9 | 3.0±2.3 | <0.001 |
| Ratio level | ||||
| Contrast/GFR <2× | 201 001 (30.4%) | 11 119 (23.0%) | 189 882 (31.0%) | <0.001 |
| Contrast/GFR 2× to 3× | 198 900 (30.1%) | 11 407 (23.6%) | 187 493 (30.6%) | |
| Contrast/GFR >3× | 260 353 (39.4%) | 25 778 (53.4%) | 234 575 (38.3%) | |
| Contrast level | ||||
| Contrast volume 0 to 50 | 11 504 (1.7%) | 945 (2.0%) | 10 559 (1.7%) | <0.001 |
| Contrast volume 51 to 100 | 67 494 (10.2%) | 5002 (10.3%) | 62 492 (10.2%) | |
| Contrast volume 101 to 150 | 148 464 (22.5%) | 10 171 (21.0%) | 138 293 (22.6%) | |
| Contrast volume 151 to 200 | 171 311 (25.9%) | 11 724 (24.2%) | 159 587 (26.1%) | |
| Contrast volume 201 to 250 | 118 954 (18.0%) | 8530 (17.6%) | 110 424 (18.0%) | |
| Contrast volume 251 to 300 | 70 397 (10.7%) | 5450 (11.3%) | 64 947 (10.6%) | |
| Contrast volume 301 to 350 | 34 520 (5.2%) | 2832 (5.8%) | 31 688 (5.2%) | |
| Contrast volume 351 to 400 | 18 891 (2.9%) | 1709 (3.5%) | 17 182 (2.8%) | |
| Contrast volume >400 | 18 832 (2.9%) | 2054 (4.2%) | 16 778 (2.7%) | |
| Fluoroscopy time | 14.7±11.7 | 17.0±13.6 | 14.5±11.5 | <0.001 |
| IABP | 16 508 (2.5%) | 5338 (11.0%) | 11 170 (1.8%) | <0.001 |
| In‐hospital outcomes | ||||
| Discharge status | ||||
| Alive | 655 352 (98.9%) | 44 245 (91.1%) | 611 107 (99.5%) | <0.001 |
| Deceased | 7149 (1.1%) | 4348 (8.9%) | 2801 (0.5%) | |
| CVA/stroke | 1639 (0.2%) | 524 (1.1%) | 1115 (0.2%) | <0.001 |
| Other vascular complications requiring treatment | 3182 (0.5%) | 738 (1.5%) | 2444 (0.4%) | <0.001 |
| LOS | 2.3±4.5 | 5.6±7.8 | 2.0±4.0 | <0.001 |
| RBC/whole blood transfusion | 19482 (2.9%) | 7384 (15.2%) | 12 098 (2.0%) | <0.001 |
| AKI | ||||
| Pre‐procedure creatinine | 1.1±0.5 | 1.3±0.8 | 1.1±0.5 | <0.001 |
| Post‐procedure creatinine | 1.1±0.6 | 2.1±1.4 | 1.0±0.4 | <0.001 |
| New requirement for dialysis | 1979 (0.3%) | 1979 (4.1%) | 0 (0.0%) | <0.001 |
| Akistage | ||||
| No AKI | 613 911 (92.7%) | 0 (0.0%) | 613 911 (100.0%) | <0.001 |
| Stage I | 41 768 (6.3%) | 41 768 (86.0%) | 0 (0.0%) | |
| Stage II | 3143 (0.5%) | 3143 (6.5%) | 0 (0.0%) | |
| Stage III | 1703 (0.3%) | 1703 (3.5%) | 0 (0.0%) | |
| New dialysis | 1979 (0.3%) | 1979 (4.1%) | 0 (0.0%) | |
Continuous variables compared using Student t test. Categorical variables compared using chi‐square or Fisher's exact test. AKI indicates acute kidney injury; CAD, coronary artery disease; CABG, coronary artery bypass grafting; CCS, Canadian Cardiovascular Society Classification; LOS, length of stay; MI, myocardial infarction; PCI, percutaneous coronary intervention; STEMI, ST elevation myocardial infarction.
Initially, 24 independent predictors for AKI and AKI‐D were identified the multivariable modeling in the derivation cohort, resulting in a model c‐statistics of 0.72 and 0.89, respectively. After removing 10 and 16 variables from the models, the final models included 11 multivariate predictors for AKI (c‐stat 0.71; Figure 2) and 6 for AKI‐D (c‐stat 0.88; Figure 3). The IDI comparing the full to reduced AKI model was 0.0024 (95% CI=0.0022, 0.0028), and for dialysis it was 0.0039 (95% CI=0.0023, 0.0052), indicating little impact on using the reduced model. The 3 variables with the largest predictive ability (defined by total t‐statistic) were STEMI presentation, cardiogenic shock, and baseline CKD. Calibration was confirmed with observed versus predicted plots (Figure 4) and the slopes for the AKI and AKI‐D predicted versus observed outcomes were 1.001 and 0.99, respectively. The discrimination and calibration in different clinical subsets is shown in Table 3.
Figure 2.
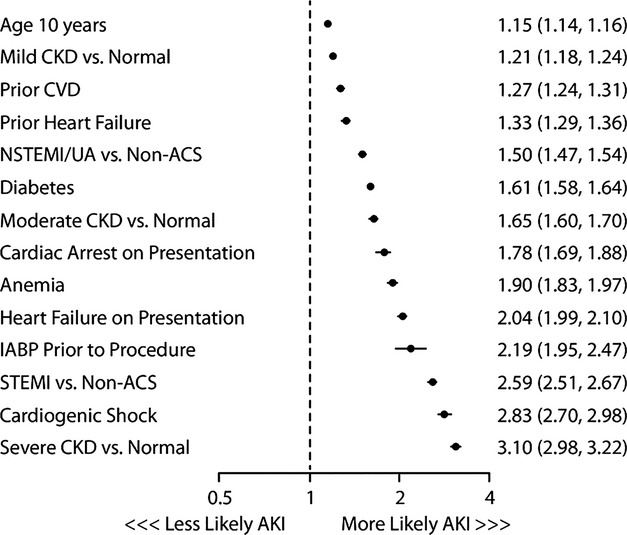
Predictors of acute kidney injury and their associated odds ratios and 95% confidence intervals. ACS indicates acute coronary syndrome; AKI, acute kidney injury; CKD, chronic kidney disease; CVD, cerebrovascular disease; NSTEMI, non‐ST elevation myocardial infarction.
Figure 3.
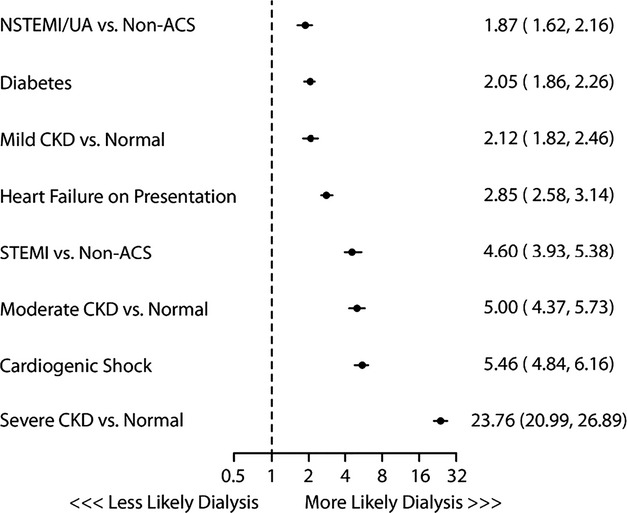
Predictors of acute kidney injury requiring dialysis and their associated odds ratios and 95% confidence intervals. ACS indicates acute coronary syndrome; CKD, chronic kidney disease; STEMI, ST elevation myocardial infarction.
Figure 4.
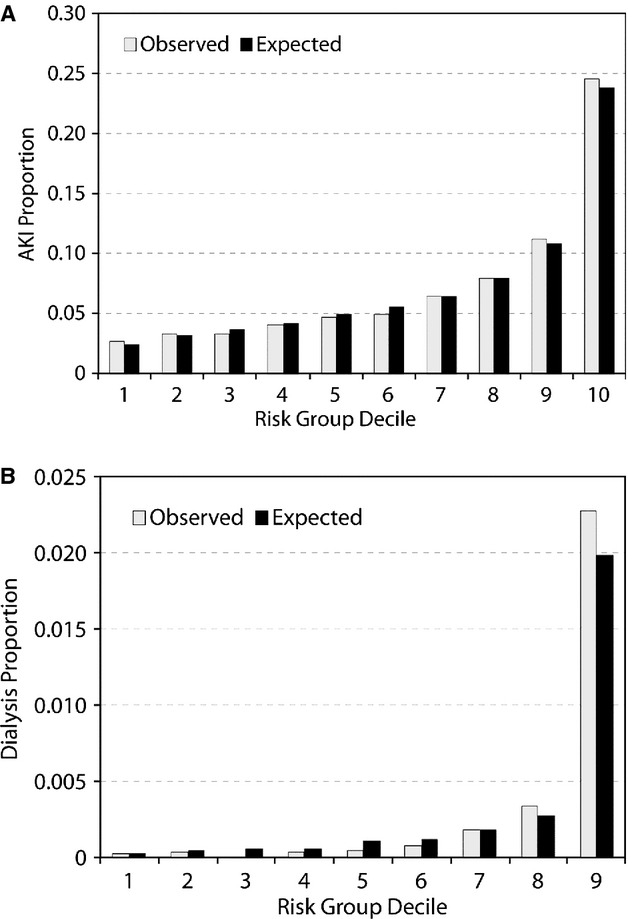
Comparison of predicted vs observed outcome rate for the validation cohort (A)AKI; (B)AKI+dialysis. AKI indicates acute kidney injury.
Table 3.
Discrimination and Calibration of the AKI Risk Model Across Different Clinical Populations
| Clinical Subgroup | Number of Patients in Validation Set | Number of Patients in Derivation Set | c‐Statistic in Validation Cohort | c‐Statistic in Derivation Cohort | Calibration Slope |
|---|---|---|---|---|---|
| All patients | 284 508 | 662 504 | 0.713 (0.709, 0.717) | 0.714 (0.711, 0.717) | 1.001 |
| STEMI | 44 806 | 103 991 | 0.740 (0.732, 0.748) | 0.740 (0.735, 0.745) | 1.069 |
| NSTEMI/unstable angina | 157 432 | 365 929 | 0.700 (0.694, 0.705) | 0.699 (0.695, 0.702) | 0.991 |
| Non‐acute coronary syndrome | 82 270 | 192 584 | 0.665 (0.656, 0.674) | 0.668 (0.662, 0.674) | 0.992 |
| Severe/moderate reduction in glomerular filtration rate | 34 282 | 80 193 | 0.708 (0.701, 0.716) | 0.716 (0.711, 0.720) | 0.908 |
AKI indicates acute kidney injury; NSTEMI, non‐ST elevation myocardial infarction.
To create simplified scores for bedside calculation, each variable in each reduced model was then assigned a weighted‐integer coefficient value. The scoring system for AKI and AKI‐D is provided in Table 4. The IDI for comparing the integer and the full AKI risk model was 0.0067 (95% CI=0.006, 0.007), suggesting a small loss in predictive accuracy. The IDI for the integer model AKI‐D, as compared with the full model predicting AKI‐D, was 0.005 (95% CI=0.001, 0.01). Figures 5 and 6 illustrate the application of the integer risk score to estimate a prototypical patient's risk of AKI and AKI‐D.
Table 4.
A Simplified Integer Risk Score for Calculating the Risk of AKI and AKI‐D
| Points | Converting Points to Risk | |||||
|---|---|---|---|---|---|---|
| AKI | AKI‐D | AKI | Risk (%) | AKI‐D | Risk (%) | |
| Age, y | ||||||
| <50 | 0 | 0 | 1.9 | 0 | 0.03 | |
| 50 to 59 | 2 | 5 | 2.6 | 1 | 0.05 | |
| 60 to 69 | 4 | 10 | 3.6 | 2 | 0.09 | |
| 70 to 79 | 6 | 15 | 4.9 | 3 | 0.15 | |
| 80 to 89 | 8 | 20 | 6.7 | 4 | 0.27 | |
| >90 | 10 | 25 | 9.2 | 5 | 0.48 | |
| 30 | 12.4 | 6 | 0.84 | |||
| Prior 2 weeks HF | 11 | 2 | 35 | 16.5 | 7 | 1.5 |
| Severe GFR | 18 | 5 | 40 | 217 | 8 | 2.6 |
| Moderate GFR | 8 | 3 | 45 | 27.9 | 9 | 4.4 |
| Mild GFR | 3 | 1 | 50 | 35.1 | 10 | 7.6 |
| Diabetes | 7 | 1 | 55 | 43.0 | 11 | 12.6 |
| Prior HF | 4 | >60 | 51.4 | 12 | 20.3 | |
| Prior CVD | 4 | 13 | 31.0 | |||
| NSTEMI/UA | 6 | 1 | ||||
| STEMI | 15 | 2 | ||||
| Prior card shock | 16 | |||||
| Prior card arrest | 8 | 3 | ||||
| Anemia | 10 | |||||
| IABP | 11 | |||||
AKI indicates acute kidney injury; HF, heart failure; NSTEMI, non‐ST elevation myocardial infarction.
Figure 5.
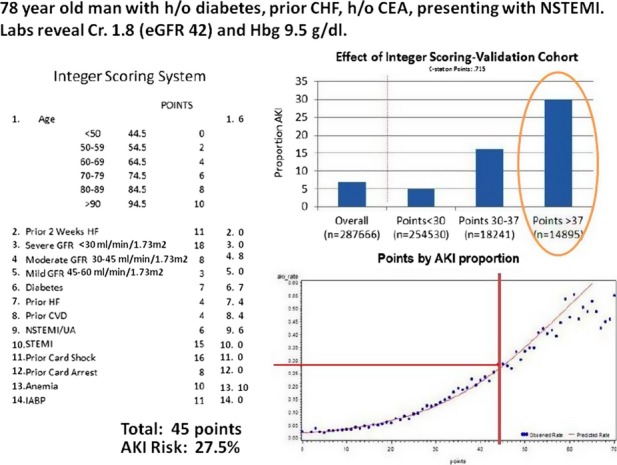
NCDR Prediction score card for acute kidney injury following PCI in a sample patient. AKI indicates acute kidney injury; CEA, carotid endarterectomy; CHF, chronic heart failure; eGFR, estimated glomerular filtration rate; HF, heart failure; IABP, intra‐aortic balloon pump; NCDR, National Cardiovascular Data Registry; NSTEMI, non‐ST elevation myocardial infarction; PCI, percutaneous coronary intervention.
Figure 6.
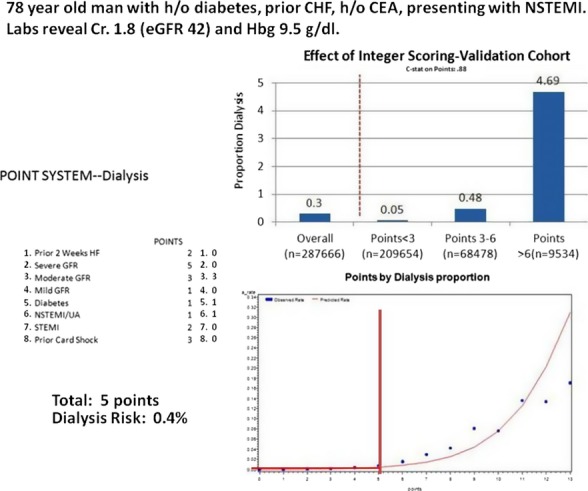
NCDR prediction score for acute kidney injury requiring dialysis following PCI. HF indicates heart failure; NCDR, National Cardiovascular Data Registry; NSTEMI, non‐ST elevation myocardial infarction.
Comment
AKI is the most common non‐cardiac complication of PCI, occurring in 1 of every 13 to 14 patients treated. By using the largest available registry of PCI patients, we developed and validated a suite of risk models to predict AKI and AKI‐D in patients undergoing PCI. While the full model is most accurate and appropriate for benchmarking across hospitals, the reduced AKI model included only 11 pre‐procedural variables and the AKI‐D model only 6, rendering them feasible for prospective risk estimation in routine clinical care. We also created a simple integer scoring system for both models to further simplify bedside application, although there was a modest loss in discrimination. These models have the opportunity to both support quality assessment by fairly comparing the AKI rates of hospitals after adjusting for the characteristics of the patients that they treat, but also for supporting personalized medicine and quality improvement by using patient‐level risk prediction to guide PCI treatment strategies, such as limiting contrast exposure, more aggressive hydration protocols, avoiding multivessel PCI in a single setting, or avoiding left ventriculograms in high‐risk patients.
AKI is a serious complication of PCI and is associated with an increased risk of myocardial infarction, dialysis, length of stay,28–29 healthcare costs, and death.28,30–33 Previous risk models of AKI post‐PCI, while important contributions at the time, have had limited use in clinical practice. Much of the work was based upon multiple and competing clinical definitions of AKI that varied from an increase in creatinine of 25% to 2 mg/dL, which have led to wide variations in reported AKI rates from 0.7% to 19%.2,32,34 Also, these studies predated the contemporary use of hydration protocols and iso‐osmolar contrast agents, as recommended by societal guidelines and may not reflect contemporary rates of AKI.35 Therefore, our risk model from over 1000 hospitals and nearly 1 million patients uses the recently endorsed definition of AKI from the Acute Kidney Injury Network (AKIN), which has been embraced by the broader medical community as a standard definition.23,36 For example, the Valve Academic Research Consortium (VARC), charged with proposing standardized consensus definitions for important clinical endpoints in future trials and registries of transcatheter aortic valve implantation (TAVI), also chose the AKIN criteria to define AKI. Using the same definition of AKI as chosen for TAVI will allow comparison of AKI rates across different percutaneous procedures.32 Moreover, we have already demonstrated that even Stage 1 AKI, as defined by the AKIN criteria, is associated with increased mortality and bleeding, underscoring the value and importance of using the AKIN criteria.37
Other AKI prediction models have also suffered by the inclusion of intra‐procedural variables, such as contrast dose, which relate more to the skill and quality of decision making by the physician, rather than the inherent risk of the patient.1,10 These models predict patient risk following the procedure and cannot be used for tailoring preventative protocols to patients as a function of their risk, nor can they be used to provide patient‐specific estimates of risk for AKI or dialysis during the informed consent process. Also, few models incorporate the entire spectrum of patients undergoing PCI. Physicians wishing to apply these historical models in routine practice need to be aware that there may be different risk scores for different types of patient undergoing PCI. In the NCDR CathPCI model, we were able to demonstrate that diagnostic prediction for in‐hospital AKI or AKI‐D, regardless of whether the patient presents with STEMI, NSTEMI, or UA, enabling simpler implementation of a single model to accurately, prospectively estimate the risk of AKI for all patients presenting to the cardiac catheterization laboratory. The prospective use of other peri‐procedural risk models, such as the NCDR bleeding model, have been associated with improved safety and outcomes.19 Whether the use of the current model can improve AKI rates needs to be prospectively tested.
Given the challenge by the Institute of Medicine to provide safer, more patient‐centered care, informing patients and clinicians of patients' personalized risks for PCI is an important step to achieving better healthcare.11 Most recently, NCDR models to predict the patient's risk of mortality, bleeding, and target vessel revascularization were used to produce a customized informed‐consent form to better inform patients of treatment options and risks.14 This was compared with usual care and recently assessed in a 9‐center survey of patient experiences. Patients who received the personalized informed consent, based on their own unique pre‐procedural characteristics, showed a significantly greater level of “knowledge transfer” and better understanding of procedural risks. Given that kidney injury and dialysis are common complications of PCI and the variability of risk from patient to patient, vague estimations of risk based on population‐wide data or experience or intuition can be a disservice. Adding patient‐specific estimates of AKI and dialysis risk, derived from the validated preprocedural multivariable models into individualized PCI consent documents can be a significant advance in the consent process for those who are about to undergo PCI.
Certain potential limitations should be considered when interpreting the findings of this study. First, patients and hospitals participating in NCDR may not be representative of all US practices. However, the CathPCI registry represents >1000 hospitals across the United States and captures the majority of PCIs nationally. Second, we used the in‐hospital pre‐procedure creatinine as the baseline value, which may not have represented the patient's true baseline serum creatinine, and did not have access to urine output, which is also a component of the AKIN definitions of AKI. This latter omission may have failed to recognize AKI in those with reduced urine output but no increase in creatinine. Such a bias may also have been introduced in patients whose creatinine rose after discharge but was not increased by >0.3 mg/dL prior to discharge. Nevertheless, the pre‐procedural and post‐discharge creatinines are what is most commonly available in clinical care and markedly improve feasibility of this model in routine quality assessment. Third, we did not have data on intravenous administration of fluid, concomitant use of renal toxic medications or potentially renal protective medications, all of which may have improved model performance. Importantly, we did not include procedural characteristics, such as the use of left ventriculograms or contrast volume to predict AKI outcomes. While these would have certainly improved the c‐statistics of the models, they are under the locus of control of the physician and are actionable opportunities to improve care.
Conclusions
We developed a valid and robust tool for predicting AKI and AKI‐D in patients undergoing PCI. Use of these models for national quality improvement efforts, personalizing the education of patients about the risks of treatment and to adjust the technical approach to PCI may all lead to safer, higher‐quality care and should be tested in prospective studies.
Sources of Funding
Financial support was provided by the American College of Cardiology and Society for Coronary Angiography and Intervention. The funders had no role in the design and conduct of the study nor collection, management, analysis, and interpretation of the data. The Research and Publications committee for the NCDR CathPCI registry reviewed and approved the final version of the manuscript. Dr Ho and Dr Matheny are supported by VA HSR&D Career Development Awards and 08‐020, respectively.
Disclosures
Dr Spertus discloses that he is the PI of a contract from the ACCF to analyze the NCDR data. He also has an equity interest in Health Outcomes Sciences. No other authors have any conflicts to disclose.
References
- 1.Bartholomew BA, Harjai KJ, Dukkipati S, Boura JA, Yerkey MW, Glazier S, Grines CL, O'Neill WW. Impact of nephropathy after percutaneous coronary intervention and a method for risk stratification. Am J Cardiol. 2004; 93:1515-1519. [DOI] [PubMed] [Google Scholar]
- 2.Brown JR, DeVries JT, Piper WD, Robb JF, Hearne MJ, Ver LP, Kellet MA, Watkins MW, Ryan TJ, Silver MT, Ross CS, MacKenzie TA, O'Connor GT, Malenka DJ. Serious renal dysfunction after percutaneous coronary interventions can be predicted. Am Heart J. 2008; 155:260-266. [DOI] [PubMed] [Google Scholar]
- 3.Conen D, Buerkle G, Perruchoud AP, Buettner HJ, Mueller C. Hypertension is an independent risk factor for contrast nephropathy after percutaneous coronary intervention. Int J Cardiol. 2006; 110:237-241. [DOI] [PubMed] [Google Scholar]
- 4.Dangas G, Iakovou I, Nikolsky E, Aymong ED, Mintz GS, Kipshidze NN, Lansky AJ, Moussa I, Stone GW, Moses JW, Leon MB, Mehran R. Contrast‐induced nephropathy after percutaneous coronary interventions in relation to chronic kidney disease and hemodynamic variables. Am J Cardiol. 2005; 95:13-19. [DOI] [PubMed] [Google Scholar]
- 5.Freeman RV, O'Donnell M, Share D, Meengs WL, Kline‐Rogers E, Clark VL, DeFranco AC, Eagle KA, McGinnity JG, Patel K, Maxwell‐Eward A, Bondie D, Moscucci M. Nephropathy requiring dialysis after percutaneous coronary intervention and the critical role of an adjusted contrast dose. Am J Cardiol. 2002; 90:1068-1073. [DOI] [PubMed] [Google Scholar]
- 6.Brown JR, Robb JF, Block CA, Schoolwerth AC, Kaplan AV, O'Connor GT, Solomon RJ, Malenka DJ. Does safe dosing of iodinated contrast prevent contrast‐induced acute kidney injury? Circ Cardiovasc Interv. 2010; 3:346-350. [DOI] [PMC free article] [PubMed] [Google Scholar]
- 7.Klima T, Christ A, Marana I, Kalbermatter S, Uthoff H, Burri E, Hartwiger S, Schindler C, Breidthardt T, Marenzi G, Mueller C. Sodium chloride vs. sodium bicarbonate for the prevention of contrast medium‐induced nephropathy: a randomized controlled trial. Eur Heart J. 2012; 33:2071-2079. [DOI] [PubMed] [Google Scholar]
- 8.Marenzi G, Assanelli E, Campodonico J, Lauri G, Marana I, De Metrio M, Moltrasio M, Grazi M, Rubino M, Veglia F, Fabbiocchi F, Bartorelli AL. Contrast volume during primary percutaneous coronary intervention and subsequent contrast‐induced nephropathy and mortality. Ann Intern Med. 2009; 150:170-177. [DOI] [PubMed] [Google Scholar]
- 9.Mueller C, Buerkle G, Buettner HJ, Petersen J, Perruchoud AP, Eriksson U, Marsch S, Roskamm H. Prevention of contrast media‐associated nephropathy: randomized comparison of 2 hydration regimens in 1620 patients undergoing coronary angioplasty. Arch Intern Med. 2002; 162:329-336. [DOI] [PubMed] [Google Scholar]
- 10.Mehran R, Aymong ED, Nikolsky E, Lasic Z, Iakovou I, Fahy M, Mintz GS, Lansky AJ, Moses JW, Stone GW, Leon MB, Dangas G. A simple risk score for prediction of contrast‐induced nephropathy after percutaneous coronary intervention: development and initial validation. J Am Coll Cardiol. 2004; 44:1393-1399. [DOI] [PubMed] [Google Scholar]
- 11.Institute of Medicine. Crossing the Quality Chasm: A New Health System for the Twenty‐first Century. 2001Washington: National Academy Press [Google Scholar]
- 12.Lloyd‐Jones DM. Cardiovascular risk prediction: basic concepts, current status, and future directions. Circulation. 2010; 121:1768-1777. [DOI] [PubMed] [Google Scholar]
- 13.Marso SP, Amin AP, House JA, Kennedy KF, Spertus JA, Rao SV, Cohen DJ, Messenger JC, Rumsfeld JSNational Cardiovascular Data R. Association between use of bleeding avoidance strategies and risk of periprocedural bleeding among patients undergoing percutaneous coronary intervention. JAMA. 2010; 303:2156-2164. [DOI] [PubMed] [Google Scholar]
- 14.Arnold SV, Decker C, Ahmad H, Olabiyi O, Mundluru S, Reid KJ, Soto GE, Gansert S, Spertus JA. Converting the informed consent from a perfunctory process to an evidence‐based foundation for patient decision making. Circ Cardiovasc Qual Outcomes. 2008; 1:21-28. [DOI] [PubMed] [Google Scholar]
- 15.Moussa I, Hermann A, Messenger JC, Dehmer GJ, Weaver WD, Rumsfeld JS, Masoudi FA. The NCDR cathpci registry: a US national perspective on care and outcomes for percutaneous coronary intervention. Heart. 2013; 99:297-303. [DOI] [PubMed] [Google Scholar]
- 16.Amin AP, Spertus JA, Cohen DJ, Chhatriwalla A, Kennedy KF, Vilain K, Salisbury AC, Venkitachalam L, Lai SM, Mauri L, Normand SL, Rumsfeld JS, Messenger JC, Yeh RW. Use of drug‐eluting stents as a function of predicted benefit: clinical and economic implications of current practice. Arch Intern Med. 2012; 172:1145-1152. [DOI] [PubMed] [Google Scholar]
- 17.Peterson ED, Dai D, DeLong ER, Brennan JM, Singh M, Rao SV, Shaw RE, Roe MT, Ho KK, Klein LW, Krone RJ, Weintraub WS, Brindis RG, Rumsfeld JS, Spertus JA. Contemporary mortality risk prediction for percutaneous coronary intervention: results from 588,398 procedures in the National Cardiovascular Data Registry. J Am Coll Cardiol. 2010; 55:1923-1932. [DOI] [PMC free article] [PubMed] [Google Scholar]
- 18.Mehta SK, Frutkin AD, Lindsey JB, House JA, Spertus JA, Rao SV, Ou FS, Roe MT, Peterson ED, Marso SPNational Cardiovascular Data R. Bleeding in patients undergoing percutaneous coronary intervention: the development of a clinical risk algorithm from the national cardiovascular data registry. Circ Cardiovasc Interv. 2009; 2:222-229. [DOI] [PubMed] [Google Scholar]
- 19.Rao SC, Chhatriwalla AK, Kennedy KF, Decker CJ, Gialde E, Spertus JA, Marso SP. Pre‐procedural estimate of individualized bleeding risk impacts physicians' utilization of bivalirudin during percutaneous coronary intervention. J Am Coll Cardiol. 2013; 61:1847-1852. [DOI] [PubMed] [Google Scholar]
- 20.Brindis RG, Fitzgerald S, Anderson HV, Shaw RE, Weintraub WS, Williams JF. The American College of Cardiology‐National Cardiovascular Data Registry (ACC‐NCDR): building a national clinical data repository. J Am Coll Cardiol. 2001; 37:2240-2245. [DOI] [PubMed] [Google Scholar]
- 21.Weintraub WS, McKay CR, Riner RN, Ellis SG, Frommer PL, Carmichael DB, Hammermeister KE, Effros MN, Bost JE, Bodycombe DP. The american college of cardiology national database: progress and challenges. American college of cardiology database committee. J Am Coll Cardiol. 1997; 29:459-465. [DOI] [PubMed] [Google Scholar]
- 22.Messenger JC, Ho KK, Young CH, Slattery LE, Draoui JC, Curtis JP, Dehmer GJ, Grover FL, Mirro MJ, Reynolds MR, Rokos IC, Spertus JA, Wang TY, Winston SA, Rumsfeld JS, Masoudi FA, Science NQuality Oversight Committee Data Quality Workgroup. The National Cardiovascular Data Registry (NCDR) Data Quality Brief: the NCDR Data Quality Program in 2012. J Am Coll Cardiol. 2012; 60:1484-1488. [DOI] [PubMed] [Google Scholar]
- 23.Mehta RL, Kellum JA, Shah SV, Molitoris BA, Ronco C, Warnock DG, Levin A. Acute kidney injury network: report of an initiative to improve outcomes in acute kidney injury. Crit Care. 2007; 11:R31. [DOI] [PMC free article] [PubMed] [Google Scholar]
- 24.Krumholz HM, Brindis RG, Brush JE, Cohen DJ, Epstein AJ, Furie K, Howard G, Peterson ED, Rathore SS, Smith SC, Jr, Spertus JA, Wang Y, Normand SLAmerican Heart Association, Quality of Care and Outcomes Research Interdisciplinary Writing Group, Council on Epidemiology and Prevention, Stroke Council, American College of Cardiology Foundation. Standards for statistical models used for public reporting of health outcomes: an American Heart Association Scientific Statement from the Quality of Care and Outcomes Research Interdisciplinary Writing Group: cosponsored by the Council on Epidemiology and Prevention and the Stroke Council. Endorsed by the American College of Cardiology Foundation. Circulation. 2006; 113:456-462. [DOI] [PubMed] [Google Scholar]
- 25.Fe H. Regression Modeling Strategies With Applications to Linear Models, Logistic Regression, and Survival Analysis. 2001New York: Springer [Google Scholar]
- 26.Pencina MJ, D'Agostino RB, Sr, D'Agostino RB, Jr, Vasan RS. Evaluating the added predictive ability of a new marker: from area under the ROC curve to reclassification and beyond. Stat Med. 2008; 27:157-172. [DOI] [PubMed] [Google Scholar]
- 27.Sullivan LM, Massaro JM, D'Agostino RB., Sr Presentation of multivariate data for clinical use: the framingham study risk score functions. Stat Med. 2004; 23:1631-1660. [DOI] [PubMed] [Google Scholar]
- 28.Chertow GM, Burdick E, Honour M, Bonventre JV, Bates DW. Acute kidney injury, mortality, length of stay, and costs in hospitalized patients. J Am Soc Nephrol. 2005; 16:3365-3370. [DOI] [PubMed] [Google Scholar]
- 29.Oldemeyer JB, Biddle WP, Wurdeman RL, Mooss AN, Cichowski E, Hilleman DE. Acetylcysteine in the prevention of contrast‐induced nephropathy after coronary angiography. Am Heart J. 2003; 146:E23. [DOI] [PubMed] [Google Scholar]
- 30.Forman DE, Butler J, Wang Y, Abraham WT, O'Connor CM, Gottlieb SS, Loh E, Massie BM, Rich MW, Stevenson LW, Young JB, Krumholz HM. Incidence, predictors at admission, and impact of worsening renal function among patients hospitalized with heart failure. J Am Coll Cardiol. 2004; 43:61-67. [DOI] [PubMed] [Google Scholar]
- 31.Gupta R, Gurm HS, Bhatt DL, Chew DP, Ellis SG. Renal failure after percutaneous coronary intervention is associated with high mortality. Catheter Cardiovasc Interv. 2005; 64:442-448. [DOI] [PubMed] [Google Scholar]
- 32.Iakovou I, Dangas G, Mehran R, Lansky AJ, Ashby DT, Fahy M, Mintz GS, Kent KM, Pichard AD, Satler LF, Stone GW, Leon MB. Impact of gender on the incidence and outcome of contrast‐induced nephropathy after percutaneous coronary intervention. J Invasive Cardiol. 2003; 15:18-22. [PubMed] [Google Scholar]
- 33.McCullough PA, Wolyn R, Rocher LL, Levin RN, O'Neill WW. Acute renal failure after coronary intervention: incidence, risk factors, and relationship to mortality. Am J Med. 1997; 103:368-375. [DOI] [PubMed] [Google Scholar]
- 34.Marenzi G, Lauri G, Assanelli E, Campodonico J, De Metrio M, Marana I, Grazi M, Veglia F, Bartorelli AL. Contrast‐induced nephropathy in patients undergoing primary angioplasty for acute myocardial infarction. J Am Coll Cardiol. 2004; 44:1780-1785. [DOI] [PubMed] [Google Scholar]
- 35.King SB, III, Smith SC, Jr, Hirshfeld JW, Jr, Jacobs AK, Morrison DA, Williams DO, Feldman TE, Kern MJ, O'Neill WW, Schaff HV, Whitlow PL, Adams CD, Anderson JL, Buller CE, Creager MA, Ettinger SM, Halperin JL, Hunt SA, Krumholz HM, Kushner FG, Lytle BW, Nishimura R, Page RL, Riegel B, Tarkington LG, Yancy CW. 2007 focused update of the ACC/AHA/SCAI 2005 guideline update for percutaneous coronary intervention: a report of the American College of Cardiology/American Heart Association Task Force on Practice guidelines. J Am Coll Cardiol. 2008; 51:172-209. [DOI] [PubMed] [Google Scholar]
- 36.Bellomo R, Ronco C, Kellum JA, Mehta RL, Palevsky PAcute Dialysis Quality Initiative workgroup. Acute renal failure—definition, outcome measures, animal models, fluid therapy and information technology needs: the Second International Consensus Conference of the Acute Dialysis Quality Initiative (ADQI) Group. Crit Care. 2004; 8:R204-R212. [DOI] [PMC free article] [PubMed] [Google Scholar]
- 37.Tsai TT, Patel UD, Chang TI, Kennedy KF, Masoudi FA, Matheny ME, Kosiborod M, Amin AP, Messenger JC, Rumsfeld JS, Spertus JA. Contemporary incidence, predictors, and outcomes of acute kidney injury in patients undergoing percutaneous coronary interventions: insights from the NCDR cath‐PCI registry. JACC Cardiovasc Interv. 2014; 7:1-9. [DOI] [PMC free article] [PubMed] [Google Scholar]