

Abstract
Background
Resistant hypertension (RHTN), defined by lack of blood pressure (BP) control despite treatment with at least 3 antihypertensive drugs, increases cardiovascular risk compared with controlled hypertension. Yet, there are few data on genetic variants associated with RHTN.
Methods and Results
We used a gene‐centric array containing ≈50 000 single‐nucleotide polymorphisms (SNPs) to identify polymorphisms associated with RHTN in hypertensive participants with coronary artery disease (CAD) from INVEST‐GENES (the INnternational VErapamil‐SR Trandolapril STudy—GENEtic Substudy). RHTN was defined as BP≥140/90 on 3 drugs, or any BP on 4 or more drugs. Logistic regression analysis was performed in European Americans (n=904) and Hispanics (n=837), using an additive model adjusted for age, gender, randomized treatment assignment, body mass index, principal components for ancestry, and other significant predictors of RHTN. Replication of the top SNP was conducted in 241 European American women from WISE (Women's Ischemia Syndrome Evaluation), where RHTN was defined similarly. To investigate the functional effect of rs12817819, mRNA expression was measured in whole blood. We found ATP2B1 rs12817819 associated with RHTN in both INVEST European Americans (P‐value=2.44×10⁻³, odds ratio=1.57 [1.17 to 2.01]) and INVEST Hispanics (P=7.69×10⁻⁴, odds ratio=1.76 [1.27 to 2.44]). A consistent trend was observed at rs12817819 in WISE, and the INVEST‐WISE meta‐analysis result reached chip‐wide significance (P=1.60×10⁻⁶, odds ratio=1.65 [1.36 to 1.95]). Expression analyses revealed significant differences in ATP2B1 expression by rs12817819 genotype.
Conclusions
The ATP2B1 rs12817819 A allele is associated with increased risk for RHTN in hypertensive participants with documented CAD or suspected ischemic heart disease.
Clinical Trial Registration
URL: www.clinicaltrials.gov; Unique identifiers: NCT00133692 (INVEST), NCT00000554 (WISE).
Keywords: genetics, hypertension, pharmacology, resistant hypertension
Introduction
Resistant hypertension (RHTN) is a clinical condition that is commonly defined as requiring at least 4 antihypertensive agents to achieve blood pressure (BP) control.1 According to the National Health and Nutrition Examination Survey, the prevalence of RHTN in the United States was estimated at 12.8% of the treated adult hypertension (HTN) population,2 and similar estimates have been seen in the Anglo‐Scandinavian Cardiac Outcome Trial (13%),3 and The Women's Ischemia Syndrome Evaluation (WISE) study (10.4%).4 However, estimates in other high‐risk HTN populations have been much higher.
In the INternational VErapamil SR Trandolapril STudy (INVEST), which included participants with HTN and coronary artery disease, the prevalence of RHTN was estimated at 38%.5 Predictors of RHTN in INVEST included heart failure, diabetes, renal insufficiency, prior stroke or transient ischemic attack, left‐ventricular hypertrophy, percutaneous intervention, and peripheral vascular disease.5 Also, when compared to INVEST participants with controlled HTN, RHTN participants had a higher risk of adverse cardiovascular outcomes (first occurrence of all‐cause death, nonfatal myocardial infarction, or nonfatal stroke).5 These findings agree with those from other studies, where RHTN patients showed a higher prevalence of target organ damage, including cardiac, vascular, and renal,6 and an increase in cardiovascular risk compared to nonresistant HTN patients.7–8
Large studies have been conducted to address the association of genetic polymorphisms with hypertension,9–10 as well as with responses to antihypertensive drugs.11–12 However, there are limited data on the role of genetic factors in RHTN. The present study sought to identify genetic variants associated with RHTN in INVEST‐GENEtic Substudy (INVEST‐GENES) participants, using a gene‐centric array with coverage of ≈50 000 single‐nucleotide polymorphisms (SNPs) in ≈2100 genes implicated in cardiovascular, inflammatory, and metabolic processes,13 and to replicate the top finding in participants from the WISE study.
Methods
Study Participants
INVEST‐GENES collected DNA samples from 5979 INVEST participants who had clinically stable coronary artery disease and hypertension and who were residing in the United States and Puerto Rico. The participants provided written informed consent to participate in INVEST and INVEST‐GENES. The study was approved by an ethics committee for all participating study sites, and was conducted in accordance with the Declaration of Helsinki and the U.S. Code of Federal Regulations for Protection of Human Subjects. The methods and results of INVEST have been previously published.14 Briefly, participants were randomly assigned to verapamil‐SR‐based or atenolol‐based treatment strategies and were followed with protocol visits every 6 weeks for the first 6 months and every 6 months until the last participant was enrolled. In participants who did not achieve BP goal, hydrochlorothiazide and trandolapril were added to the drug regimen in a protocol‐defined manner, and finally nonstudy antihypertensive drugs were included for BP control. BP was defined in INVEST as the mean of 2 sitting cuff BP measurements, and was taken at randomization and each follow‐up visit.15 The measurements followed the routine clinical standards outlined by the Joint National Committee 6 (JNC6).16
In INVEST, RHTN status was defined using BP values and information on antihypertensive agents from the visit prior to event (all‐cause death, nonfatal myocardial infarction, or nonfatal stroke) or censoring. Participants were considered to have RHTN if BP was ≥140/90 mm Hg despite use of at least 3 antihypertensive agents, or BP was controlled (<140/90) when 4 or more antihypertensives were used. Controls were defined as controlled hypertensive participants (HTN) who had controlled BP (BP <140/90 mm Hg) on 0 to 3 antihypertensive medications. Those who were uncontrolled, but on <3 antihypertensive medications were excluded from analysis. Additionally, sensitivity analyses were performed with the top SNPs using a more narrow definition of RHTN: BP ≥140/90 mm Hg despite use of at least 3 antihypertensive agents including a diuretic, or BP was controlled (<140/90) with the use of 4 or more antihypertensive agents, including a diuretic. Prior analyses in INVEST have shown that using the more narrow definition of RHTN did not change the association between RHTN and poorer outcomes.5
The WISE study, which sought to address ischemic heart disease recognition and diagnosis in women, included women over 18 years of age who were undergoing a clinically indicated coronary angiogram for chest pain symptoms or suspected myocardial ischemia.17 WISE participants provided written informed consent. BP was measured in WISE in clinic settings, and measurements were conducted using the guidelines laid out by the Joint National Committee 6.16 In WISE, apparent treatment‐resistant hypertension (RHTN) and controlled HTN were defined using the same criteria that were used in INVEST based on BP values and information on antihypertensive use at study entry.4
Genotyping
INVEST
Genomic DNA was extracted from buccal cells collected in mouthwash samples according to standard protocols.18 All 1741 INVEST‐GENES participants were successfully genotyped on the HumanCVD Genotyping BeadChip (Illumina, San Diego, CA), a gene‐centric array containing ≈50 000 SNPs in ≈2100 genes associated with cardiovascular, inflammatory, and metabolic processes.13 Genotypes were called using GenomeStudio software version 2011.1 and Genotyping Module version 1.9 calling algorithm (Illumina, San Diego, CA).
WISE
DNA from 507 European American, non‐Hispanic women in the WISE study was isolated from whole blood and was genotyped on the Illumina Cardio‐Metabochip.19
Quality Control
INVEST
Samples were excluded if call rates were <95% and SNPs were excluded if call rates were <90%. Sample contamination was assessed by sex mismatches using X‐chromosome data and through heterozygosity analysis, and cryptic relatedness was estimated by pairwise identity‐by‐descendent analysis in PLINK (http://pngu.mgh.harvard.edu/~purcell/plink/). Principal component analysis was performed with a linkage disequilibrium pruned data set using the EINGENSTRAT method.20 Principal components 1, 2, and 3 provided the best separation of ancestry clusters in the INVEST data and were used as covariates in the subsequent analysis.
WISE
Standard quality‐control procedures were applied, using similar steps as outlined in INVEST. Following a principal component analysis, principal component 1 explained the most variance in the WISE data set and was used as a covariate in the analysis.
Statistical Analysis
Association of genotyped SNPs, calculated as adjusted odds ratios (OR) and 95% CI, with RHTN was tested with multiple logistic regression analysis in INVEST European American and Hispanic race/ethnicity groups separately, under an additive genetic model using PLINK (http://pngu.mgh.harvard.edu/purcell/plink/).21 Analyses were adjusted for variables that were associated with risk of RHTN in the overall INVEST cohort5: age, gender, body mass index, and history of diabetes, heart failure, myocardial infarction, stroke, left ventricular hypertrophy, peripheral vascular disease, and treatment assignment and additional covariates for the genetic substudy: 3 principal components for ancestry. A sensitivity analysis was also conducted adding mean follow‐up time as an additional covariate. Meta‐analysis with INVEST European American and Hispanic race/ethnicity groups was performed using METAL software under a fixed‐effects model, weighting by sample size.22 Meta OR and 95% CI were calculated by Comprehensive Meta‐Analysis software (http://www.meta-analysis.com/, Biostat, Englewood, NJ). Hardy‐Weinberg Equilibrium was calculated separately by race/ethnicity using PLINK software. A statistical threshold of P=2.6×10⁻⁶ was used, which accounts for the ≈20 500 independent tests in Europeans (after accounting for linkage disequilibrium), for a false‐positive rate of 5%.23 In the INVEST‐GENES RHTN case–control cohort, we had 82% power to detect an OR of 1.70 for RHTN, at P=2.6×10⁻⁶ and a minor allele frequency of 0.15 using an additive model.
Association of the top RHTN signal in INVEST was tested in WISE using logistic regression analysis with PLINK, under an additive genetic model.21 The following covariates were included in the adjusted model: age, body mass index, 1 principal component for ancestry, and history of diabetes, heart failure, myocardial infarction, stroke, and peripheral vascular disease. The clinical covariates were added for consistency with the INVEST model, and the number of principal components were selected in each study based on those principal components that best defined the main ancestry cluster(s). Meta‐analysis for rs12817819 between INVEST European Americans, INVEST Hispanics, and WISE European Americans was conducted using METAL under a fixed‐effects model, weighting by sample size,22 with meta OR and 95% CIs calculated using Comprehensive Meta‐Analysis software.
Quantitative Analysis of ATP2B1 Expression According to rs12817819 Genotype
To address the functional implications of ATP2B1, expression of ATP2B1 was measured in 45 European American hypertensive participants from the Pharmacogenomic Evaluation of Antihypertensive Responses Study (PEAR, clinicaltrials.gov NCT00246519). These 45 participants were selected based on rs12817819 genotype. The design of the PEAR study has been previously published.24 Briefly, PEAR included participants between the ages of 17 and 65 with mild‐to‐moderate hypertension. After washout, study participants were randomized to receive hydrochlorothiazide 12.5 mg or atenolol 50 mg daily. If BP remained >120/70 mm Hg after 3 weeks of treatment, doses were titrated to hydrochlorothiazide 25 mg or atenolol 100 mg daily, and treatment was continued for an additional 6 weeks. The other agent was then added based on BP >120/70 mm Hg, with similar dose titration for 6 to 9 weeks of combination treatment.
For this analysis, RNA was isolated from whole blood after combination therapy using the PAXgene Blood RNA Kit IVD (Qiagen, Valencia, CA) and converted to cDNA. This time point was chosen to best represent treatment conditions in RHTN cases who are taking multiple antihypertensive agents. Gene expression was measured by quantitative real‐time reverse transcription polymerase chain reaction with the Taqman 7900HT RealTime PCR System and Taqman Gene Expression Assays (Applied Biosystems, Foster City, CA). Relative gene expression was calculated using the 2−ΔCt method,25 and expression levels were normalized to the reference gene β‐2‐microglobulin. Expression levels between genotype groups (AA+AG versus GG) were compared after combination therapy using an unpaired t test. The significance threshold was set at P<0.05.
Results
The baseline characteristics of the INVEST‐GENES European American and Hispanic groups, according to BP status, are summarized in Table 1. Overall, of the 1741 participants, 29.6% met criteria for RHTN, with 31.1% of European American participants (n=281), and 28.1% of Hispanic participants (n=235) classified as RHTN. The RHTN group in both race/ethnic subgroups had a higher prevalence of diabetes, left ventricular hypertrophy and peripheral vascular disease, and on average were overweight. The systolic blood pressure prior to event or censoring among the RHTN groups was ≈16 to 18 mm Hg higher than for the controlled HTN groups (Table 2). Antihypertensive drug use according to drug class is also presented in Table 2. For both race/ethnicity groups, the RHTN groups were using a significantly higher number of antihypertensive drugs than the controlled HTN groups. Additionally, mean follow‐up time is shown in Table 2. In European Americans, there were no differences between the RHTN group and the controlled HTN group in follow‐up times. However, in Hispanics there was a significant difference between the groups in follow‐up time, with Hispanic RHTN participants' follow‐up time an average of 3.6 months shorter.
Table 1.
Baseline Characteristics of European American and Hispanic INVEST‐GENES Participants According to BP Status
| Baseline Characteristics | European Americans (n=904) | Hispanics (n=837) | ||
|---|---|---|---|---|
| Controlled HTN (n=623) | RHTN (n=281) | Controlled HTN (n=602) | RHTN (n=235) | |
| Age, y, mean±SD | 68.9±9.8 | 69.8±9.0 | 65.5±10.3 | 65.8±10.1 |
| Gender (female) | 265 (42.5%) | 138 (49.1%) | 381 (63.3%) | 154 (65.5%) |
| BMI, kg/m², mean±SD | 28.5±5.5 | 29.4±5.5* | 28.6±5.0 | 29.3±5.3 |
| Baseline SBP, mm Hg, mean±SD | 146.6±16.9 | 152.3±19.5* | 147.1±18.6 | 150.6±19.1* |
| Baseline DBP, mm Hg, mean±SD | 82.6±10.1 | 81.7±10.8 | 87.3±9.7 | 87.9±11.7 |
| Treatment arm β‐blocker | 307 (49.3%) | 152 (54.1%) | 299 (49.7%) | 130 (55.3%) |
| History of: | ||||
| Diabetes* | 89 (14.3%) | 64 (22.8%)* | 76 (12.6%) | 56 (23.8%)* |
| Heart failure (class I to III) | 35 (5.6%) | 16 (5.7%) | 11 (1.8%) | 10 (4.2%)* |
| Myocardial infarction | 227 (36.4%) | 108 (38.4%) | 45 (7.5%) | 32 (13.6%)* |
| Renal insufficiency* | 21 (3.4%) | 11 (3.9%) | 4 (0.7%) | 1 (0.4%) |
| Stroke/TIA | 52 (8.4%) | 30 (10.7%) | 20 (3.3%) | 14 (6.0%) |
| Left ventricular hypertrophy | 68 (10.9%) | 46 (16.4%)* | 77 (12.8%) | 45 (19.1%)* |
| Peripheral vascular disease | 51 (8.2%) | 36 (12.8%)* | 52 (8.6%) | 34 (14.5%)* |
| Percutaneous coronary intervention | 181 (29.1%) | 68 (24.2%) | 11 (1.8%) | 5 (2.1%) |
| Smoking (ever) | 317 (50.9%) | 137 (48.8%) | 200 (33.2%) | 67 (28.5%) |
Numbers represent n (%), unless otherwise specified. BMI indicates body mass index; BP, blood pressure; DBP, diastolic blood pressure; HTN, hypertension; INVEST‐GENES, INternational VErapamil SR Trandolapril Study–GENEtic Substudy; RHTN, resistant hypertension; SBP, systolic blood pressure; TIA, transient ischemic attack.
P≤0.05 compared to Controlled HTN European Americans.
P≤0.05 compared to Controlled HTN Hispanics.
History of or currently taking antidiabetic agent at baseline.
History of or currently have elevated serum creatinine level but < 4 mg/dL.
Table 2.
BP, Antihypertensive Use, and Mean Follow‐Up Time in INVEST‐GENES Participants at Visit Prior to Event or Censoring
| European Americans (n=904) | Hispanics (n=837) | |||
|---|---|---|---|---|
| Controlled HTN (n=623) | RHTN (n=281) | Controlled HTN (n=602) | RHTN (n=235) | |
| SBP, mm Hg, mean±SD | 125.8±9.4 | 141.0±18.1* | 123.6±8.6 | 142.2±16.2* |
| DBP, mm Hg, mean±SD | 73.4±7.5 | 77.0±11.3* | 76.1±6.5 | 83.1±10.1* |
| Number of antihypertensive drugs, mean±SD | 2.2±0.8 | 3.6±0.5* | 2.1±0.8 | 3.5±0.5* |
| Class of antihypertensive drugs | ||||
| Calcium channel blocker | 233 (37.4%) | 106 (37.7%) | 246 (40.9%) | 94 (40%) |
| β‐blocker | 262 (42.1%) | 153 (54.5%)* | 253 (42.0%) | 133 (56.6%)* |
| Thiazide diuretic | 380 (61%) | 251 (89.2%)* | 340 (56.5%) | 214 (91.1%)* |
| ACE inhibitor | 376 (60.4%) | 256 (91.1%)* | 333 (55.3%) | 220 (93.6%)* |
| Others | 73 (11.7%) | 131 (46.6%)* | 38 (6.3%) | 73 (31.1%)* |
| Mean follow‐up time, years, mean±SD | 2.9±0.9 | 2.8±1.0 | 2.5±0.5 | 2.2±0.6* |
Numbers represent n (%), unless otherwise specified. ACE indicates angiotensin‐converting enzyme; BP, blood pressure; DBP, diastolic blood pressure; HTN, hypertension; INVEST‐GENES, INternational VErapamil SR Trandolapril Study–GENEtic Substudy; RHTN, resistant hypertension; SBP, systolic blood pressure.
P≤0.05 compared to Controlled HTN European Americans.
P≤0.05 compared to Controlled HTN Hispanics.
After quality‐control procedures, 45 573 SNPs were included in the association analysis with RHTN in European Americans and Hispanics in INVEST‐GENES. While no SNPs achieved the statistical threshold of P‐value=2.6×10⁻⁶ in European Americans or Hispanics, in European Americans we found 37 SNPs with a P‐value<10−3 and 5 SNPs with P‐value <10−4, and in Hispanics, we found 32 SNPs with a P‐value<10−3 and 3 SNPs with a P‐value<10−4. Meta‐analysis of the European American and Hispanic race/ethnic groups yielded 1 SNP with a P‐value<10−5 and 6 SNPs with a P‐value<10−4, all of them with effects in the same direction in both race/ethnic groups (Table 3). Allele frequency, genotype counts, and Hardy‐Weinberg equilibrium data for the top signals are shown in Table 4.
Table 3.
Association Results for RHTN in INVEST‐GENES Participants by Race/Ethnicity
| SNP | Chr | Position | Nearest Gene | Minor Allele | Race | MAF | OR (95% CI) | P Value | Meta‐Analysis OR (95% CI) | Meta‐Analysis P value |
|---|---|---|---|---|---|---|---|---|---|---|
| rs12817819 | 12 | 88 563 457 | ATP2B1 | A | EA | 0.129 | 1.57 (1.17 to 2.01) | 0.0024 | 1.63 (1.29 to 1.98) | 6.31E‐06 |
| Hispanic | 0.112 | 1.76 (1.27 to 2.44) | 7.69E‐04 | |||||||
| rs324498 | 9 | 9 049 545 | PTPRD | G | EA | 0.171 | 1.50 (1.15 to 1.96) | 0.0032 | 1.51 (1.26 to 1.75) | 1.34E‐05 |
| Hispanic | 0.273 | 1.51 (1.17 to 1.94) | 0.0013 | |||||||
| rs2307023 | 12 | 21 804 552 | KCNJ8 | C | EA | 0.410 | 1.42 (1.15 to 1.75) | 0.0012 | 1.42 (1.21 to 1.62) | 1.63E‐05 |
| Hispanic | 0.367 | 1.41 (1.11 to 1.77) | 0.0044 | |||||||
| rs12314380 | 12 | 20 519 183 | PDE3A | A | EA | 0.020 | 3.88 (1.95 to 7.70) | 1.09E‐04 | 1.51 (1.10 to 1.92) | 4.35E‐05 |
| Hispanic | 0.111 | 1.40 (0.98 to 2.00) | 0.0609 | |||||||
| rs2299260 | 7 | 94 787 473 | PON1 | G | EA | 0.183 | 1.50 (1.15 to 1.95) | 0.0026 | 1.46 (1.21 to 1.70) | 8.19E‐05 |
| Hispanic | 0.191 | 1.42 (1.08 to 1.86) | 0.0109 | |||||||
| rs10047560 | 12 | 20 496 483 | PDE3A | A | EA | 0.019 | 3.52 (1.75 to 7.09) | 4.28E‐04 | 1.57 (1.14 to 2.00) | 8.79E‐05 |
| Hispanic | 0.108 | 1.45 (1.01 to 2.08) | 0.0460 |
SNPs ID and chromosomal positions are based on NCBI build 36. Chr indicates chromosome; EA, European American; INVEST‐GENES, INternational VErapamil SR Trandolapril Study–GENEtic Substudy; MAF, minor allele frequency; OR, odds ratio; RHTN, resistant hypertension; SNP, single‐nucleotide polymorphism.
Table 4.
Genotype Frequencies and Hardy‐Weinberg Equilibrium P Values in INVEST and WISE
| Marker | Alleles | MAF | Genotype Frequencies (mm/mM/MM) | Hardy‐Weinberg Equilibrium P Value | |
|---|---|---|---|---|---|
| Minor (m) | Major (M) | ||||
| INVEST European American | |||||
| rs12817819 | A | G | 0.129 | 18/198/688 | 0.3770 |
| rs324498 | G | A | 0.171 | 23/263/617 | 0.4819 |
| rs2307023 | C | A | 0.410 | 151/436/313 | 1 |
| rs12314380 | A | G | 0.020 | 0/37/867 | 1 |
| rs2299260 | G | A | 0.183 | 26/279/599 | 0.3751 |
| rs10047560 | A | G | 0.019 | 0/35/868 | 1 |
| INVEST Hispanic | |||||
| rs12817819 | A | G | 0.112 | 14/159/664 | 0.2210 |
| rs324498 | G | A | 0.273 | 61/334/441 | 0.9305 |
| rs2307023 | C | A | 0.367 | 107/399/329 | 0.4564 |
| rs12314380 | A | G | 0.111 | 10/166/661 | 1 |
| rs2299260 | G | A | 0.191 | 32/256/549 | 0.7378 |
| rs10047560 | A | G | 0.108 | 6/169/662 | 0.2110 |
| WISE | |||||
| rs12817819 | A | G | 0.113 | 2/50/188 | 0.7479 |
INVEST, INternational VErapamil SR Trandolapril Study; MAF indicates minor allele frequency; WISE, Women's Ischemia Syndrome Evaluation.
The top signal in the INVEST European American–Hispanic meta‐analysis was rs12817819 in intron 1 of ATP2B1 (ATPase, Ca++ transporting, plasma membrane 1). There was a 57% to 76% increase in risk for RHTN for each additional copy of the A allele at rs12817819 (European American OR [95% CI]=1.57 [1.17 to 2.01]; P‐value=2.44×10⁻³, and Hispanic OR [95% CI]=1.76 [1.27 to 2.44]; P‐value=7.69×10⁻⁴), with the meta‐analysis P‐value=6.31×10⁻⁶, and OR (95% CI)=1.63 (1.29 to 1.98) (Table 3, Figure 1). The minor allele frequency (A allele) in European Americans and Hispanics was 0.129 and 0.112, respectively (Table 3).
Figure 1.
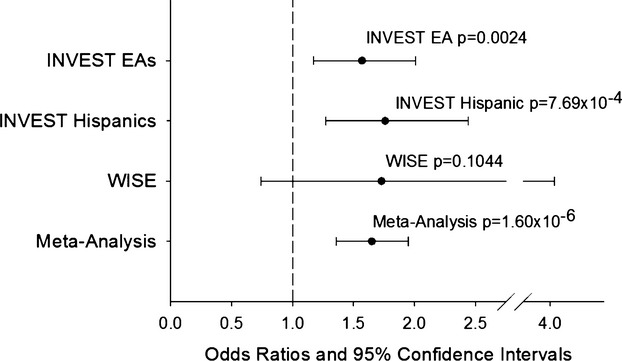
Adjusted odds ratios and 95% CIs for resistant hypertension risk for ATP2B1 rs12817819 in INternational VErapamil SR Trandolapril STudy (INVEST) European Americans (EA), INVEST Hispanics, The Women's Ischemia Syndrome Evaluation (WISE) study, and meta‐analysis.
There were 5 other SNPs from the INVEST European American–Hispanic meta‐analysis with P‐values <1×10⁻⁴ (Table 3). These included rs324498 in PTPRD (protein tyrosine phosphatase, receptor type, D), rs2307023 downstream of KCNJ8 (potassium inwardly rectifying channel, subfamily J, member 8), rs2299260 in PON1 (paraoxonase 1), and 2 SNPs (rs12314380 and rs10047560) at the PDE3A (phosphodiesterase 3A, cGMP‐inhibited) locus. These SNPs showed a 40% to 388% increase in risk for RHTN for each additional copy of the risk allele (Table 3).
In sensitivity analysis, after removal of 30 European American RHTN cases and 21 Hispanic RHTN cases who were not taking a diuretic, the SNP‐RHTN associations remained broadly similar (Table 5). Also, another sensitivity analysis, adjusting for mean follow‐up time, had very little effect on the SNP‐RHTN association results (Table 6).
Table 5.
Sensitivity Analyses of the Top SNPs Associated With RHTN in INVEST‐GENES, After Removing INVEST‐GENES RHTN Cases That Were Not on a Diuretic
| SNP | Chr | Position | Nearest Gene | Minor Allele | Race | MAF | OR (95% CI) | P Value | Meta‐Analysis OR (95% CI) | Meta‐Analysis P Value |
|---|---|---|---|---|---|---|---|---|---|---|
| rs12817819 | 12 | 88 563 457 | ATP2B1 | A | EA | 0.126 | 1.55 (1.13 to 2.11) | 0.0059 | 1.68 (1.35 to 2.01) | 4.53E‐06 |
| Hispanic | 0.113 | 1.90 (1.36 to 2.66) | 1.76E‐04 | |||||||
| rs324498 | 9 | 9 049 545 | PTPRD | G | EA | 0.170 | 1.53 (1.15 to 2.03) | 0.0032 | 1.56 (1.30 to 1.82) | 6.23E‐06 |
| Hispanic | 0.273 | 1.58 (1.22 to 2.04) | 5.60E‐04 | |||||||
| rs2307023 | 12 | 21 804 552 | KCNJ8 | C | EA | 0.408 | 1.41 (1.13 to 1.75) | 0.0021 | 1.43 (1.23 to 1.64) | 1.47E‐05 |
| Hispanic | 0.368 | 1.46 (1.15 to 1.87) | 0.0022 | |||||||
| rs12314380 | 12 | 20 519 183 | PDE3A | A | EA | 0.021 | 4.53 (2.27 to 9.03) | 1.79E‐05 | 1.45 (1.03 to 1.86) | 3.19E‐05 |
| Hispanic | 0.110 | 1.34 (0.92 to 1.95) | 0.1220 | |||||||
| rs2299260 | 7 | 94 787 473 | PON1 | G | EA | 0.179 | 1.42 (1.07 to 1.87) | 0.0139 | 1.43 (1.18 to 1.67) | 4.68E‐04 |
| Hispanic | 0.190 | 1.43 (1.08 to 1.89) | 0.0128 | |||||||
| rs10047560 | 12 | 20 496 483 | PDE3A | A | EA | 0.020 | 4.12 (2.04 to 8.34) | 8.11E‐05 | 1.57 (1.13 to 2.01) | 2.93E‐05 |
| Hispanic | 0.108 | 1.45 (1.00 to 2.12) | 0.0530 |
SNP ID and chromosomal positions are based on NCBI build 36. Chr indicates chromosome; EA, European American; INVEST‐GENES, INternational VErapamil SR Trandolapril Study–GENEtic Substudy; MAF, minor allele frequency; OR, odds ratio; RHTN, resistant hypertension; SNP, single‐nucleotide polymorphism.
Table 6.
Sensitivity Analyses of the Top SNPs Associated With RHTN in INVEST‐GENES, After Adding Mean Follow‐Up Time as an Additional Covariate
| SNP | Chr | Position | Nearest Gene | Minor Allele | Race | MAF | OR (95% CI) | P Value | Meta‐Analysis OR (95% CI) | Meta‐Analysis P Value |
|---|---|---|---|---|---|---|---|---|---|---|
| rs12817819 | 12 | 88 563 457 | ATP2B1 | A | EA | 0.129 | 1.57 (1.17 to 2.10) | 0.0024 | 1.69 (1.47 to 1.91) | 2.54E‐06 |
| Hispanic | 0.112 | 1.85 (1.33 to 2.58) | 2.86E‐04 | |||||||
| rs324498 | 9 | 9 049 545 | PTPRD | G | EA | 0.171 | 1.50 (1.15 to 1.97) | 0.0031 | 1.50 (1.32 to 1.69) | 1.78E‐05 |
| Hispanic | 0.273 | 1.50 (1.16 to 1.94) | 0.0019 | |||||||
| rs2307023 | 12 | 21 804 552 | KCNJ8 | C | EA | 0.410 | 1.41 (1.15 to 1.74) | 0.0013 | 1.44 (1.28 to 1.60) | 5.82E‐06 |
| Hispanic | 0.367 | 1.48 (1.16 to 1.88) | 0.0015 | |||||||
| rs12314380 | 12 | 20 519 183 | PDE3A | A | EA | 0.020 | 3.95 (1.99 to 7.86) | 8.99E‐05 | 1.96 (1.65 to 2.28) | 3.39E‐05 |
| Hispanic | 0.111 | 1.42 (0.99 to 2.04) | 0.0563 | |||||||
| rs2299260 | 7 | 94 787 473 | PON1 | G | EA | 0.183 | 1.51 (1.16 to 1.97) | 0.0026 | 1.52 (1.33 to 1.71) | 1.99E‐05 |
| Hispanic | 0.191 | 1.52 (1.15 to 2.01) | 0.0029 | |||||||
| rs10047560 | 12 | 20 496 483 | PDE3A | A | EA | 0.019 | 3.62 (1.79to 7.31) | 3.35E‐04 | 1.93 (1.60 to 2.26) | 6.50E‐05 |
| Hispanic | 0.108 | 1.47 (1.01 to 2.12) | 0.0421 |
SNP ID and chromosomal positions are based on NCBI build 36. Chr indicates chromosome; EA, European American; INVEST‐GENES, INternational VErapamil SR Trandolapril Study–GENEtic Substudy; MAF, minor allele frequency; OR, odds ratio; RHTN, resistant hypertension; SNP, single‐nucleotide polymorphism.
In order to replicate our top signal, ATP2B1 rs12817819, we investigated the association of this SNP with RHTN in the WISE RHTN cohort. The baseline characteristics for the European American WISE RHTN (n=31) and Controlled BP (n=209) groups are shown in Table 7. Overall, the WISE participants with RHTN were older than those with controlled BP and had a higher prevalence of peripheral vascular disease. We observed a consistent trend with rs12817819 and RHTN in WISE (1‐sided P‐value=0.1044, OR [95% CI]=1.73 (0.74 to 4.04), Figure 1). On meta‐analysis of INVEST European Americans, INVEST Hispanics, and WISE European Americans, we reached chip‐wide significance with a P‐value=1.60×10⁻⁶ and OR (95% CI)=1.65 (1.36 to 1.95), Figure 1. Genotype‐specific ORs at rs12817819 are shown in Figure 2. This SNP showed no evidence of heterogeneity across the 3 studies (I2=0%, P‐value=0.9485).
Table 7.
WISE Baseline Characteristics
| Characteristics | Controlled HTN (n=209) | RHTN (n=31) |
|---|---|---|
| Age, y, mean±SD | 58.2±11.7 | 65.5±10.5* |
| BMI, kg/m2, mean±SD | 28.6±8.1 | 28.0±8.3 |
| SBP, mm Hg, mean±SD | 122.4±12.2 | 152.7±17.4* |
| DBP, mm Hg, mean±SD | 71.6±9.2 | 77.0±13.1* |
| History of: | ||
| Diabetes | 51 (24.4) | 12 (38.7) |
| Heart failure | 9 (4.3) | 2 (6.5) |
| Myocardial infarction | 6 (2.9) | 1 (3.2) |
| Stroke | 9 (4.3) | 1 (3.2) |
| PVD | 10 (4.8) | 6 (19.4)* |
| Smoking | 119 (56.9) | 14 (45.2) |
Numbers represent n (%), unless otherwise specified. BMI indicates body mass index; DBP, diastolic blood pressure; HTN, hypertension; PVD, peripheral vascular disease; RHTN, resistant hypertension; SBP, systolic blood pressure; WISE, WISE, Women's Ischemia Syndrome Evaluation.
P≤0.05 compared to controlled HTN participants.
Figure 2.
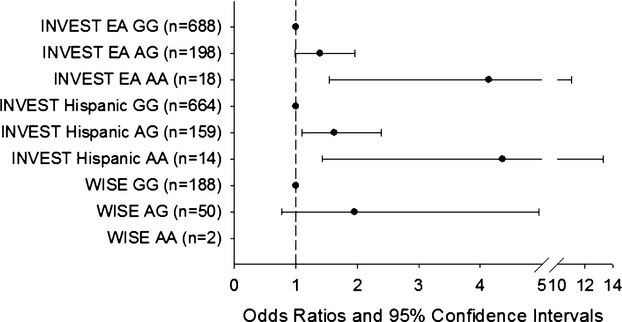
Genotype‐specific odds ratios and 95% CI for resistant hypertension risk for ATP2B1 rs12817819 in INternational VErapamil SR Trandolapril STudy (INVEST) European Americans (EA), INVEST Hispanics, and The Women's Ischemia Syndrome Evaluation (WISE). WISE AA genotype specific odds ratio and 95% CI was unestimable due to low genotype count (n=2).
Gene expression of ATP2B1 by rs12817819 genotype was measured in 45 European Americans from the PEAR study: GG (n=23), AG (n=21), and AA (n=1). A allele carriers (AG+AA), the allele associated with increased RHTN risk, had a significantly lower expression of ATP2B1 when compared to GG homozygotes (P=0.0343, Figure 3).
Figure 3.
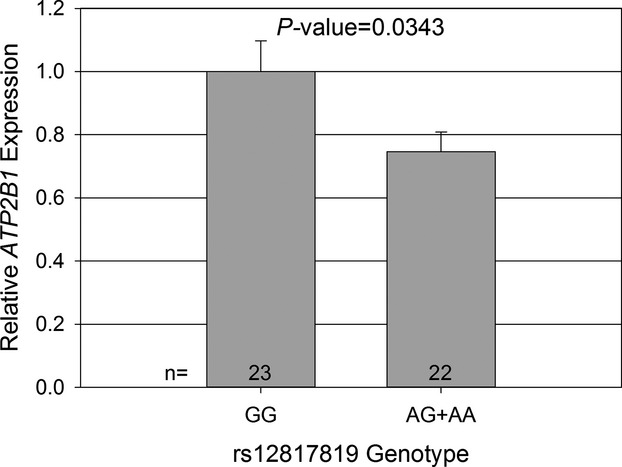
Relative gene expression of ATP2B1 by rs12817819 genotype in 45 European Americans (EA) from the Pharmacogenomic Evaluation of Antihypertensive Responses study. Expression data are normalized to β‐2‐microglobulin. Error bars indicate standard error.
Discussion
To the best of our knowledge, this is the first study to investigate the genetic association of a large number of SNPs with RHTN using data from a clinical trial. In a gene‐centric analysis, we found that rs12817819 in ATP2B1 was strongly associated with RHTN in both European American and Hispanic race/ethnic groups in INVEST, and a consistent trend was observed in a cohort of European American women from the WISE study. Additionally, meta‐analysis of all 3 groups yielded chip‐wide significance.
Prior studies have reported robust associations at the ATP2B1 locus with systolic and diastolic BP, as well as with hypertension in genome‐wide and gene‐centric studies.9–10,26 A 17% increase in the odds for hypertension per risk allele for rs2681472 was estimated in ≈29 000 participants from the CHARGE consortium.9 Additionally, another SNP at the ATP2B1 locus (rs7136259) was associated with coronary artery disease in a Chinese population.27 The SNP in this report, rs12817819, is not in linkage disequilibrium with rs2681472 (r2=0.01), and the BP/HTN GWAS SNPs were not associated with RHTN in our study. ATP2B1 is located at 12q21.3 region and encodes a plasma membrane calcium/calmodulin‐dependent ATPase that plays an important role in intracellular calcium homeostasis and smooth muscle cell contraction.
The ATP2B1 protein is expressed in several human tissues,28 and higher mRNA levels were reported in smooth muscle cells of spontaneously hypertensive rats.29 Other studies suggest an inverse relationship between ATP2B1 expression and BP levels. Atp2b1 knockout mice have shown reduced expression of Atp2b1 in vascular smooth muscle cells, which was associated with elevated BP.30–31 The latter scenario is in line with our results; we observed that the A allele at rs12817819 was associated with lower expression of ATP2B1 and was associated with RHTN. Since calcium is a key element in smooth muscle and cardiac contraction, it is reasonable that disequilibrium in calcium homeostasis could affect BP response to antihypertensive drugs, and in turn, could affect RHTN.
We also observed associations with RHTN in INVEST European Americans and INVEST Hispanics at rs324498 (PTPRD), rs2307023 (KCNJ8), rs12314380 and rs10047560 (PDE3A), and rs2299260 (PON1). PTPRD (protein tyrosine phosphatase, receptor type, D) is located on chromosome 9p23 and encodes a signaling molecule that regulates cell growth, differentiation, and the cell cycle. Variation in the PTPRD gene was previously associated with susceptibility for type 2 diabetes,32 and coronary artery disease.33 rs2307023 is an intergenic variation and the closest gene is KCNJ8 (potassium inwardly rectifying channel, subfamily J, member 8), which encodes for a protein that promotes vascular relaxation when activated.34 We also found association with 2 intronic SNPs in PDE3A. PDE3A (phosphodiesterase 3A, cGMP‐inhibited) encodes an enzyme that hydrolyzes cAMP and cGMP, and regulates intracellular cyclic nucleotide signals, such as vascular muscle contraction and relaxation. PDE3A variants have been associated with aortic root diameter in a meta‐analysis of 5 cohorts.35 Finally, rs2299260 is an intronic SNP in PON1 (paraoxonase 1). PON1 is an enzyme that hydrolyzes paroxon to produce p‐nitrophenol, whose enzyme activity has been correlated with atherosclerosis.36 Additionally, variants in PON1 have mixed evidence of association with many phenotypes including coronary heart disease,37–38 and ischemic stroke.39–40
There are no functional data on the possible effects that these SNPs may have on transcriptional regulation or protein function. The true causal variants in these regions may be other SNPs that were not covered on our array, and the observed association may be explained by the linkage disequilibrium between these SNPs and the possible untyped causal variants.
Overall, our findings suggest that variations in genes related to vascular tone regulation are associated with greater risk for RHTN. Genetic variations disturbing biochemical pathways involved in vasodilation may affect BP response to antihypertensive agents. Additionally, impaired vasodilation may explain the resistance to multiple antihypertensive agents that is observed in RHTN. In fact, it has been shown that vascular damage, such as arterial stiffness, endothelial dysfunction, and increased carotid intima‐media thickness, is a common characteristic of patients with RHTN.6,41–42
While this is the first study to investigate the genetic association of a large number of SNPs with RHTN using data from a clinical trial, other studies have explored the genetics of RHTN. In particular, GenHAT studied 78 candidate gene polymorphisms for association with RHTN.43 The adverse outcomes associated with RHTN were very similar between INVEST5 and GenHAT;43 however, the genetic association findings from GenHAT were not among our top signals reported here. This could be due to the differences in the time point used to define RHTN status, the differences in control definition, and/or the differences in diuretic use in the RHTN cases between the 2 studies (INVEST ≈90% of RHTN cases were on a diuretic versus 53% to 60% in GenHAT).43
This is the first genome‐spanning genetic association study of RHTN in a large clinical trial, where RHTN has been well defined.5 However, there are some limitations to our study worthy of mention. First, our findings are restricted to European American and Hispanic race/ethnic groups, and thus cannot be generalized to other race/ethnic groups. Furthermore, our study utilized data from a genome‐spanning gene chip, and not a genome‐wide chip; thus, it is very likely there are additional signals for RHTN that were not included here. Also, medication adherence data were not collected in INVEST. Therefore we cannot discount the possibility that some participants with pseudoresistant HTN may have been classified as a RHTN case. Additionally, while we observed a consistent trend for association with rs12817819 and RHTN in WISE, a significant replication was not observed. This could be due to the differences in gender between INVEST (males and females) and WISE (all female). In fact, when analysis at rs12817819 was conducted by gender in INVEST, males showed stronger evidence of association with RHTN compared to females (Table 8). Finally, it is important to note that gene expression studies are often fraught with issues of reproducibility and confounding. However, our data were highly reproducible, with coefficients of variation for our triplicate repeats ranging from 0.02% to 1.4% (mean=0.30%). Also, when other factors, such as age, gender, and serum potassium were examined between genotype groups, no statistical differences were found (Table 9). These data suggest that the observed difference is due to a true difference in gene expression between the genotype groups, and we would expect this to be similar or more pronounced in our target tissues (eg, vascular smooth muscle).
Table 8.
Association Results of the Top SNP Associated With RHTN in INVEST‐GENES, ATP2B1 rs12817819, by Gender in INVEST‐GENES
| Gender | Minor Allele | Race | n | MAF | OR (95% CI) | P Value | Meta‐Analysis OR (95% CI) | Meta‐Analysis P Value |
|---|---|---|---|---|---|---|---|---|
| Males | A | EA | 501 | 0.124 | 1.70 (1.14 to 2.55) | 0.0093 | 1.77 (1.44 to 2.10) | 6.16E‐04 |
| Hispanic | 302 | 0.119 | 1.91 (1.08 to 3.40) | 0.0254 | ||||
| Females | A | EA | 403 | 0.137 | 1.41 (0.91 to 2.19) | 0.1226 | 1.56 (1.26 to 1.86) | 3.53E‐03 |
| Hispanic | 535 | 0.108 | 1.70 (1.13 to 2.57) | 0.0116 |
EA indicates European American; INVEST‐GENES, INternational VErapamil SR Trandolapril Study–GENEtic Substudy; MAF, minor allele frequency; n, number; odds ratio; RHTN, resistant hypertension; SNP, single‐nucleotide polymorphism.
Table 9.
Characteristics for the PEAR Participants From the ATP2B1 Gene Expression Analysis
| Characteristics | rs12817819 AA/AG (n=22) | rs12817819 GG (n=23) | P Value |
|---|---|---|---|
| Age, y (mean±SD) | 48.0±10.7 | 48.9±10.5 | 0.7957 |
| Gender | 0.8330 | ||
| Males, number, % | 15 (33%) | 15 (33%) | |
| Females, number, % | 7 (15%) | 8 (18%) | |
| Serum potassium, mEq/L (mean±SD) | 4.22±0.44 | 4.28±0.51 | 0.6887 |
PEAR, Pharmacogenomic Evaluation of Antihypertensive Responses.
A better understanding of the role of genetic variations in RHTN may provide the possibility to identify patients with a higher risk for RHTN and initiate pharmacological therapy with a targeted treatment regimen or even include those patients in nonpharmacological therapies, such as renal nerve ablation or baroreceptor stimulator devices. Using pharmacogenomic markers to predict RHTN could reduce the time to achieve BP control in these patients, and could ultimately reduce the cardiovascular morbidity and mortality that is associated with the disease.
Conclusions
We observed a robust association between the A allele at rs12817819 in ATP2B1 and increased risk for RHTN in European American and Hispanic race/ethnic groups from the INVEST study, and observed a consistent trend between rs12817819 and RHTN in European American women from the WISE study. Additionally, we found differences in expression of ATP2B1 by rs12817819 genotype. Taken together, these results suggest that variation in ATP2B1 may contribute to risk of RHTN in European Americans and Hispanics.
Sources of Funding
This project was supported by NIH grants R01HL074730, and U01‐GM074492, as well as grants from the University of Florida Opportunity Fund and Abbott Pharmaceuticals. INVEST was supported by the University of Florida and grants from BASF Pharma and Abbott Laboratories. PEAR was supported by the National Institutes of Health Pharmacogenomics Research Network grant U01‐GM074492 and the National Center for Advancing Translational Sciences under the award number UL1 TR000064 (University of Florida); UL1 TR000454 (Emory University); UL1 TR000135 (Mayo Clinic) and funds from the Mayo Foundation.
Disclosures
Gong, Gums, Chapman, Turner, Pepine, Johnson, and Cooper‐DeHoff received funding from the National Institutes of Health. The other authors report no conflicts.
Acknowledgments
We thank the INVEST site investigators and the INVEST‐GENES participants. We acknowledge and thank the valuable contributions of the PEAR study participants, support staff, and study physicians.
References
- 1.Calhoun DA, Jones D, Textor S, Goff DC, Murphy TP, Toto RD, White A, Cushman WC, White W, Sica D, Ferdinand K, Giles TD, Falkner B, Carey RM. Resistant hypertension: diagnosis, evaluation, and treatment. A scientific statement from the American Heart Association Professional Education Committee of the Council for High Blood Pressure Research. Hypertension. 2008; 51:1403-1419. [DOI] [PubMed] [Google Scholar]
- 2.Persell SD. Prevalence of resistant hypertension in the United States, 2003–2008. Hypertension. 2011; 57:1076-1080. [DOI] [PubMed] [Google Scholar]
- 3.Gupta AK, Nasothimiou EG, Chang CL, Sever PS, Dahlöf B, Poulter NRASCOT Investigators. Baseline predictors of resistant hypertension in the Anglo‐Scandinavian Cardiac Outcome Trial (ASCOT): a risk score to identify those at high‐risk. J Hypertens. 2011; 29:2004-2013. [DOI] [PubMed] [Google Scholar]
- 4.Smith SM, Huo T, Delia Johnson B, Bittner V, Kelsey SF, Vido Thompson D, Noel Bairey Merz C, Pepine CJ, Cooper‐Dehoff RM. Cardiovascular and mortality risk of apparent resistant hypertension in women with suspected myocardial ischemia: a report from the NHLBI‐sponsored WISE study. J Am Heart Assoc. 2014; 3:e000660. [DOI] [PMC free article] [PubMed] [Google Scholar]
- 5.Smith SM, Gong Y, Handberg E, Messerli FH, Bakris GL, Ahmed A, Bavry AA, Pepine CJ, Cooper‐Dehoff RM. Predictors and outcomes of resistant hypertension among patients with coronary artery disease and hypertension. J Hypertens. 2014; 32:635-643. [DOI] [PMC free article] [PubMed] [Google Scholar]
- 6.Cuspidi C, Macca G, Sampieri L, Michev I, Salerno M, Fusi V, Severgnini B, Meani S, Magrini F, Zanchetti A. High prevalence of cardiac and extracardiac target organ damage in refractory hypertension. J Hypertens. 2001; 19:2063-2070. [DOI] [PubMed] [Google Scholar]
- 7.Daugherty SL, Powers JD, Magid DJ, Tavel HM, Masoudi FA, Margolis KL, O'Connor PJ, Selby JV, Ho PM. Incidence and prognosis of resistant hypertension in hypertensive patients. Circulation. 2012; 125:1635-1642. [DOI] [PMC free article] [PubMed] [Google Scholar]
- 8.Pierdomenico SD, Lapenna D, Bucci A, Di Tommaso R, Di Mascio R, Manente BM, Caldarella MP, Neri M, Cuccurullo F, Mezzetti A. Cardiovascular outcome in treated hypertensive patients with responder, masked, false resistant, and true resistant hypertension. Am J Hypertens. 2005; 18:1422-1428. [DOI] [PubMed] [Google Scholar]
- 9.Levy D, Ehret GB, Rice K, Verwoert GC, Launer LJ, Dehghan A, Glazer NL, Morrison AC, Johnson AD, Aspelund T, Aulchenko Y, Lumley T, Köttgen A, Vasan RS, Rivadeneira F, Eiriksdottir G, Guo X, Arking DE, Mitchell GF, Mattace‐Raso FU, Smith AV, Taylor K, Scharpf RB, Hwang SJ, Sijbrands EJ, Bis J, Harris TB, Ganesh SK, O'Donnell CJ, Hofman A, Rotter JI, Coresh J, Benjamin EJ, Uitterlinden AG, Heiss G, Fox CS, Witteman JC, Boerwinkle E, Wang TJ, Gudnason V, Larson MG, Chakravarti A, Psaty BM, van Duijn CM. Genome‐wide association study of blood pressure and hypertension. Nat Genet. 2009; 41:677-687. [DOI] [PMC free article] [PubMed] [Google Scholar]
- 10.Ganesh SK, Tragante V, Guo W, Guo Y, Lanktree MB, Smith EN, Johnson T, Castillo BA, Barnard J, Baumert J, Chang YP, Elbers CC, Farrall M, Fischer ME, Franceschini N, Gaunt TR, Gho JM, Gieger C, Gong Y, Isaacs A, Kleber ME, Mateo Leach I, McDonough CW, Meijs MF, Mellander O, Molony CM, Nolte IM, Padmanabhan S, Price TS, Rajagopalan R, Shaffer J, Shah S, Shen H, Soranzo N, van der Most PJ, Van Iperen EP, Van Setten JA, Vonk JM, Zhang L, Beitelshees AL, Berenson GS, Bhatt DL, Boer JM, Boerwinkle E, Burkley B, Burt A, Chakravarti A, Chen W, Cooper‐Dehoff RM, Curtis SP, Dreisbach A, Duggan D, Ehret GB, Fabsitz RR, Fornage M, Fox E, Furlong CE, Gansevoort RT, Hofker MH, Hovingh GK, Kirkland SA, Kottke‐Marchant K, Kutlar A, Lacroix AZ, Langaee TY, Li YR, Lin H, Liu K, Maiwald S, Malik R, Murugesan G, Newton‐Cheh C, O'Connell JR, Onland‐Moret NC, Ouwehand WH, Palmas W, Penninx BW, Pepine CJ, Pettinger M, Polak JF, Ramachandran VS, Ranchalis J, Redline S, Ridker PM, Rose LM, Scharnag H, Schork NJ, Shimbo D, Shuldiner AR, Srinivasan SR, Stolk RP, Taylor HA, Thorand B, Trip MD, van Duijn CM, Verschuren WM, Wijmenga C, Winkelmann BR, Wyatt S, Young JH, Boehm BO, Caulfield MJ, Chasman DI, Davidson KW, Doevendans PA, Fitzgerald GA, Gums JG, Hakonarson H, Hillege HL, Illig T, Jarvik GP, Johnson JA, Kastelein JJ, Koenig W, Marz W, Mitchell BD, Murray SS, Oldehinkel AJ, Rader DJ, Reilly MP, Reiner AP, Schadt EE, Silverstein RL, Snieder H, Stanton AV, Uitterlinden AG, van der Harst P, van der Schouw YT, Samani NJ, Johnson AD, Munroe PB, de Bakker PI, Zhu X, Levy D, Keating BJ, Asselbergs FWCARDIOGRAM META, Study LC. Loci influencing blood pressure identified using a cardiovascular gene‐centric array. Hum Mol Genet. 2013; 22:1663-1678. [DOI] [PMC free article] [PubMed] [Google Scholar]
- 11.Gong Y, McDonough CW, Wang Z, Hou W, Cooper‐DeHoff RM, Langaee TY, Beitelshees AL, Chapman AB, Gums JG, Bailey KR, Boerwinkle E, Turner ST, Johnson JA. Hypertension susceptibility loci and blood pressure response to antihypertensives: results from the pharmacogenomic evaluation of antihypertensive responses study. Circ Cardiovasc Genet. 2012; 5:686-691. [DOI] [PMC free article] [PubMed] [Google Scholar]
- 12.Silva PS, Fontana V, Luizon MR, Lacchini R, Silva WA, Biagi C, Tanus‐Santos JE. eNOS and BDKRB2 genotypes affect the antihypertensive responses to enalapril. Eur J Clin Pharmacol. 2013; 69:167-177. [DOI] [PubMed] [Google Scholar]
- 13.Keating BJ, Tischfield S, Murray SS, Bhangale T, Price TS, Glessner JT, Galver L, Barrett JC, Grant SF, Farlow DN, Chandrupatla HR, Hansen M, Ajmal S, Papanicolaou GJ, Guo Y, Li M, Derohannessian S, de Bakker PI, Bailey SD, Montpetit A, Edmondson AC, Taylor K, Gai X, Wang SS, Fornage M, Shaikh T, Groop L, Boehnke M, Hall AS, Hattersley AT, Frackelton E, Patterson N, Chiang CW, Kim CE, Fabsitz RR, Ouwehand W, Price AL, Munroe P, Caulfield M, Drake T, Boerwinkle E, Reich D, Whitehead AS, Cappola TP, Samani NJ, Lusis AJ, Schadt E, Wilson JG, Koenig W, McCarthy MI, Kathiresan S, Gabriel SB, Hakonarson H, Anand SS, Reilly M, Engert JC, Nickerson DA, Rader DJ, Hirschhorn JN, Fitzgerald GA. Concept, design and implementation of a cardiovascular gene‐centric 50 k SNP array for large‐scale genomic association studies. PLoS One. 2008; 3:e3583. [DOI] [PMC free article] [PubMed] [Google Scholar]
- 14.Pepine CJ, Handberg EM, Cooper‐DeHoff RM, Marks RG, Kowey P, Messerli FH, Mancia G, Cangiano JL, Garcia‐Barreto D, Keltai M, Erdine S, Bristol HA, Kolb HR, Bakris GL, Cohen JD, Parmley WWINVEST Investigators. A calcium antagonist vs a non‐calcium antagonist hypertension treatment strategy for patients with coronary artery disease. The International Verapamil‐Trandolapril Study (INVEST): a randomized controlled trial. JAMA. 2003; 290:2805-2816. [DOI] [PubMed] [Google Scholar]
- 15.Pepine CJ, Handberg‐Thurmond E, Marks RG, Conlon M, Cooper‐DeHoff R, Volkers P, Zellig P. Rationale and design of the International Verapamil SR/Trandolapril Study (INVEST): An internet‐based randomized trial in coronary artery disease patients with hypertension. J Am Coll Cardiol. 1998; 32:1228-1237. [DOI] [PubMed] [Google Scholar]
- 16. The sixth report of the Joint National Committee on prevention, detection, evaluation, and treatment of high blood pressure. Arch Intern Med. 1997; 157:2413-2446. [DOI] [PubMed] [Google Scholar]
- 17.Merz CN, Kelsey SF, Pepine CJ, Reichek N, Reis SE, Rogers WJ, Sharaf BL, Sopko G. The Women's Ischemia Syndrome Evaluation (WISE) study: Protocol design, methodology and feasibility report. J Am Coll Cardiol. 1999; 33:1453-1461. [DOI] [PubMed] [Google Scholar]
- 18.Andrisin TE, Humma LM, Johnson JA. Collection of genomic DNA by the noninvasive mouthwash method for use in pharmacogenetic studies. Pharmacotherapy. 2002; 22:954-960. [DOI] [PubMed] [Google Scholar]
- 19.Voight BF, Kang HM, Ding J, Palmer CD, Sidore C, Chines PS, Burtt NP, Fuchsberger C, Li Y, Erdmann J, Frayling TM, Heid IM, Jackson AU, Johnson T, Kilpelainen TO, Lindgren CM, Morris AP, Prokopenko I, Randall JC, Saxena R, Soranzo N, Speliotes EK, Teslovich TM, Wheeler E, Maguire J, Parkin M, Potter S, Rayner NW, Robertson N, Stirrups K, Winckler W, Sanna S, Mulas A, Nagaraja R, Cucca F, Barroso I, Deloukas P, Loos RJ, Kathiresan S, Munroe PB, Newton‐Cheh C, Pfeufer A, Samani NJ, Schunkert H, Hirschhorn JN, Altshuler D, McCarthy MI, Abecasis GR, Boehnke M. The metabochip, a custom genotyping array for genetic studies of metabolic, cardiovascular, and anthropometric traits. PLoS Genet. 2012; 8:e1002793. [DOI] [PMC free article] [PubMed] [Google Scholar]
- 20.Price AL, Patterson NJ, Plenge RM, Weinblatt ME, Shadick NA, Reich D. Principal components analysis corrects for stratification in genome‐wide association studies. Nat Genet. 2006; 38:904-909. [DOI] [PubMed] [Google Scholar]
- 21.Purcell S, Neale B, Todd‐Brown K, Thomas L, Ferreira MA, Bender D, Maller J, Sklar P, de Bakker PI, Daly MJ, Sham PC. Plink: A tool set for whole‐genome association and population‐based linkage analyses. Am J Hum Genet. 2007; 81:559-575. [DOI] [PMC free article] [PubMed] [Google Scholar]
- 22.Willer CJ, Li Y, Abecasis GR. Metal: fast and efficient meta‐analysis of genomewide association scans. Bioinformatics. 2010; 26:2190-2191. [DOI] [PMC free article] [PubMed] [Google Scholar]
- 23.Saxena R, Elbers CC, Guo Y, Peter I, Gaunt TR, Mega JL, Lanktree MB, Tare A, Castillo BA, Li YR, Johnson T, Bruinenberg M, Gilbert‐Diamond D, Rajagopalan R, Voight BF, Balasubramanyam A, Barnard J, Bauer F, Baumert J, Bhangale T, Böhm BO, Braund PS, Burton PR, Chandrupatla HR, Clarke R, Cooper‐DeHoff RM, Crook ED, Davey‐Smith G, Day IN, de Boer A, de Groot MC, Drenos F, Ferguson J, Fox CS, Furlong CE, Gibson Q, Gieger C, Gilhuijs‐Pederson LA, Glessner JT, Goel A, Gong Y, Grant SF, Grobbee DE, Hastie C, Humphries SE, Kim CE, Kivimaki M, Kleber M, Meisinger C, Kumari M, Langaee TY, Lawlor DA, Li M, Lobmeyer MT, Maitland‐van der Zee AH, Meijs MF, Molony CM, Morrow DA, Murugesan G, Musani SK, Nelson CP, Newhouse SJ, O'Connell JR, Padmanabhan S, Palmen J, Patel SR, Pepine CJ, Pettinger M, Price TS, Rafelt S, Ranchalis J, Rasheed A, Rosenthal E, Ruczinski I, Shah S, Shen H, Silbernagel G, Smith EN, Spijkerman AW, Stanton A, Steffes MW, Thorand B, Trip M, van der Harst P, van der A DL, van Iperen EP, van Setten J, van Vliet‐Ostaptchouk JV, Verweij N, Wolffenbuttel BH, Young T, Zafarmand MH, Zmuda JM, Boehnke M, Altshuler D, McCarthy M, Kao WH, Pankow JS, Cappola TP, Sever P, Poulter N, Caulfield M, Dominiczak A, Shields DC, Bhatt DL, Bhatt D, Zhang L, Curtis SP, Danesh J, Casas JP, van der Schouw YT, Onland‐Moret NC, Doevendans PA, Dorn GW, Farrall M, FitzGerald GA, Hamsten A, Hegele R, Hingorani AD, Hofker MH, Huggins GS, Illig T, Jarvik GP, Johnson JA, Klungel OH, Knowler WC, Koenig W, März W, Meigs JB, Melander O, Munroe PB, Mitchell BD, Bielinski SJ, Rader DJ, Reilly MP, Rich SS, Rotter JI, Saleheen D, Samani NJ, Schadt EE, Shuldiner AR, Silverstein R, Kottke‐Marchant K, Talmud PJ, Watkins H, Asselbergs FW, Asselbergs F, de Bakker PI, McCaffery J, Wijmenga C, Sabatine MS, Wilson JG, Reiner A, Bowden DW, Hakonarson H, Siscovick DS, Keating BJGroup LAR, consortium D. Large‐scale gene‐centric meta‐analysis across 39 studies identifies type 2 diabetes loci. Am J Hum Genet. 2012; 90:410-425. [DOI] [PMC free article] [PubMed] [Google Scholar]
- 24.Johnson JA, Boerwinkle E, Zineh I, Chapman AB, Bailey K, Cooper‐DeHoff RM, Gums J, Curry RW, Gong Y, Beitelshees AL, Schwartz G, Turner ST. Pharmacogenomics of antihypertensive drugs: rationale and design of the Pharmacogenomic Evaluation of Antihypertensive Responses (PEAR) study. Am Heart J. 2009; 157:442-449. [DOI] [PMC free article] [PubMed] [Google Scholar]
- 25.Livak KJ, Schmittgen TD. Analysis of relative gene expression data using real‐time quantitative PCR and the 2(‐Delta Delta C(T)) Method. Methods. 2001; 25:402-408. [DOI] [PubMed] [Google Scholar]
- 26.Ehret GB, Munroe PB, Rice KM, Bochud M, Johnson AD, Chasman DI, Smith AV, Tobin MD, Verwoert GC, Hwang SJ, Pihur V, Vollenweider P, O'Reilly PF, Amin N, Bragg‐Gresham JL, Teumer A, Glazer NL, Launer L, Zhao JH, Aulchenko Y, Heath S, Sõber S, Parsa A, Luan J, Arora P, Dehghan A, Zhang F, Lucas G, Hicks AA, Jackson AU, Peden JF, Tanaka T, Wild SH, Rudan I, Igl W, Milaneschi Y, Parker AN, Fava C, Chambers JC, Fox ER, Kumari M, Go MJ, van der Harst P, Kao WH, Sjögren M, Vinay DG, Alexander M, Tabara Y, Shaw‐Hawkins S, Whincup PH, Liu Y, Shi G, Kuusisto J, Tayo B, Seielstad M, Sim X, Nguyen KD, Lehtimäki T, Matullo G, Wu Y, Gaunt TR, Onland‐Moret NC, Cooper MN, Platou CG, Org E, Hardy R, Dahgam S, Palmen J, Vitart V, Braund PS, Kuznetsova T, Uiterwaal CS, Adeyemo A, Palmas W, Campbell H, Ludwig B, Tomaszewski M, Tzoulaki I, Palmer ND, Aspelund T, Garcia M, Chang YP, O'Connell JR, Steinle NI, Grobbee DE, Arking DE, Kardia SL, Morrison AC, Hernandez D, Najjar S, McArdle WL, Hadley D, Brown MJ, Connell JM, Hingorani AD, Day IN, Lawlor DA, Beilby JP, Lawrence RW, Clarke R, Hopewell JC, Ongen H, Dreisbach AW, Li Y, Young JH, Bis JC, Kähönen M, Viikari J, Adair LS, Lee NR, Chen MH, Olden M, Pattaro C, Bolton JA, Köttgen A, Bergmann S, Mooser V, Chaturvedi N, Frayling TM, Islam M, Jafar TH, Erdmann J, Kulkarni SR, Bornstein SR, Grässler J, Groop L, Voight BF, Kettunen J, Howard P, Taylor A, Guarrera S, Ricceri F, Emilsson V, Plump A, Barroso I, Khaw KT, Weder AB, Hunt SC, Sun YV, Bergman RN, Collins FS, Bonnycastle LL, Scott LJ, Stringham HM, Peltonen L, Perola M, Vartiainen E, Brand SM, Staessen JA, Wang TJ, Burton PR, Soler Artigas M, Dong Y, Snieder H, Wang X, Zhu H, Lohman KK, Rudock ME, Heckbert SR, Smith NL, Wiggins KL, Doumatey A, Shriner D, Veldre G, Viigimaa M, Kinra S, Prabhakaran D, Tripathy V, Langefeld CD, Rosengren A, Thelle DS, Corsi AM, Singleton A, Forrester T, Hilton G, McKenzie CA, Salako T, Iwai N, Kita Y, Ogihara T, Ohkubo T, Okamura T, Ueshima H, Umemura S, Eyheramendy S, Meitinger T, Wichmann HE, Cho YS, Kim HL, Lee JY, Scott J, Sehmi JS, Zhang W, Hedblad B, Nilsson P, Smith GD, Wong A, Narisu N, Stancáková A, Raffel LJ, Yao J, Kathiresan S, O'Donnell CJ, Schwartz SM, Ikram MA, Longstreth WT, Mosley TH, Seshadri S, Shrine NR, Wain LV, Morken MA, Swift AJ, Laitinen J, Prokopenko I, Zitting P, Cooper JA, Humphries SE, Danesh J, Rasheed A, Goel A, Hamsten A, Watkins H, Bakker SJ, van Gilst WH, Janipalli CS, Mani KR, Yajnik CS, Hofman A, Mattace‐Raso FU, Oostra BA, Demirkan A, Isaacs A, Rivadeneira F, Lakatta EG, Orru M, Scuteri A, Ala‐Korpela M, Kangas AJ, Lyytikäinen LP, Soininen P, Tukiainen T, Würtz P, Ong RT, Dörr M, Kroemer HK, Völker U, Völzke H, Galan P, Hercberg S, Lathrop M, Zelenika D, Deloukas P, Mangino M, Spector TD, Zhai G, Meschia JF, Nalls MA, Sharma P, Terzic J, Kumar MV, Denniff M, Zukowska‐Szczechowska E, Wagenknecht LE, Fowkes FG, Charchar FJ, Schwarz PE, Hayward C, Guo X, Rotimi C, Bots ML, Brand E, Samani NJ, Polasek O, Talmud PJ, Nyberg F, Kuh D, Laan M, Hveem K, Palmer LJ, van der Schouw YT, Casas JP, Mohlke KL, Vineis P, Raitakari O, Ganesh SK, Wong TY, Tai ES, Cooper RS, Laakso M, Rao DC, Harris TB, Morris RW, Dominiczak AF, Kivimaki M, Marmot MG, Miki T, Saleheen D, Chandak GR, Coresh J, Navis G, Salomaa V, Han BG, Zhu X, Kooner JS, Melander O, Ridker PM, Bandinelli S, Gyllensten UB, Wright AF, Wilson JF, Ferrucci L, Farrall M, Tuomilehto J, Pramstaller PP, Elosua R, Soranzo N, Sijbrands EJ, Altshuler D, Loos RJ, Shuldiner AR, Gieger C, Meneton P, Uitterlinden AG, Wareham NJ, Gudnason V, Rotter JI, Rettig R, Uda M, Strachan DP, Witteman JC, Hartikainen AL, Beckmann JS, Boerwinkle E, Vasan RS, Boehnke M, Larson MG, Järvelin MR, Psaty BM, Abecasis GR, Chakravarti A, Elliott P, van Duijn CM, Newton‐Cheh C, Levy D, Caulfield MJ, Johnson TStudies ICfBPG‐WA, Consortium C, Consortium C, Consortium K, Consortium E, Consortium C‐H. Genetic variants in novel pathways influence blood pressure and cardiovascular disease risk. Nature. 2011; 478:103-109. [DOI] [PMC free article] [PubMed] [Google Scholar]
- 27.Lu X, Wang L, Chen S, He L, Yang X, Shi Y, Cheng J, Zhang L, Gu CC, Huang J, Wu T, Ma Y, Li J, Cao J, Chen J, Ge D, Fan Z, Li Y, Zhao L, Li H, Zhou X, Chen L, Liu D, Duan X, Hao Y, Lu F, Liu Z, Yao C, Shen C, Pu X, Yu L, Fang X, Xu L, Mu J, Wu X, Zheng R, Wu N, Zhao Q, Liu X, Wang M, Yu D, Hu D, Ji X, Guo D, Sun D, Wang Q, Yang Y, Liu F, Mao Q, Liang X, Ji J, Chen P, Mo X, Li D, Chai G, Tang Y, Li X, Du Z, Dou C, Yang Z, Meng Q, Wang D, Wang R, Yang J, Schunkert H, Samani NJ, Kathiresan S, Reilly MP, Erdmann J, Peng X, Chen R, Qiang B, Gu DConsortium CADG‐WRAM‐AC. Genome‐wide association study in Han Chinese identifies four new susceptibility loci for coronary artery disease. Nat Genet. 2012; 44:890-894. [DOI] [PMC free article] [PubMed] [Google Scholar]
- 28.Carafoli E. Biogenesis: plasma membrane calcium ATPase: 15 years of work on the purified enzyme. FASEB J. 1994; 8:993-1002. [PubMed] [Google Scholar]
- 29.Monteith GR, Kable EP, Kuo TH, Roufogalis BD. Elevated plasma membrane and sarcoplasmic reticulum Ca2+ pump mRNA levels in cultured aortic smooth muscle cells from spontaneously hypertensive rats. Biochem Biophys Res Commun. 1997; 230:344-346. [DOI] [PubMed] [Google Scholar]
- 30.Kobayashi Y, Hirawa N, Tabara Y, Muraoka H, Fujita M, Miyazaki N, Fujiwara A, Ichikawa Y, Yamamoto Y, Ichihara N, Saka S, Wakui H, Yoshida S, Yatsu K, Toya Y, Yasuda G, Kohara K, Kita Y, Takei K, Goshima Y, Ishikawa Y, Ueshima H, Miki T, Umemura S. Mice lacking hypertension candidate gene ATP2B1 in vascular smooth muscle cells show significant blood pressure elevation. Hypertension. 2012; 59:854-860. [DOI] [PubMed] [Google Scholar]
- 31.Shin YB, Lim JE, Ji SM, Lee HJ, Park SY, Hong KW, Lim M, McCarthy MI, Lee YH, Oh B. Silencing of ATP2B1 increases blood pressure through vasoconstriction. J Hypertens. 2013; 31:1575-1583. [DOI] [PubMed] [Google Scholar]
- 32.Tsai FJ, Yang CF, Chen CC, Chuang LM, Lu CH, Chang CT, Wang TY, Chen RH, Shiu CF, Liu YM, Chang CC, Chen P, Chen CH, Fann CS, Chen YT, Wu JY. A genome‐wide association study identifies susceptibility variants for type 2 diabetes in Han Chinese. PLoS Genet. 2010; 6:e1000847. [DOI] [PMC free article] [PubMed] [Google Scholar]
- 33.Saade S, Cazier JB, Ghassibe‐Sabbagh M, Youhanna S, Badro DA, Kamatani Y, Hager J, Yeretzian JS, El‐Khazen G, Haber M, Salloum AK, Douaihy B, Othman R, Shasha N, Kabbani S, Bayeh HE, Chammas E, Farrall M, Gauguier D, Platt DE, Zalloua PAFGENtCARD consortium. Large scale association analysis identifies three susceptibility loci for coronary artery disease. PLoS One. 2011; 6:e29427. [DOI] [PMC free article] [PubMed] [Google Scholar]
- 34.Ellis JA, Lamantia A, Chavez R, Scurrah KJ, Nichols CG, Harrap SB. Genes controlling postural changes in blood pressure: comprehensive association analysis of ATP‐sensitive potassium channel genes KCNJ8 and ABCC9. Physiol Genomics. 2010; 40:184-188. [DOI] [PubMed] [Google Scholar]
- 35.Vasan RS, Glazer NL, Felix JF, Lieb W, Wild PS, Felix SB, Watzinger N, Larson MG, Smith NL, Dehghan A, Grosshennig A, Schillert A, Teumer A, Schmidt R, Kathiresan S, Lumley T, Aulchenko YS, König IR, Zeller T, Homuth G, Struchalin M, Aragam J, Bis JC, Rivadeneira F, Erdmann J, Schnabel RB, Dörr M, Zweiker R, Lind L, Rodeheffer RJ, Greiser KH, Levy D, Haritunians T, Deckers JW, Stritzke J, Lackner KJ, Völker U, Ingelsson E, Kullo I, Haerting J, O'Donnell CJ, Heckbert SR, Stricker BH, Ziegler A, Reffelmann T, Redfield MM, Werdan K, Mitchell GF, Rice K, Arnett DK, Hofman A, Gottdiener JS, Uitterlinden AG, Meitinger T, Blettner M, Friedrich N, Wang TJ, Psaty BM, van Duijn CM, Wichmann HE, Munzel TF, Kroemer HK, Benjamin EJ, Rotter JI, Witteman JC, Schunkert H, Schmidt H, Völzke H, Blankenberg S. Genetic variants associated with cardiac structure and function: a meta‐analysis and replication of genome‐wide association data. JAMA. 2009; 302:168-178. [DOI] [PMC free article] [PubMed] [Google Scholar]
- 36.Mackness MI, Mackness B, Durrington PN. Paraoxonase and coronary heart disease. Atherosclerosis Suppl. 2002; 3:49-55. [DOI] [PubMed] [Google Scholar]
- 37.Wang M, Lang X, Zou L, Huang S, Xu Z. Four genetic polymorphisms of paraoxonase gene and risk of coronary heart disease: a meta‐analysis based on 88 case–control studies. Atherosclerosis. 2011; 214:377-385. [DOI] [PubMed] [Google Scholar]
- 38.Wheeler JG, Keavney BD, Watkins H, Collins R, Danesh J. Four paraoxonase gene polymorphisms in 11212 cases of coronary heart disease and 12786 controls: meta‐analysis of 43 studies. Lancet. 2004; 363:689-695. [DOI] [PubMed] [Google Scholar]
- 39.Voetsch B, Benke KS, Damasceno BP, Siqueira LH, Loscalzo J. Paraoxonase 192 Gln–>Arg polymorphism: an independent risk factor for nonfatal arterial ischemic stroke among young adults. Stroke. 2002; 33:1459-1464. [DOI] [PubMed] [Google Scholar]
- 40.Topic E, Simundic AM, Ttefanovic M, Demarin V, Vukovic V, Lovrencic‐Huzjan A, Zuntar I. Polymorphism of apoprotein E (APOE), methylenetetrahydrofolate reductase (MTHFR) and paraoxonase (PON1) genes in patients with cerebrovascular disease. Clin Chem Lab Med. 2001; 39:346-350. [DOI] [PubMed] [Google Scholar]
- 41.Figueiredo VN, Yugar‐Toledo JC, Martins LC, Martins LB, de Faria AP, de Haro Moraes C, Sierra C, Coca A, Moreno H. Vascular stiffness and endothelial dysfunction: correlations at different levels of blood pressure. Blood Press. 2012; 21:31-38. [DOI] [PubMed] [Google Scholar]
- 42.Pabuccu T, Baris N, Ozpelit E, Akdeniz B, Guneri S. The relationship between resistant hypertension and arterial stiffness. Clin Exp Hypertens. 2012; 34:57-62. [DOI] [PubMed] [Google Scholar]
- 43.Lynch AI, Irvin MR, Davis BR, Ford CE, Eckfeldt JH, Arnett DK. Genetic and adverse health outcome associations with treatment resistant hypertension in GenHat. Int J Hypertens. 2013; 2013:578578. [DOI] [PMC free article] [PubMed] [Google Scholar]