

Abstract
Background
Accurate assessment of mechanical properties of the proximal aorta is a requisite first step for elucidating the pathophysiology of isolated systolic hypertension. During systole, substantial proximal aortic axial displacement produces longitudinal strain, which we hypothesize causes variable underestimation of ascending aortic circumferential strain compared to values in the longitudinally constrained descending aorta.
Methods and Results
To assess effects of longitudinal strain, we performed magnetic resonance imaging in 375 participants (72 to 94 years old, 204 women) in the Age, Gene/Environment Susceptibility‐Reykjavik Study and measured aortic circumferential and longitudinal strain. Circumferential ascending aortic area strain uncorrected for longitudinal strain was comparable in women and men (mean [95% CI], 8.3 [7.8, 8.9] versus 7.9 [7.4, 8.5]%, respectively, P=0.3). However, longitudinal strain was greater in women (8.5±2.5 versus 7.0±2.5%, P<0.001), resulting in greater longitudinally corrected circumferential ascending aortic strain (14.4 [13.6, 15.2] versus 13.0 [12.4, 13.7]%, P=0.010). Observed circumferential descending aortic strain, which did not require correction (women: 14.0 [13.2, 14.8], men: 12.4 [11.6, 13.2]%, P=0.005), was larger than uncorrected (P<0.001), but comparable to longitudinally corrected (P=0.12) circumferential ascending aortic strain. Carotid‐femoral pulse wave velocity did not correlate with uncorrected ascending aortic strain (R=−0.04, P=0.5), but was inversely related to longitudinally corrected ascending and observed descending aortic strain (R=−0.15, P=0.004; R=−0.36, P<0.001, respectively). Longitudinal strain was also inversely related to carotid‐femoral pulse wave velocity and other risk factors for higher aortic stiffness including treated hypertension.
Conclusions
Longitudinal strain creates substantial and variable errors in circumferential ascending aortic area strain measurements, particularly in women, and should be considered to avoid misclassification of ascending aortic stiffness.
Keywords: aortic stiffness, ascending aorta, carotid‐femoral pulse wave velocity, circumferential strain, longitudinal strain
Introduction
Hypertension is a cardiovascular disease risk factor that is present in 1 third of the adult population. Although 75% of patients with hypertension are under treatment, only 53% have their hypertension controlled.1 Isolated or predominant systolic hypertension represents the overwhelming phenotype of patients with persistently elevated blood pressure despite treatment.2 Proximal aortic stiffness and elevated pulse pressure are important contributors to systolic hypertension, particularly in middle‐aged and older people.3 The markedly increased prevalence of treatment‐resistant systolic hypertension has created an urgent public health mandate to identify interventions to prevent or mitigate proximal aortic stiffening. Accurate measurement of the mechanical properties of the proximal aorta represents a requisite first step in the development of effective interventions.
Local aortic stiffness is often evaluated by measuring lumen area strain. However, the sinotubular junction (STJ) can be displaced a substantial distance along the long axis of the aorta during systole,4–5 which produces longitudinal strain. Since the aortic wall is essentially incompressible under physiologic conditions,6 longitudinal strain produces proportional negative radial and circumferential strains.7–8 We hypothesized that longitudinal strain in the proximal ascending aorta confounds circumferential area measurements and results in marked and variable underestimation of strain and overestimation of stiffness, particularly in older cohorts where circumferential strains are small.9–10 To test this hypothesis, we examined longitudinal strain in the proximal aorta, and circumferential strains in the proximal ascending and descending thoracic aorta during the cardiac cycle in a community‐based sample of older men and women.
Methods
Participants
Participant selection criteria and design of the original Age, Gene/Environment Susceptibility—Reykjavik Study (AGES‐Reykjavik) have been presented in detail.11 During a second AGES‐Reykjavik examination (AGES‐II, n=3411), conducted from 2008 to 2011, a random subset of 633 participants was recruited to participate in a comprehensive magnetic resonance imaging (MRI) study on aortic structure and function.12 This study was approved by the National Bioethics Committee in Iceland and the National Institute on Aging Intramural Institutional Review Board. All participants gave their informed written consent.
Tonometry Data Acquisition
Participants were studied supine after 10 minutes of rest. Auscultatory blood pressure was obtained with a semiautomated computer‐controlled device. Arterial tonometry and simultaneous electrocardiography were obtained from the brachial, femoral, and carotid arteries with a custom transducer (Cardiovascular Engineering, Inc, Norwood, MA). Body surface measurements were assessed from suprasternal notch to brachial, femoral, and carotid recording sites.
MRI Acquisition
MRI was performed using an 8‐channel torso coil in a 1.5 Tesla MRI Scanner (Signa Excite; General Electric Medical Systems, Waukesha, WI). Three localizers were taken in the coronal, sagittal, and axial planes using fast imaging employing steady‐state acquisition (FIESTA) sequences. A fourth localizer was taken in the sagittal plane using fast gradient recalled echo of the entire cervical and thoracic spine. Two orthogonal cine FIESTA localizers of the proximal aorta were taken: a cardiac 3‐chamber image was obtained using the coronal plane localizer, and an oblique coronal image of the proximal aorta was obtained using the cardiac 3‐chamber localizer. Cross‐sectional cine FIESTA and phase contrast images were acquired at 2 levels in the thoracic aorta, orthogonal to the local long axis of the aorta at each level. The first image plane was prescribed in the ascending aorta ≈1 cm distal to the location of the STJ after a minimal (10 ms) trigger delay. The second image plane was prescribed in the descending aorta at the level of the intersection of the ascending aorta image plane with the proximal descending aorta.
The spine image was taken with a repetition time of 70 ms, echo time of 1.5 ms, and 6‐mm slice thickness with 13 slices per acquisition. The imaging matrix was 256 × 192 with a reconstruction matrix of 512 × 512 and an average pixel size of 0.94 mm. The oblique coronal image of the aorta was obtained with a repetition time of 3.2 ms, echo time of 1.4 ms, and 8‐mm slice thickness with 30 phases per cardiac cycle. The imaging matrix was 224 × 224 with a reconstruction matrix of 256 × 256 and an average pixel size of 1.41 mm.
The FIESTA cross‐sectional images were taken with a repetition time of 4.3 ms, echo time of 1.9 ms, and 6‐mm slice thickness with 30 phases per cardiac cycle. Early in the study, images were obtained using 256 × 256 imaging and reconstruction matrices in all participants. The imaging matrix was later adjusted to 352 × 352 (reconstruction matrix 512 × 512) for all participants who were able to hold their breath long enough to obtain the higher resolution sequence. Average pixel size was 0.66 mm for the 512 × 512 images and 1.33 mm for the 256 × 256 images. The phase contrast cross‐sectional images were acquired using through‐plane head‐to‐foot 150 cm/s velocity encoding with a repetition time of 5.7 ms, echo time of 2.8 ms, and 6‐mm slice thickness with at least 100 phases per cardiac cycle. The imaging matrix was 256 × 192 with a reconstruction matrix of 256 × 256 and an average pixel size of 0.66 mm. All FIESTA acquisitions were obtained during 1 breath‐hold and all multiphase acquisitions were taken using ECG triggering.
Tonometry Data Analysis
All data were transferred to the core laboratory (Cardiovascular Engineering, Inc) for analysis by trained analyzers who were blinded to clinical characteristics of the participants.
Blood pressures were over‐read in the core laboratory. Systolic and diastolic cuff pressures were used to calibrate the peak and trough of the signal‐averaged brachial pressure waveform. Diastolic and integrated mean brachial pressures were then used to calibrate carotid waveforms. Carotid‐femoral pulse wave velocity (CFPWV) was calculated from tonometry waveforms, and body surface measurements corrected for parallel transmission as described previously.13
MRI Data Analysis
Images were analyzed using ImageJ version 1.44p (32‐bit; National Institutes of Health, Bethesda, MD) with custom macros and plugins. The oblique coronal images were used for displacement, diameter, and length measurements of the proximal aorta. An ImageJ default threshold was applied to create a contour around the aortic cusps and proximal ascending aorta. This contour was manually edited as required to remove coronary arteries and bridging into the pulmonary artery and other adjacent structures. A centerline along the length of the proximal aorta was constructed by creating an array of coordinates midway between closest points on the opposite edges of the aortic contour. These midpoints were interpolated and smoothed, and 21 diameter chords perpendicular to the final centerline were created starting from the STJ and moving distally along the centerline in 1‐mm increments. The STJ was initially identified by a user‐drawn chord and was then adjusted as needed to represent the shortest chord within 2 mm of the user‐defined STJ line. Ten additional chords were created perpendicular to the centerline, starting from a user‐defined line across the aortic annulus and moving through the aortic cusps toward the STJ at evenly spaced increments. Any intersecting chords were redrawn to be evenly spaced between neighboring lines, with the exception of the STJ and annulus. Figure 1A shows the results of centerline and chord construction in the cusps and proximal ascending aorta during end‐diastole. A linear diameter gradient was calculated as the slope of aortic diameters between the STJ and 20 mm distal to the STJ to characterize the observed widening ascending aorta (Figure 2A and 2B). Displacement of the STJ and aortic annulus, and cusp lengthening were measured along the centerline of the proximal aorta. These measurements were obtained for 30 evenly spaced phases of the cardiac cycle (cardiac phases), each representing 1/30th of the RR interval (Figure 2C and 2D). Figure 1B shows the end‐systolic image with the systolic and diastolic aortic contours overlaid in order to illustrate typical systolic movement of the proximal aorta.
Figure 1.
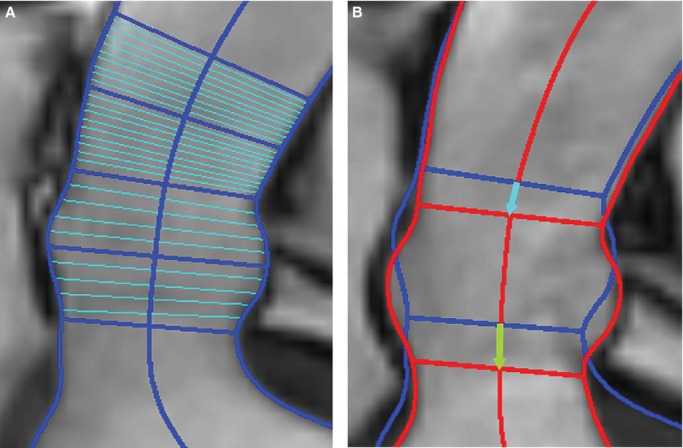
Oblique coronal image of the proximal ascending aorta and aortic cusps. A, Diastole. Aortic contours, the calculated centerline, and diameter chords at the aortic annulus, middle of the aortic cusps, sinotubular junction (STJ), 10 mm distal to the STJ, and 20 mm distal to the STJ are shown in dark blue. Evenly spaced diameter chords between the 5 landmark chords are shown in light blue. B, Systole. Systolic contours are shown in red and diastolic contours in blue. Lines for the STJ and aortic annulus are drawn along with arrows displaying the long axis displacement of the STJ (blue) and annulus (green) between diastole and systole.
Figure 2.
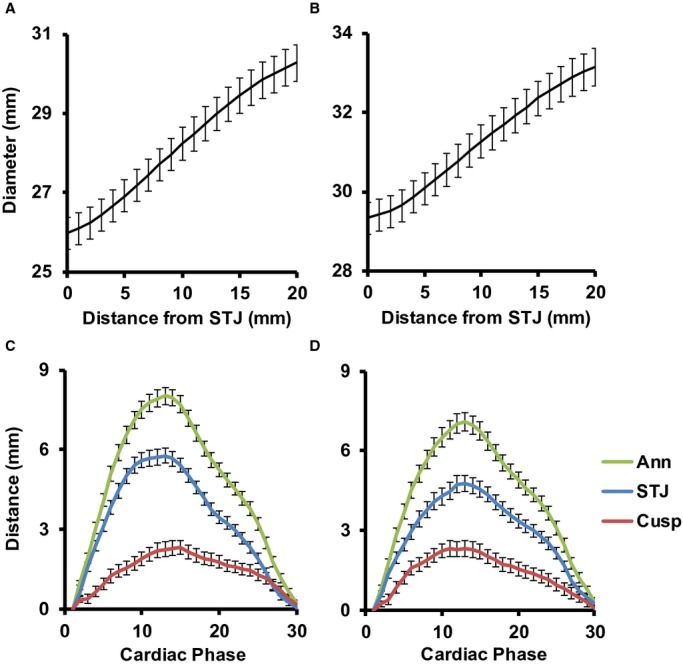
Proximal aortic measurements for women (left) and men (right). A and B, Observed diameters at end‐diastole along the proximal ascending aorta from the sinotubular junction (STJ) to 20 mm away from the STJ. C and D, Long axis measurements during 30 image acquisitions that were evenly spaced throughout the cardiac cycle. STJ and aortic annulus (Ann) displacements were based on movement of the midpoint of the STJ and annulus chords, respectively, along the local aortic centerline between each of the imaging phases. Incremental displacements at each phase were summed to get total displacement relative to the initial location. The distance between the STJ and annulus, 2 discrete anatomical landmarks, increased during systole, indicating that there was lengthening of the aortic cusps (Cusp) during systole. As a result, the maximum displacement of the annulus was greater than that of the STJ. Values represent means and 95% CI.
Cross‐sectional FIESTA images of the ascending and descending aorta were analyzed to extract time‐resolved area waveforms. An ImageJ threshold was applied for auto‐edge detection of the aortic lumen for all phases, which were manually edited if necessary. As previously described and validated, measured maximum and minimum area were highly reproducible when analyzed by different observers using different software (area maximum: R=0.99, coefficient of variation=3.1%; area minimum: R=0.99, coefficient of variation=3.6%).12 Observed ascending aortic area waveforms were corrected for the known effects of proximal through‐plane movement and diameter nonuniformity prior to analysis.4,14 Because of the distally increasing diameter gradient (Figure 2A and 2B), displacement of the STJ toward the heart (Figure 2C and 2D) caused a wider section of the aorta to move into the image plane during acquisition, which resulted in an overestimation of circumferential area (Figure 3A).
Figure 3.
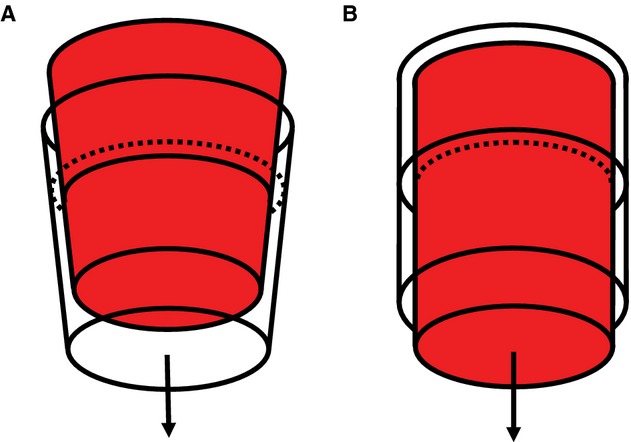
Idealized schematics of aortic strain confounders. A, The idealized aorta exhibits a positive taper similar to what was observed in this cohort and is displaced toward the heart under a constant pressure. The red cone represents the aorta at its initial location at end‐diastole and the clear cone represents the displaced aorta during systole. The cross‐sectional lumen area in the orthogonal image plane (dotted line) would appear larger even though the aorta (solid line) is unchanged. B, If an idealized aorta is stretched to 110% of its original length, its diameter will decrease by 5% under a constant pressure. The transparent cylinder represents the original aortic lumen dimensions, and the red cylinder represents the stretched aortic lumen dimensions. The dotted line represents the observed lumen area after stretching the original cylinder (solid line) longitudinally.
The oblique coronal images were used to correct ascending aorta area waveforms for the effects of aortic through‐plane motion. The product of the linear diameter gradient and the component of STJ movement parallel to the centerline represents the through‐plane diameter error (TPDE), which is the extent in millimeters to which the diameter was overestimated for each cardiac phase. The observed diameter (DObs) of the ascending aorta area waveform was computed assuming circular geometry and was corrected as follows:
where DTPC is the through‐plane corrected diameter. Diameters were corrected at each phase of the image sequence and then converted back into an area to generate a through‐plane corrected ascending aorta area waveform that was used for subsequent analysis. A random sample of 11 cases was used to check interobserver reproducibility of the TPDE for all 30 phases. The resulting 330 paired data points were highly reproducible (R2=0.91, Figure 4).
Figure 4.
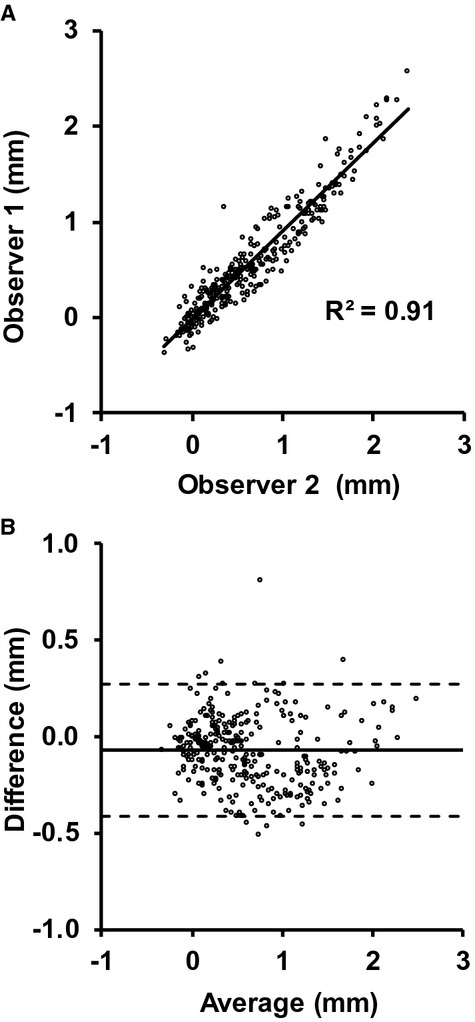
Scatter plot (A) and Bland–Altman plot (B) of the through‐plane diameter error for observer 1 and observer 2. The solid line in (B) represents the mean difference, and the 2 dotted lines represent the mean±2 SD. For reference, the average observed peak diameter in these cases was 33.2±3.7 mm.
All 31 diameter chords from the annulus to 20 mm distal to the STJ were corrected for out‐of‐plane foreshortening at each phase prior to measurement of the diameter gradient. Lateral movement of the aorta through the oblique coronal image plane during acquisition caused observed aortic diameters to vary, depending on the distance between the center of the aortic lumen and the oblique coronal image plane. A line representing the oblique coronal plane intersection with the cross‐sectional ascending aorta image was projected onto the aortic lumen for correction. A best‐fit ellipse was applied to the edge‐detected ascending aorta lumen border, and the ratio of the ellipse‐enclosed lengths of the oblique coronal plane line and a parallel line through the centroid of the ellipse was calculated (Figure 5). This ratio was also calculated for a second cross‐sectional ascending aortic image prescribed closer to the STJ. The additional cross‐sectional image had the same acquisition parameters as the cross‐sectional images used for area analysis, and was only used for creating a more robust correction ratio. The average of the 2 ratios was used for out‐of‐plane correction (OPC) using the following equation:
where DObs is the observed oblique coronal diameter, CorL is the ellipse‐enclosed length of the oblique coronal plane line, MidL is the ellipse‐enclosed length of the midlumen line parallel to CorL, subscripts Image1 and Image2 represent which ascending aorta image the lengths came from, and DOPC is the out‐of‐plane corrected diameter.
Figure 5.
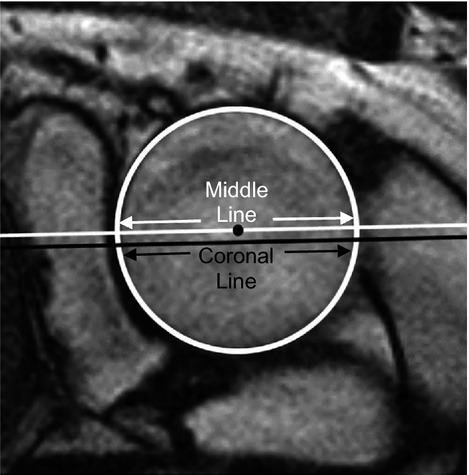
A best‐fit ellipse around the aortic lumen is displayed in white. The intersection of the oblique coronal plane with the cross‐sectional aorta image plane is shown in black. The middle line shown in white is parallel to the oblique coronal plane and passes through the centroid of the aortic lumen.
Dynamic aortic arch width was calculated as the 3‐dimensional distance between centroids of the ascending and descending aortic lumen (Figure 6). The length of the ascending aorta was calculated as the distance between the STJ and brachiocephalic artery measured from the ascending aorta, spine, and oblique coronal images. The ascending aorta image plane was projected onto the spine image. A polyline was then drawn by the analyzer along the center of the aorta from the ascending aorta plane to the origin of the brachiocephalic artery. The ascending aorta image plane was also projected onto the oblique coronal image, and the distance between the STJ and the ascending aorta plane along the centerline of the aorta was calculated. This distance was combined with the spine image distance to calculate the total distance between the STJ and brachiocephalic artery.
Figure 6.
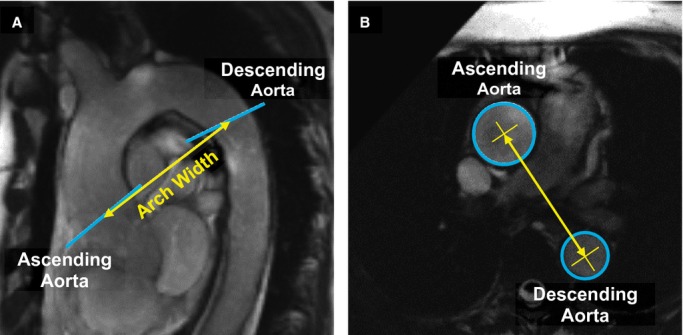
A, Sagittal oblique image of the thoracic aorta. Image planes for the ascending aorta and descending aorta are noted by blue lines. Aortic arch width (yellow line) was measured from ascending and descending aorta image planes. B, Cross‐sectional FIESTA of the ascending and descending aorta. Aortic arch width was calculated as the 3‐dimensional distance between centroids (yellow X) in the ascending and descending aorta lumen (blue circles). Lumen and centroids for the ascending and descending aorta were measured on different image planes, each orthogonal to the local aortic segment, but are shown on a single image here for clarity. FIESTA indicates fast imaging employing steady‐state acquisition.
Calculations
Longitudinal strain in the proximal ascending aorta was assumed to be uniformly and instantaneously distributed along the full length of the ascending aorta from the STJ to the brachiocephalic origin, which was assumed to be stationary.5 Longitudinal strain was calculated for each cardiac phase by dividing the cumulative STJ displacement along the centerline by the end‐diastolic length of the ascending aorta. Longitudinal strain of the aortic cusps was calculated by dividing maximum change in cusp length by the minimum cusp length. Cusp length was measured along the centerline between the STJ and aortic annulus diameter chords.
A Poisson's ratio of 0.5 was used to adjust circumferential area for longitudinal strain in the ascending aorta, based on the assumption of an incompressible isotropic material.8,15 To compensate for negative circumferential strain attributable to the longitudinal strain, at each phase of the image sequence aortic lumen area was multiplied by the cumulative longitudinal stretch ratio (where stretch ratio is 1+strain) at that point in time. The resulting correction is equivalent to adding half of the longitudinal strain to the circumferential diameter strain, as implied by a Poisson's ratio of 0.5 in an isotropic material (Figure 3B).
Circumferential strains were calculated as (Amax−Amin)/Amin, where Amax and Amin are maximum and minimum areas, respectively, during the cardiac cycle. Local Bramwell–Hill PWV (BHPWV) was calculated as the square root of the product of central pulse pressure and the inverse of circumferential strain and the density of blood,16 which was assumed to be 1.06 g/cm3. Circumferential area strain and BHPWV in the proximal ascending aorta were calculated from area waveforms that were corrected for through‐plane motion only and from area waveforms that were fully corrected for both through‐plane motion and longitudinal strain. Circumferential strain and BHPWV in the descending aorta were calculated from raw uncorrected lumen area waveforms.
Statistical Analyses
Circumferential area strains were skewed and therefore square root transformed to normalize the distribution. End‐diastolic aortic cusp length, longitudinal cusp strain, aortic arch width, peripheral pulse pressure, central pulse pressure, height, body mass index, heart rate, CFPWV, BHPWV, fasting glucose, high‐density lipoprotein cholesterol, and triglycerides were skewed and therefore transformed using natural logarithms to normalize the distribution. Relations between strains, BHPWV, and risk factors were evaluated using partial correlation adjusted for age, sex, and mean arterial pressure. Aortic strains were compared by using a repeated‐measures analysis of variance with method or location as a repeated measure and sex as a between‐subject factor. All continuous variables used in linear regression models were sex‐specific z‐scores. Values are presented as mean±SD unless stated otherwise. A 2‐tailed P<0.05 was considered significant.
Results
Of the 633 original volunteers, 602 were able to participate in the MRI examination and had image data acquired. Of these cases, 81 had unusable hemodynamic information, 66 had unusable oblique coronal images of the aorta, 60 had unusable cross‐sectional images of the ascending aorta, 16 had unusable cross‐sectional images of the descending aorta, and 4 were removed due to valve replacement or known dilation of the proximal aorta, leaving 375 cases with complete information for the present analysis. In addition, 3 cases were excluded for analyses that included hemoglobin A1c (N=372). The excluded cases were comparable to included cases except for a modestly higher heart rate and a higher prevalence of cardiovascular disease (Table 1). Many of the study participants in this older sample had high systolic and pulse pressure and 71% were treated for hypertension. Despite a high prevalence of treatment, average systolic blood pressure remained in the hypertensive range.
Table 1.
Participant Characteristics
| Variables | Included | Excluded | P Value |
|---|---|---|---|
| Sample size | 375 | 227 | |
| Women, n (%) | 204 (54) | 135 (59) | 0.2 |
| Age, y | 72 to 94 | 72 to 97 | 0.1 |
| Height, cm | 169±9 | 168±10 | 0.2 |
| Weight, kg | 77±14 | 77±14 | 0.6 |
| Body surface area, m2 | 1.87±0.20 | 1.87±0.20 | 0.9 |
| Body mass index, kg/m2 | 26.8±4.0 | 27.4±4.3 | 0.1 |
| Heart rate, min−1 | 63±10 | 65±11 | 0.046 |
| Blood pressure, mm Hg | |||
| Systolic | 141±19 | 143±21 | 0.2 |
| Diastolic | 64±9 | 65±11 | 0.1 |
| Mean | 94±11 | 96±13 | 0.051 |
| Peripheral pulse pressure | 77±18 | 78±19 | 0.7 |
| Central pulse pressure | 78±24 | 79±26 | 0.6 |
| Carotid‐femoral PWV, m/s | 13.5±4.7 | 13.8±5.0 | 0.5 |
| Glucose, mmol/L | 5.6±0.8 | 5.6±0.9 | 0.5 |
| HbA1c, %* | 5.7±0.5 | 5.7±0.6 | 0.2 |
| Total cholesterol, mmol/L | 5.3±1.1 | 5.3±1.2 | 0.7 |
| HDL cholesterol, mmol/L | 1.6±0.5 | 1.6±0.4 | 0.4 |
| Triglycerides, mmol/L | 1.2±0.5 | 1.1±0.5 | 0.4 |
| Medical history, n (%) | |||
| Diabetes | 39 (10) | 21 (9) | 0.6 |
| Treated hypertension | 267 (71) | 175 (77) | 0.1 |
| Statin use | 148 (39) | 90 (40) | 1.0 |
| Cardiovascular disease | 79 (21) | 76 (33) | 0.001 |
| Current smoker | 24 (6) | 20 (9) | 0.3 |
HbA1c indicates hemoglobin A1c; HDL, high‐density lipoprotein; PWV, pulse wave velocity.
372 cases.
Aortic displacement, length, strain, and BHPWV values are summarized by sex in Table 2. Women had shorter aortas, a larger diameter gradient, greater displacement, and greater longitudinal strain. The change in aortic arch width between diastole and the time of peak STJ displacement was comparable between sexes and was a small percentage of the total arch width (0.81±2.7% in women and 0.68±2.8% in men). Circumferential ascending aortic strains that were corrected for through‐plane motion only were comparable between sexes, while longitudinally corrected ascending aortic strains and observed descending aortic strains were larger in women. BHPWV calculated in the ascending aorta with and without longitudinal correction and in the descending aorta were comparable between women and men.
Table 2.
Aortic Dimensions, Strains, and Pulse Wave Velocities
| Variables | Women | Men | P Value |
|---|---|---|---|
| End‐diastolic length, mm | |||
| Ascending aorta | 79 (74, 87) | 86 (80, 93) | <0.001 |
| Aortic cusps | 18 (16, 20) | 20 (19, 22) | <0.001 |
| End‐diastolic diameter gradient | 0.23 (0.17, 0.29) | 0.20 (0.14, 0.27) | 0.015 |
| Displacement, mm | |||
| STJ | 6.7 (5.6, 8.1) | 5.8 (4.5, 7.0) | <0.001 |
| Annulus | 8.8 (7.3, 10.2) | 8.1 (6.8, 9.6) | 0.001 |
| Cusp length change, mm | 3.9 (2.9, 5.0) | 4.1 (3.1, 5.1) | 0.2 |
| Longitudinal strain, % | |||
| Ascending aorta | 8.5 (6.9, 10.3) | 6.7 (5.1, 8.2) | <0.001 |
| Aortic cusps | 22 (17, 32) | 21 (15, 26) | 0.017 |
| Aortic arch width, mm | 93 (86, 100) | 101 (92, 109) | <0.001 |
| Arch width change, mm | 0.4 (−0.5, 2.1) | 0.4 (−0.7, 2.1) | 0.7 |
| Circumferential area strain, % | |||
| Ascending aorta (through‐plane) | 8.1 (5.7, 10.9) | 7.9 (5.8, 10.4) | 0.3 |
| Ascending aorta (full correction) | 13.8 (11.1, 18.2) | 12.7 (10.4, 15.7) | 0.010 |
| Descending aorta | 13.7 (9.8, 18.1) | 12.2 (9.7, 15.8) | 0.005 |
| Bramwell–Hill pulse wave velocity, m/s | |||
| Ascending aorta (through‐plane) | 11.1 (9.2, 13.3) | 10.5 (8.9, 12.6) | 0.1 |
| Ascending aorta (full correction) | 8.3 (7.1, 9.8) | 8.1 (7.2, 9.3) | 0.4 |
| Descending aorta | 8.6 (7.1, 10.2) | 8.4 (7.3, 9.9) | 0.9 |
All displacements, changes in length, and strains represent maximum minus minimum values with the exception of aortic arch width change, which is the change between end‐diastole and time of STJ max displacement. Aortic arch width represents the end‐diastolic value. Through‐plane refers to through‐plane correction of circumferential area. Full correction refers to through‐plane and longitudinal strain correction of circumferential area. Values represent median (25th, 75th percentiles). Sex comparisons were performed using an independent‐samples t test with sex as the grouping variable. STJ indicates sinotubular junction.
Circumferential aortic strain values are presented in Figure 7. Ascending aortic strain that was corrected for through‐plane motion only was markedly smaller than strain in the descending aorta. In contrast, after correcting for longitudinal strain, the resulting ascending aortic strain was ≈80% larger than its through‐plane corrected counterpart and was comparable to strain in the descending aorta. In addition, longitudinal strain correction had a highly variable effect on circumferential area strain. The correlation between longitudinally corrected and uncorrected ascending aortic strain was moderate (R=0.75, P<0.001), suggesting that approximately half of the variance in the corrected value was attributable to the correction factor.
Figure 7.
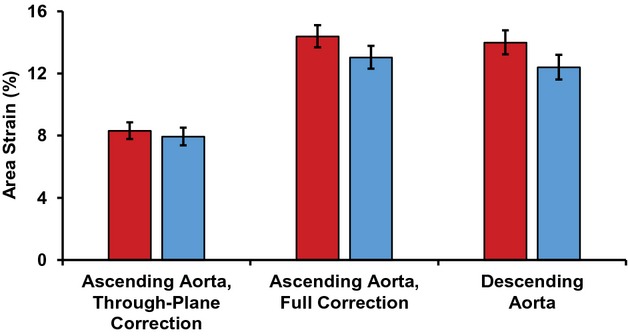
Lumen area strain of the ascending and descending aorta for women (red) and men (blue). Through‐plane correction refers to circumferential ascending aortic strain that has been corrected for through‐plane motion only; full correction refers to circumferential ascending aortic strain that has been corrected for through‐plane motion and longitudinal strain; and descending aorta refers to circumferential strain in the descending aorta. Through‐plane corrected strain was significantly smaller than longitudinally corrected strain (P<0.001), with no sex difference (P=0.058), although there was a sex interaction (P=0.019) because of a greater longitudinal strain correction in women. Through‐plane corrected strain was also markedly less than descending aortic strain (P<0.001), with a significant sex difference (P=0.012), but no sex interaction (P=0.10). In contrast, longitudinally corrected strain was comparable to descending aortic strain (P=0.12), with a strong sex difference (P=0.001) and no sex interaction (P=0.7). Strains were square root transformed for statistical analyses and results were squared for presentation. Error bars represent 95% CI.
Table 3 presents partial correlations of local stiffness measures with CFPWV adjusted for age, sex, and mean arterial pressure. Correlations are presented for circumferential area strain and BHPWV in the ascending aorta, first with through‐plane correction only and then with full through‐plane and longitudinal strain correction, and in the descending aorta. Ascending aortic stiffness measures that were corrected for through‐plane motion only did not correlate with CFPWV, whereas fully corrected measures did (Table 3). Descending aortic stiffness measures had a stronger correlation with CFPWV than fully corrected ascending aortic measures, whether assessed as area strain (P=0.002) or BHPWV (P=0.014).
Table 3.
Partial Correlations With Carotid‐Femoral Pulse Wave Velocity
| Location | Circumferential Strain | BHPWV | ||
|---|---|---|---|---|
| R | P Value | R | P Value | |
| Ascending aorta with through‐plane correction | −0.04 | 0.5 | 0.06 | 0.2 |
| Ascending aorta with full correction | −0.15 | 0.004 | 0.15 | 0.005 |
| Descending aorta | −0.36 | <0.001 | 0.32 | <0.001 |
Partial correlations with carotid‐femoral pulse wave velocity adjusting for age, sex, and mean arterial pressure. Through‐plane correction refers to ascending aortic values that have been corrected for through‐plane motion only and full correction refers to ascending aortic values that have been corrected for through‐plane motion and longitudinal strain. BHPWV indicates Bramwell–Hill pulse wave velocity.
We next examined age‐, sex‐, and mean arterial pressure–adjusted partial correlations of participant characteristics from Table 1 with longitudinal strain in the ascending aorta. Longitudinal strain was negatively associated with height (R=−0.15, P=0.005), weight (R=−0.19, P<0.001), body mass index (R=−0.12, P=0.018), heart rate (R=−0.16, P=0.002), CFPWV (R=−0.27, P<0.001), fasting glucose (R=−0.14, P=0.007), and hemoglobin A1c (R=−0.14, P=0.009). Ascending aortic longitudinal strain was also lower in participants with treated hypertension (7.5 [7.2, 7.8] versus 8.4 [8.0, 8.9], P=0.001) and diabetes (6.8 [6.1, 7.6] versus 7.9 [7.6, 8.2], P=0.012) in models that included age, sex, and mean arterial pressure. We then performed a multivariable linear regression model of longitudinal strain that entered age, sex, and mean arterial pressure and offered significant variables from the foregoing partial correlations for stepwise entry. CFPWV entered first (B=−0.58±0.14% per SD, P<0.001), followed by treated hypertension (B=−0.95±0.28% per SD, P=0.001), and then heart rate (B=−0.30±0.13% per SD, P=0.021).
Discussion
This study evaluated relations between longitudinal and circumferential strains in the proximal aorta and demonstrated that longitudinal movement of the STJ resulted in longitudinal ascending aortic strain that substantially limited circumferential dilation during systole. As a result, stiffness of the proximal ascending aorta calculated from circumferential strain that was corrected for through‐plane motion only was markedly and variably overestimated. Additionally, longitudinal strain of the proximal ascending aorta was inversely and independently related to CFPWV and other cardiovascular disease risk factors, such as heart rate and treated hypertension, suggesting that reduced longitudinal strain represents a novel imaging biomarker of increased aortic stiffness.
The presence and implications of ascending aortic longitudinal strain is supported by previous observations of substantial axial STJ displacement, minimal aortic movement at the level of the brachiocephalic artery, and aortic incompressibility.4–6 The correction for longitudinal strain was quite large, resulting in an 80% difference between corrected and uncorrected circumferential area strain. Longitudinal strain correction was also highly variable and therefore does not represent a simple scalar change in circumferential area strain values as evidenced by the moderate correlation between uncorrected and corrected area strain. Ascending aortic area strain and BHPWV were only correlated with CFPWV, an accepted measure of aortic stiffness, after correction for the effects of longitudinal strain. Therefore, longitudinally corrected circumferential ascending aortic strain should be used in place of uncorrected circumferential strain for accurate and clinically relevant proximal aortic strain measurements.
Our values for traditionally measured circumferential ascending aortic area strain, uncorrected for longitudinal strain, and for descending aortic area strain were comparable to those reported in similarly aged studies that found reversal of the normal proximal‐to‐distal aortic stiffness gradient.9–10 The observation of markedly higher stiffness in the ascending as compared to the descending aorta, which is only a dozen centimeters downstream,17 is not supported by studies of regional transit time PWV, which found a persistent positive stiffness gradient moving distally along the aorta in older people.18 After adjusting for longitudinal strain, circumferential strain in the ascending aorta was comparable to strain in the descending aorta, which suggests that with age, proximal ascending aortic stiffness approaches but does not exceed descending aortic stiffness.
Longitudinal strain was greater in women due to greater proximal aortic displacement and shorter ascending aortas, resulting in greater longitudinal correction of circumferential ascending aortic strain in women. As a result, circumferential ascending aortic strains that ignored the effects of longitudinal strain were comparable between sexes, whereas longitudinally corrected circumferential strains were greater in women as compared to men. Thus, failure to account for the effects of longitudinal strain resulted in greater underestimation of circumferential strain and overestimation of proximal aortic stiffness in women.
Limitations
All participants were over 70 years old and of white European descent, so results may not be generalizable to other age groups and ethnicities. For logistical reasons, tonometry was performed just prior to MRI. However, to limit change in hemodynamics, tonometry was performed on a detachable gurney just outside the MRI room immediately before MRI acquisition. Participants were then rolled directly into the room for imaging, with no change in posture between tonometry and MRI. Several types of acquisitions were needed for this study, making the final sample size sensitive to acquisition issues. For example, oblique coronal images were initially acquired as localizers without the intention of quantitative analysis and therefore were not repeated at the time of acquisition if there were minor deficiencies that did not interfere with image localization; in some cases these deficiencies did, however, obviate quantitative analysis. To measure CFPWV, we used a traditional approach that relates to clinical events.19 However, alternative approaches should be considered when comparing values across studies.20–21 Correlations of CFPWV with circumferential area strains and BHPWV in the ascending and proximal descending thoracic aorta were modest. Reduced correlation is partly attributable to the dependence of CFPWV on the stiffness properties of the distal thoracic and abdominal aorta and iliac and femoral arteries.
Our STJ‐to‐brachiocephalic distance is slightly longer than values reported for a younger cohort,22 which may be attributable to elongation of the aorta with age.17 Our interpretation of STJ motion as strain could be affected by modest displacement of the aorta at the brachiocephalic trunk5 or change in arch geometry. However, aortic arch width did not change between diastole and the time of maximum STJ displacement, and our calculation of longitudinal strain only considered motion along the long axis (centerline) of the aorta. Additionally, no assumptions were made in the assessment of longitudinal aortic cusp strain, which was considerable and measured between 2 defined landmarks (Figure 2, Table 2). We assumed the aortic wall was incompressible with a Poisson ratio of 0.5 and negligible shear strains, which are standard assumptions that have been validated in prior work.6,8,23 A smaller longitudinal‐circumferential Poisson ratio, which would result in a smaller strain correction, has been observed in animal studies; however, those studies evaluated an in situ segment of the highly constrained and therefore highly anisotropic descending thoracic aorta.24 We also assumed the proximal aorta is isotropic, consistent with biaxial studies of ascending aortic tissue from older people that did not find a significant difference between circumferential and longitudinal compliance.25–26
We were unable to measure longitudinal strain in the descending aorta and assumed it was negligible due to small reported displacement and strain values.5,27 Ascending aortic rotation was also assumed to be negligible due to modest reported effects on strain.28 In future studies, 3‐dimensional dynamic MRI or computed tomography would simplify corrections and minimize geometric and anatomical assumptions that were required in the present study, but would also increase acquisition time and limit the number of phases per cardiac cycle.27,29 Additionally, tissue tagging may help to refine estimates of longitudinal strain in the proximal aorta. Strengths of our study are the large, community‐based sample of well‐characterized participants undergoing extensive hemodynamic and MRI assessment of aortic structure and function.
Conclusions
Hypertension is a major cardiovascular disease risk factor that is highly prevalent in older people. The underlying contributors to wide pulse pressure hypertension, including proximal aortic stiffness, must be fully understood to improve treatment in older people.1 Proximal aortic stiffness is variably overestimated when measured using circumferential aortic strain assessed from cross‐sectional images because of the latent effects of longitudinal strain. In our older cohort, overestimation of proximal aortic stiffness was greater in women, who exhibited larger longitudinal strains. We have described a novel method to incorporate longitudinal strain into the calculation of circumferential strain in order to obtain a more robust assessment of stiffness in the critical proximal aorta. In addition, observed relations between longitudinal strain and various cardiovascular disease risk factors suggest that longitudinal strain may represent a novel measure of aortic function.
Sources of Funding
This work was supported by the National Institutes of Health (contract N01‐AG‐12100); the National Institute on Aging Intramural Research Program; Hjartavernd (the Icelandic Heart Association); the Althingi (the Icelandic Parliament); and a grant from the National Institutes of Health, National Heart, Lung and Blood Institute [HL094898].
Disclosures
Dr Mitchell is the owner of Cardiovascular Engineering, Inc, a company that develops and manufactures devices to measure vascular stiffness, serves as a consultant to and receives honoraria from Novartis, Merck, and Servier, and is funded by research grants HL094898, DK082447, HL107385, and HL104184 from the National Institutes of Health. Bell, Mitchell, Gotal, and Torjesen are employees of Cardiovascular Engineering, Inc.
References
- 1.Egan BM, Zhao Y, Axon RN. US trends in prevalence, awareness, treatment, and control of hypertension, 1988‐2008. JAMA. 2010; 303:2043-2050. [DOI] [PubMed] [Google Scholar]
- 2.Franklin SS, Jacobs MJ, Wong ND, L'Italien GJ, Lapuerta P. Predominance of isolated systolic hypertension among middle‐aged and elderly US hypertensives: analysis based on National Health and Nutrition Examination Survey (NHANES) III. Hypertension. 2001; 37:869-874. [DOI] [PubMed] [Google Scholar]
- 3.Kaess BM, Rong J, Larson MG, Hamburg NM, Vita JA, Levy D, Benjamin EJ, Vasan RS, Mitchell GF. Aortic stiffness, blood pressure progression, and incident hypertension. JAMA. 2012; 308:875-881. [DOI] [PMC free article] [PubMed] [Google Scholar]
- 4.Kozerke S, Scheidegger MB, Pedersen EM, Boesiger P. Heart motion adapted cine phase‐contrast flow measurements through the aortic valve. Magn Reson Med. 1999; 42:970-978. [DOI] [PubMed] [Google Scholar]
- 5.Weber TF, Muller T, Biesdorf A, Worz S, Rengier F, Heye T, Holland‐Letz T, Rohr K, Kauczor HU, von Tengg‐Kobligk H. True four‐dimensional analysis of thoracic aortic displacement and distension using model‐based segmentation of computed tomography angiography. Int J Cardiovasc Imaging. 2014; 30:185-194. [DOI] [PubMed] [Google Scholar]
- 6.Carew TE, Vaishnav RN, Patel DJ. Compressibility of the arterial wall. Circ Res. 1968; 23:61-68. [DOI] [PubMed] [Google Scholar]
- 7.Learoyd BM, Taylor MG. Alterations with age in the viscoelastic properties of human arterial walls. Circ Res. 1966; 18:278-292. [DOI] [PubMed] [Google Scholar]
- 8.Nichols W, O'Rourke F. McDonald's Blood Flow in Arteries: Theoretical, Experimental and Clinical Principles. 19984th edLondon: Arnold [Google Scholar]
- 9.Nelson AJ, Worthley SG, Cameron JD, Willoughby SR, Piantadosi C, Carbone A, Dundon BK, Leung MC, Hope SA, Meredith IT, Worthley MI. Cardiovascular magnetic resonance‐derived aortic distensibility: validation and observed regional differences in the elderly. J Hypertens. 2009; 27:535-542. [DOI] [PubMed] [Google Scholar]
- 10.Redheuil A, Yu WC, Wu CO, Mousseaux E, de Cesare A, Yan R, Kachenoura N, Bluemke D, Lima JA. Reduced ascending aortic strain and distensibility: earliest manifestations of vascular aging in humans. Hypertension. 2010; 55:319-326. [DOI] [PMC free article] [PubMed] [Google Scholar]
- 11.Harris TB, Launer LJ, Eiriksdottir G, Kjartansson O, Jonsson PV, Sigurdsson G, Thorgeirsson G, Aspelund T, Garcia ME, Cotch MF, Hoffman HJ, Gudnason V. Age, Gene/Environment Susceptibility‐Reykjavik Study: multidisciplinary applied phenomics. Am J Epidemiol. 2007; 165:1076-1087. [DOI] [PMC free article] [PubMed] [Google Scholar]
- 12.Torjesen AA, Sigurethsson S, Westenberg JJ, Gotal JD, Bell V, Aspelund T, Launer LJ, de Roos A, Gudnason V, Harris TB, Mitchell GF. Pulse pressure relation to aortic and left ventricular structure in the Age, Gene/Environment Susceptibility (AGES)‐Reykjavik Study. Hypertension. 2014; 64:756-761. [DOI] [PMC free article] [PubMed] [Google Scholar]
- 13.Mitchell GF, Hwang SJ, Vasan RS, Larson MG, Pencina MJ, Hamburg NM, Vita JA, Levy D, Benjamin EJ. Arterial stiffness and cardiovascular events: the Framingham Heart Study. Circulation. 2010; 121:505-511. [DOI] [PMC free article] [PubMed] [Google Scholar]
- 14.Grotenhuis HB, Westenberg JJ, Doornbos J, Kroft LJ, Schoof PH, Hazekamp MG, Vliegen HW, Ottenkamp J, De Roos A. Aortic root dysfunctioning and its effect on left ventricular function in Ross procedure patients assessed with magnetic resonance imaging. Am Heart J. 2006; 152:975-978. [DOI] [PubMed] [Google Scholar]
- 15.Tschoegl NW, Knauss W, Emri I. Poisson's ratio in linear viscoelasticity—a critical review. Mech Time‐Depend Mater. 2002; 6:3-51. [Google Scholar]
- 16.Bramwell JC, Hill AV. The velocity of the pulse wave in man. Proc R Soc Lond B. 1922; 93:298-306. [Google Scholar]
- 17.Redheuil A, Yu WC, Mousseaux E, Harouni AA, Kachenoura N, Wu CO, Bluemke D, Lima JA. Age‐related changes in aortic arch geometry: relationship with proximal aortic function and left ventricular mass and remodeling. J Am Coll Cardiol. 2011; 58:1262-1270. [DOI] [PMC free article] [PubMed] [Google Scholar]
- 18.Hickson SS, Butlin M, Graves M, Taviani V, Avolio AP, McEniery CM, Wilkinson IB. The relationship of age with regional aortic stiffness and diameter. JACC Cardiovasc Imaging. 2010; 3:1247-1255. [DOI] [PubMed] [Google Scholar]
- 19.Ben‐Shlomo Y, Spears M, Boustred C, May M, Anderson SG, Benjamin EJ, Boutouyrie P, Cameron J, Chen CH, Cruickshank JK, Hwang SJ, Lakatta EG, Laurent S, Maldonado J, Mitchell GF, Najjar SS, Newman AB, Ohishi M, Pannier B, Pereira T, Vasan RS, Shokawa T, Sutton‐Tyrell K, Verbeke F, Wang KL, Webb DJ, Willum HT, Zoungas S, McEniery CM, Cockcroft JR, Wilkinson IB. Aortic pulse wave velocity improves cardiovascular event prediction: an individual participant meta‐analysis of prospective observational data from 17,635 subjects. J Am Coll Cardiol. 2014; 63:636-646. [DOI] [PMC free article] [PubMed] [Google Scholar]
- 20.The Reference Values for Arterial Stiffness' Collaboration. Determinants of pulse wave velocity in healthy people and in the presence of cardiovascular risk factors: ‘establishing normal and reference values’. Eur Heart J. 2010; 31:2338-2350. [DOI] [PMC free article] [PubMed] [Google Scholar]
- 21.Van Bortel LM, Laurent S, Boutouyrie P, Chowienczyk P, Cruickshank JK, De BT, Filipovsky J, Huybrechts S, Mattace‐Raso FU, Protogerou AD, Schillaci G, Segers P, Vermeersch S, Weber T. Expert consensus document on the measurement of aortic stiffness in daily practice using carotid‐femoral pulse wave velocity. J Hypertens. 2012; 30:445-448. [DOI] [PubMed] [Google Scholar]
- 22.van Prehn J, Vincken KL, Muhs BE, Barwegen GK, Bartels LW, Prokop M, Moll FL, Verhagen HJ. Toward endografting of the ascending aorta: insight into dynamics using dynamic cine‐CTA. J Endovasc Ther. 2007; 14:551-560. [DOI] [PubMed] [Google Scholar]
- 23.Patel DJ, Fry DL. The elastic symmetry of arterial segments in dogs. Circ Res. 1969; 24:1-8. [DOI] [PubMed] [Google Scholar]
- 24.Patel DJ, Janicki JS, Carew TE. Static anisotropic elastic properties of the aorta in living dogs. Circ Res. 1969; 25:765-779. [DOI] [PubMed] [Google Scholar]
- 25.Azadani AN, Chitsaz S, Matthews PB, Jaussaud N, Leung J, Tsinman T, Ge L, Tseng EE. Comparison of mechanical properties of human ascending aorta and aortic sinuses. Ann Thorac Surg. 2012; 93:87-94. [DOI] [PubMed] [Google Scholar]
- 26.Haskett D, Johnson G, Zhou A, Utzinger U, Vande Geest JP. Microstructural and biomechanical alterations of the human aorta as a function of age and location. Biomech Model Mechanobiol. 2010; 9:725-736. [DOI] [PubMed] [Google Scholar]
- 27.Morrison TM, Choi G, Zarins CK, Taylor CA. Circumferential and longitudinal cyclic strain of the human thoracic aorta: age‐related changes. J Vasc Surg. 2009; 49:1029-1036. [DOI] [PMC free article] [PubMed] [Google Scholar]
- 28.Beller CJ, Labrosse MR, Thubrikar MJ, Robicsek F. Role of aortic root motion in the pathogenesis of aortic dissection. Circulation. 2004; 109:763-769. [DOI] [PubMed] [Google Scholar]
- 29.Martin C, Sun W, Primiano C, McKay R, Elefteriades J. Age‐dependent ascending aorta mechanics assessed through multiphase CT. Ann Biomed Eng. 2013; 41:2565-2574. [DOI] [PMC free article] [PubMed] [Google Scholar]