

Abstract
Objective
Decline in cognitive function begins by the 40s, and may be related to future dementia risk. We used data from a community-representative study to determine whether there are age-related differences in simple cognitive and gait tests by the 40s, and whether these differences were associated with covert cerebrovascular disease on magnetic resonance imaging (MRI).
Methods
Between 2010 and 2012, 803 participants aged 40 to 75 years in the Prospective Urban Rural Epidemiological (PURE) study, recruited from prespecified postal code regions centered on 4 Canadian cities, underwent brain MRI and simple tests of cognition and gait as part of a substudy (PURE-MIND).
Results
Mean age was 58 ± 8 years. Linear decreases in performance on the Montreal Cognitive Assessment, Digit Symbol Substitution Test (DSST), and Timed Up and Go test of gait were seen with each age decade from the 40s to the 70s. Silent brain infarcts were observed in 3% of 40- to 49-year-olds, with increasing prevalence up to 18.9% in 70-year-olds. Silent brain infarcts were associated with slower timed gait and lower volume of supratentorial white matter. Higher volume of supratentorial MRI white matter hyperintensity was associated with slower timed gait and worse performance on DSST, and lower volumes of the supratentorial cortex and white matter, and cerebellum.
Interpretation
Covert cerebrovascular disease and its consequences on cognitive and gait performance and brain atrophy are manifest in some clinically asymptomatic persons as early as the 5th decade of life. Ann Neurol 2015;77:251–261
Magnetic resonance imaging (MRI)-detected small vessel disease (SVD) is common in the elderly but the prevalence is less well established in persons younger than 65 years old.1,2 In the elderly, MRI SVD is associated with cognitive decline, gait abnormalities, and loss of activities of daily living,3 and predicts future risk of stroke and dementia.4,5 Therefore, accumulation of MRI SVD may be the principal mechanism linking vascular risk factors to cognitive decline.
Declines in memory, executive function, and processing speed are detectable by the 40s.6 We hypothesized that unrecognized SVD may account for some of the early cognitive changes and brain atrophy in this age group, which are otherwise attributed solely to aging. To test this hypothesis, we conducted a cross-sectional prospective community-based cohort study, nested with an ongoing longitudinal epidemiological study, the Prospective Urban Rural Epidemiological (PURE) study. Our objectives were to determine the prevalence of MRI SVD, and to determine whether SVD was associated with simple, rapid clinical assessments of cognition (the Digit Symbol Substitution Test [DSST] and Montreal Cognitive Assessment [MoCA] tool), gait (Timed Up and Go test), and brain atrophy.
Subjects and Methods
Population
The PURE-MIND study is nested within the Canadian portion of the multinational PURE study.7 In Canada, PURE participants were recruited from 55 communities, defined geographically by postal codes, selected to capture regional diversity in age, ethnicity, and socioeconomic status so that the sample was broadly representative of the Canadian population. The communities were centered on 4 Canadian cities in 3 provinces: (1) Vancouver (British Columbia), (2) Hamilton (Ontario), (3) Ottawa (Ontario), and (4) Quebec City (Quebec). To obtain a nonbiased sample within each community, all households were mailed an invitation letter to participate followed by a telephone call to screen residents for the study criteria. PURE eligibility criteria were: 35 to 70 years old at study inception in 2007, could speak either English or French, had no plans to move in the next 4 years, and were capable of giving informed consent. From 2006 to 2009, 10,455 men and women were enrolled with a participation rate of about 70% of eligible households in which contact was made via telephone.
Between 2010 and 2012, Canadian PURE participants were approached to participate in the PURE-MIND substudy with a goal of enrolling 800 participants, and 63.5% expressed interest. PURE-MIND study inclusion criteria were: age ≥ 40 years, no history of stroke or dementia, no history of other neurological diseases of the brain, and no contraindications to MRI such as pacemaker. Of 1,067 interested participants, 863 (80.9%) met eligibility criteria and 803 (75.3%) completed the study.
Assessments
A comprehensive set of cardiovascular and other risk factor data was collected.
Cognitive testing was designed to efficiently assess multiple domains, consistent with published guidelines for vascular cognitive impairment research,8 while minimizing time and participant fatigue. The DSST (Wechsler Adult Intelligence Scale, 3rd Edition),9 a 2-minute test that requires the participant to match a symbol with a number according to a code, was the primary cognitive outcome. The MoCA (range = 0–30)10 is a brief global cognitive assessment that is validated in both English and French. For univariate analyses of MoCA we included the 1-point adjustment for persons with ≤12 years of education, whereas for multivariate-adjusted analyses we included college education as a model covariate.
Gait speed was assessed using the Timed Up and Go test, in which the time to arise from a chair, walk 3m, return 3m, and sit down again is recorded.11
Brain MRI was performed on the same day as the cognitive and gait assessment at each recruitment site (3 at 1.5T, 1 at 3T, Table 1). MRI sequences included axial T2 weighted, proton-density weighted, fluid-attenuated inversion recovery, and T2*-weighted gradient-recalled echo (voxel resolution = 0.94 × 0.94 × 3.5mm), as well as a high-resolution T1 weighted (T1w). The Alzheimer's Disease Neuroimaging Initiative (ADNI) phantom was scanned at each site at study initiation and termination to quantitatively estimate between-site and within-site differences.12 Additionally, scan quality was centrally reviewed by a neurologist (E.E.S.) or radiologist (J.M., S.B.).
TABLE 1.
Magnetic Resonance Imaging Protocol
| Sequence | TR, ms | TE, ms | Reconstructed Voxel Size, mm | Additional Details |
|---|---|---|---|---|
| T1w ISPGR | 5–10 | 2–4 | ∼1.0 × 1.0 × 1.0 | flip angle = 8–12°, TI = 400–650 ms |
| FLAIR | ∼9,000 | 140–155 | 0.94 × 0.94 × 3.5 (2 sites), 0.47–0.55 × 0.47–0.55 × 3.5 (2 sites) | TI = 2,250 ms |
| PD/T2 | ∼3,300 | 8–13/78–95 | 0.94 × 0.94 × 3.5 (3 sites), 0.45 × 0.45 × 3.5 (1 site) | Echo train length = 12 |
| T2* GRE | 700–1,282 | 19–23 | ∼0.94 × 0.94 × 3.5 | Flip angle = 18° |
Sequence parameters varied slightly by site because of scanner manufacturer and field strength differences (one 3.0T GE, two 1.5T GE, and one 1.5T Phillips [Best, the Netherlands] machines were used).
FLAIR = fluid-attenuated inversion recovery; PD/T2 = proton density/T2 weighted; T1w ISPGR = T1-weighted inversion-recovery spoiled gradient; T2* GRE = T2*-weighted gradient-recalled echo; TE = echo time; TI = inversion time; TR = repetition time.
Study MRIs were analyzed centrally. Lacunae, cerebral microbleeds (CMBs), and white matter hyperintensity of presumed vascular origin (WMH) were defined according to consensus recommendations.13 The presence, number, and location of brain infarcts—including lacunar infarcts, large subcortical infarcts, and cortical infarcts—and CMBs were determined by either a neurologist (E.E.S.) or a radiologist (J.M.). An independent re-review of 30 cases by both raters showed good inter-rater reliability (kappa = 0.79). The volume of WMH was determined using Quantomo software (Cybertrials, Calgary, Canada). In this semiautomated threshold-based seed-growing technique, a user places a seed in each WMH and the boundary between WMH and normal tissue is determined by a computer algorithm. In separate validation work on 30 stroke patients, Quantomo-generated volumes closely approximated manual tracings with high inter-rater reliability (intraclass correlation coefficient = 0.98). Regional brain volume measurements, cortical thicknesses, and intracranial volumes were calculated using FreeSurfer v5.0 (http://surfer.nmr.mgh.harvard.edu/).14,15 FreeSurfer-generated output was reviewed for accuracy by the consensus of 2 raters, who excluded 25 of 803 cases (3.1%) because of inaccurate surface labels. To account for normal variation in head size, all volumes were normalized to the subject average intracranial volume (1,448.9cm3). In the 25 cases with inaccurate FreeSurfer processing, the WMH volume was normalized using the sex-specific average intracranial volume. Prefrontal cortex volume was calculated as the sum of all frontal lobe regions parcellated by FreeSurfer, excluding the primary motor cortex. Basal ganglia volume was the sum of the thalamus, putamen, and caudate volumes. Average cortical thickness was calculated as the average of all 68 regions of interest generated by FreeSurfer, weighted by the amount of surface area occupied by each region.
Statistical Analysis
Continuous variables were summarized by age decade with significance testing by analysis of variance or Kruskal–Wallis test, as appropriate. Fisher exact test was used for tests of proportions by age decade. Data were missing in <1% except for the Timed Up and Go test (missing in 13 of 803, 1.6%), brain volumes (25 of 803, 3.1%), and household yearly income (57 of 803, 7.1%).
Linear mixed models were used to determine the relationships between cognitive and gait outcomes, SVD, and brain atrophy, controlling for age and sex. Models of cognition also included education (dichotomized as college/university education vs other), and models of Timed Up and Go also included height (as a continuous variable). Study site was included as a random effect. Age was entered as a continuous linear covariate except in models predicting white matter volume, where a quadratic age term was included because white matter loss accelerated with age. Age interaction terms (dichotomized by <60 vs ≥60 years) were tested in the fully adjusted models, retaining the interaction term if the interaction probability value was <0.05. Because we considered our analyses to be exploratory, probability values are presented without adjustments for multiple comparisons. Statistical analyses were done using SAS v9.3 (SAS Institute, Cary, NC). A probability value of <0.05 was considered significant.
Whole brain analyses of regional cortical thinning were performed using the Qdec application in FreeSurfer.
Results
The characteristics of the 803 participants are shown in Table 2; 59% were women, most were college educated, and relatively few had known vascular risk factors or diseases, reflecting that most (58%) were relatively young (<60 years).
TABLE 2.
Baseline Characteristics
| Characteristic | Value, n = 803 |
|---|---|
| Age, yr | 58 ± 8.0 |
| Female sex | 59% |
| European ethnicity | 93% |
| Education level | |
| Primary | 2% |
| Secondary/high school | 30% |
| College/university | 68% |
| Household yearly income | |
| ≤$45,000 | |
| $45,001–65,000 | 16% |
| $65,001–90,000 | 22% |
| $>90,000 | 44% |
| Smoking history | |
| Current | 7% |
| Former | 39% |
| Never | 54% |
| Hypertension | 18% |
| Measured BP > 140/90 mmHg | 24% |
| SBP, mmHg | 126 ± 16 |
| DBP, mmHg | 78 ± 10 |
| Diabetes mellitus | 6% |
| Coronary heart disease | 3% |
| Body mass index, median (interquartile range) | 26 (23.3–29.8) |
| Weight category | |
| Normal weight, <25 kg/m2 | 39% |
| Overweight, 25.0–29.9 kg/m2 | 37% |
| Obese, ≥30.0 kg/m2 | 24% |
| Waist:hip ratio, median (interquartile range) | 0.86 (0.79–0.93) |
BP = blood pressure; DBP = diastolic blood pressure; SBP = systolic blood pressure.
With each increasing age decade MoCA and DSST scores were lower, and the time required to complete the Timed Up and Go test was higher (Table 3). The overall mean MoCA, incorporating the 1-point adjustment for education level, was 26.5 ± 2.5, and 27% scored below the recommended cutoff for mild cognitive impairment or dementia.10 For each 10-year increase in age there was a 0.65-point decrease in MoCA (95% confidence interval [CI] = 0.45–0.85), a 7.4-point decrease in DSST (95% CI = 6.1–8.7), and a 0.6-second increase in the time to complete the Timed Up and Go test (95% CI = 0.4–0.8), according to multivariate-adjusted models.
TABLE 3.
Variation in Cognitive and Gait Performance by Age
| Age Group, yr | No. | MoCA Score | MoCA Score ≥ 26 | Digit Symbol Substitution Scorea | Timed Up and Go Test, sb |
|---|---|---|---|---|---|
| 40–49 | 143 | 27.5 (2.1) | 82% | 79 (15) | 6.7 (1.7) |
| 50–59 | 324 | 27.1 (2.2) | 77% | 72 (15) | 7.3 (2.1) |
| 60–69 | 262 | 26.4 (2.4) | 66% | 65 (14) | 7.5 (2.0) |
| ≥70 | 74 | 25.8 (2.8) | 61% | 58 (15) | 9.0 (3.5) |
All p < 0.0001 for comparisons by age.
The numbers in parentheses are 95% confidence limits.
Indicates number of items coded within 120 seconds; higher numbers indicate better performance.
Number of seconds required to traverse a fixed distance (3m and back); higher numbers indicate a longer time was needed to travel this distance, hence a slower gait speed.
MoCA = Montreal Cognitive Assessment tool.
Increasing age decade was associated with an increasing prevalence of MRI SVD (Table 4) including WMH ( Fig 1). Similarly, each additional age decade was associated with lower volumes of the cortical gray matter, white matter, prefrontal cortex, basal ganglia, and cerebellum (data not shown). Mean cerebral cortical thickness (all ages) was 2.45 ± 0.09mm. For every additional 10 years of age, the cerebral cortex was 0.026mm thinner (95% CI = 0.019–0.033); changes were seen throughout much of the lateral frontal and posterior temporal and parietal cortices ( Fig 2), with the most highly significant changes in the medial and dorsolateral frontal, posterior temporal, and parietal cortices.
TABLE 4.
Magnetic Resonance Imaging Cerebrovascular Disease by Age Decade
| Age Group, yr | No. | Silent Brain Infarcts | Cerebral Microbleeds | WMH, cm3 |
|---|---|---|---|---|
| 40–49 | 143 | 2.8% | 2% | 1.1 (0.7–1.9) |
| 50–59 | 324 | 5.9% | 2.5% | 1.3 (0.8–2.4) |
| 60–69 | 262 | 11.5% | 9.5% | 2.2 (1.3–3.8) |
| ≥70 | 74 | 18.9% | 8.1% | 4.3 (1.8–9.6) |
WMH is displayed as median (interquartile range). All p < 0.001 for comparisons by age.
WMH = white matter hyperintensity.
FIGURE 1.
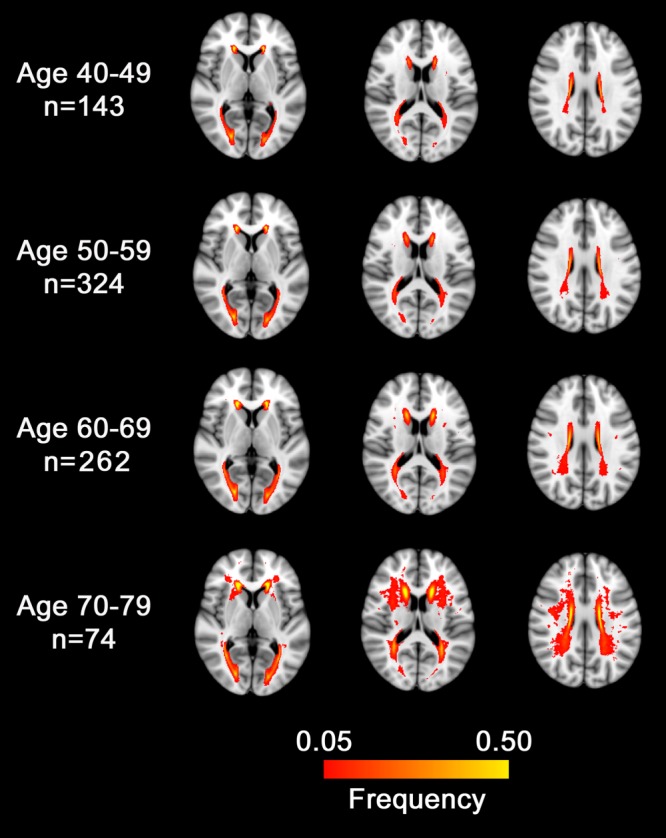
Distribution of magnetic resonance imaging white matter hyperintensity (WMH) by age decade. Red-to-yellow color indicates the probability of WMH at that location.
FIGURE 2.
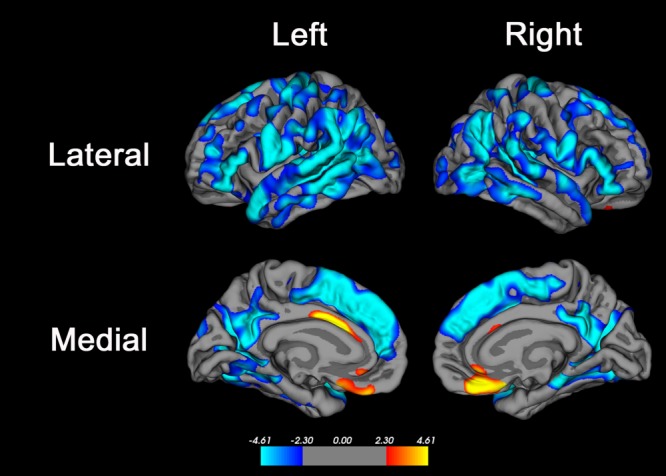
Brain regions where age was associated with cortical thickness. Advanced age was associated with decreased cortical thickness in many brain regions, most significantly in the superior frontal gyrus, inferior frontal gyrus, posterior superior and middle temporal gyri, precuneus, and supramarginal and inferior parietal cortex. Primary motor and sensory areas and the medial temporal lobe were less strongly associated with age, and there were small regions of anterior cingulate cortex and medial orbitofrontal cortex where advanced age was associated with increased cortical thickness. The color bar indicates the t value for the association; blue colors indicate regions of negative association (ie, where cortical thickness was lower in older subjects) and red–yellow colors indicate regions of positive association (ie, where cortical thickness was higher in older subjects).The false discovery rate method30 with alpha = 0.05 was used to correct for multiple comparisons.
In multivariate-adjusted models, lower DSST score was associated with higher WMH, and lower total white matter volume (Table 5). Lower MoCA score was associated with only a nonsignificant trend toward lower gray matter volume (p = 0.07). Longer Timed Up and Go was associated with silent brain infarcts, WMH, and lower gray matter and prefrontal cortex volumes, with a trend toward lower white matter volume. There was no evidence for effect modification by age.
TABLE 5.
Multivariate-Adjusted Associations of MRI Findings with Cognition and Gait
| Variable | Outcome |
||
|---|---|---|---|
| MoCA Scorea | DSST Scorea | Timed Up and Gob | |
| MRI cerebrovascular disease | |||
| Silent brain infarct, present vs absent | −0.1 (−0.7 to 0.5) p = 0.76 | −3.0 (−6.6 to 0.6) p = 0.10 | 0.8 (0.2 to 1.3) p = 0.005c |
| Cerebral microbleeds, present vs absent | −0.4 (−1.1 to 0.3) p = 0.27 | 0.2 (−4.3 to 4.7) p = 0.94 | 0.3 (−0.4 to 1.0) p = 0.39 |
| WMH, per additional 1 cm3 | −0.03 (−0.08 to 0.02) p = 0.20 | −0.4 (−0.7 to −0.1) p = 0.01c | 0.09 (0.04 to 0.13) p < 0.001c |
| Brain volumes | |||
| Cortical gray matter, per 10 cm3 decrease | −0.05 (−0.11 to 0.01) p = 0.07 | −0.3 (−0.7 to 0.1) p = 0.16 | 0.07 (0.02 to 0.13) p = 0.01c |
| White matter volume, per 10 cm3 decrease | 0.007 (−0.04 to 0.05) p = 0.77 | −0.4 (−0.7 to −0.1) p = 0.008c | 0.04 (−0.003 to 0.09) p = 0.07 |
| Prefrontal cortex volume, per 5 cm3 decrease | 0.003 (−0.02 to 0.02) p = 0.75 | −0.3 (−1.0 to 0.3) p = 0.27 | 0.12 (0.03 to 0.21) p = 0.01c |
| Basal ganglia volume, per 1 cm3 decrease | 0.002 (−0.09 to 0.1) p = 0.95 | 0.2 (−0.4 to 0.8) p = 0.52 | −0.02 (−0.11 to 0.06) p = 0.59 |
| Cerebellum volume, per 5 cm3 decrease | −0.01 (−0.07 to 0.05) p = 0.75 | 0.02 (−0.4 to 0.4) p = 0.91 | 0.04 (−0.02 to 0.10) p = 0.22 |
Estimates are from separate linear mixed models. All models are adjusted for age (continuous linear relationship) and sex; models of cognitive outcomes (MoCA, DSST) are additionally adjusted for education (college/university vs no college/university), and the model for timed up and go test is adjusted for height. Additionally, brain volume differences are adjusted for intracranial volume (see Subjects and Methods).
The numbers in parentheses are 95% confidence limits.
Lower scores indicate worse performance.
More seconds indicates longer times to travel a fixed distance—that is, slower gait speed.
Statistically significant.
DSST = Digit Symbol Substitution Test; MoCA = Montreal Cognitive Assessment tool; MRI = magnetic resonance imaging; WMH = white matter hyperintensity.
There were differential relationships between MRI SVD and atrophy in different brain compartments: silent brain infarcts were associated with lower white matter volume; WMH was associated with lower volumes of cortical gray matter, prefrontal cortex, white matter, and cerebellum; and CMBs were associated with a slightly higher (not lower) volume of basal ganglia and cerebellum (Table 6). WMH was associated with decreased cortical thickness in the superior occipital cortex in the left hemisphere ( Fig 3); neither silent brain infarcts nor CMBs were associated with average cortical thickness.
TABLE 6.
Relationship between Cerebral Small Vessel Disease and Regional Brain Volumes, Adjusted for Age
| Lesion Type | Brain Volume, cm3 |
||||
|---|---|---|---|---|---|
| Cortical Gray Matter | White Matter | Prefrontal Cortex | Basal Ganglia | Cerebellum | |
| Silent brain infarct, present vs absent | −4.9 (−11.7 to 1.8) p = 0.15 | −15.9 (−24.6 to −7.1) p < 0.001a | −1.9 (−4.0 to 0.2) p = 0.08 | −0.11 (−0.6 to 0.3) p = 0.65 | −0.5 (−3.8 to 2.8) p = 0.76 |
| Cerebral microbleeds, present vs absent | 8.3 (0.09 to 16.5) p = 0.05a | 5.6 (−5.0 to 16.3) p = 0.30 | 2.1 (−0.5 to 4.7) p = 0.11 | 0.8 (0.2 to 1.3) p = 0.006a | 4.7 (0.8 to 8.7) p = 0.02a |
| WMH, per additional 1 cm3 | −1.1 (−1.7 to −0.6) p < 0.001a | −1.2 (−1.9 to −0.5) p = 0.001a | −0.3 (−0.5 to −0.1) p < 0.001a | 0.0 (−0.03 to 0.04) p = 0.81 | −0.5 (−0.7 to −0.2) p < 0.001a |
Estimates are from separate linear mixed models. All models are adjusted for age (continuous linear relationship) and sex. Differences according to lesion presence or increasing volume are expressed in cm3 of brain volume. Additionally, brain volume differences are adjusted for intracranial volume (see Subjects and Methods).
The numbers in parentheses are 95% confidence limits.
Statistically significant.
WMH = white matter hyperintensity.
FIGURE 3.
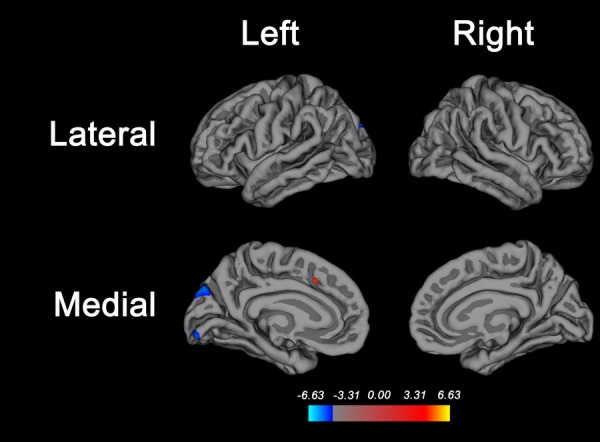
Brain regions where white matter hyperintensity (WMH) is associated with cortical thickness. Higher WMH volume is associated with decreased cortical thickness in the superior parieto-occipital cortex and in the lingual gyrus of the left hemisphere only. The false discovery rate method30 was used to correct for multiple comparisons, with alpha set at 0.01 to account for comparisons with the 3 manifestations of small vessel disease analyzed (WMH, silent brain infarcts, and microbleeds). Average cortical thickness was not associated with silent brain infarcts or microbleeds.
Relationships between WMH, silent brain infarcts, and cognitive and gait outcomes were attenuated but still significant when additionally controlling for brain volumes (Table 7).
TABLE 7.
Associations between Cerebrovascular Disease and Cognitive and Gait Performance, Controlling for Age and Brain Atrophy
| Outcome | Covariates | Beta Coefficient (95% CI) | p |
|---|---|---|---|
| DSST | White matter volumea | −0.4 (−0.7 to −0.1) | 0.02c |
| WMHb | −0.4 (−0.7 to −0.1) | 0.02c | |
| Timed Up and Go | Cortical gray matter volumea | 0.05 (−0.01 to 0.11) | 0.09 |
| White matter volumea | 0.02 (−0.03 to 0.07) | 0.42 | |
| WMHb | 0.08 (0.04 to 0.13) | <0.001c | |
| Timed Up and Go | Cortical gray matter volumea | 0.06 (0.003 to 0.12) | 0.04c |
| White matter volumea | 0.02 (−0.03 to 0.07) | 0.41 | |
| Silent brain infarct | 0.61 (0.06 to 1.17) | 0.03c | |
All models were adjusted for age and sex in addition to the covariates listed. For the Timed Up and Go outcome separate models were run for WMH and for silent brain infarct. WMH and silent brain infarcts were not included in the same models because they may be on the same causal pathway leading to gait decline; therefore, it would not be appropriate to consider them as independent covariates.
Per 10 cm3 decrease.
Per 1 cm3 decrease.
Statistically significant.
CI = confidence interval; DSST = Digit Symbol Substitution Test; WMH = white matter hyperintensity.
Discussion
In this community-representative study, each advancing age decade from the 40s to the early 70s was associated with worse performance on cognitive and gait tests, brain atrophy, and increasing prevalence of MRI SVD. SVD was detected in a significant proportion of persons in their 40s and 50s and was not silent even at these relatively young ages, as WMH and silent brain infarcts were associated with worse cognitive performance, slower gait speed, and atrophy of brain subregions. Relationships between SVD and clinical outcomes did not vary by age, indicating that SVD had the same clinical correlates in midlife as in later life. Silent brain infarcts and WMH were associated with longer time to complete the Timed Up and Go test, whereas associations with MoCA score were weaker and nonsignificant. Overall, these data suggest that vascular cognitive impairment due to SVD is a decades-long process in some individuals, with early and subtle manifestations beginning early in midlife.
The age-related declines in cognitive performance were consistent with findings from the Whitehall II study of middle-aged London civil servants, which found that declines in cognitive function were manifest throughout the age range of 45 to 70 years.6 The decline in DSST score with age was expected.16 The decline in MoCA was consistent with findings from a recent population-based study in Ireland17; our study additionally included neuroimaging but did not find that age-related variation in MoCA was accounted for by cerebrovascular disease. Although the MoCA is more sensitive to vascular cognitive impairment in persons with stroke,18 our data suggest it may not be as sensitive to the presence of covert cerebrovascular disease in a population-based setting.
Similar to cognition, gait speed also slowed throughout the age range studied. Worse performance on the Timed Up and Go test has been associated with falls and higher mortality,19 with fewer data on middle-aged persons.17 The study results show that the Timed Up and Go detects subclinical declines with age, although the vast majority of participants had normal-range performance (ie, completed the test in <10 seconds).20 The slowed gait speed reflects, at least in part, impaired neural control of gait, as persons with slower gait speed were more likely to have silent brain infarcts, higher volume of WMH, and greater atrophy of the cortical gray matter.
Covert cerebrovascular disease accounted for some of the variation in cognitive and gait performance that, in the absence of MRI information, would have been attributed to ageing alone. Even in persons in their 40s, silent brain infarcts and CMBs were present in 3% and 2% of participants, respectively. Other population-based studies have either included mostly elderly subjects or not reported findings in younger subjects specifically. The prevalence of silent brain infarcts in the 40s and 50s in this study was similar to the NILS-LSA study from Japan21 but lower than in the Framingham study (8–9% of all 40- to 49-year-olds).22 In this study, silent brain infarcts were associated with slower gait speed, and higher volume of WMH was associated with slower gait speed and worse performance on the DSST. These relationships did not differ in persons in their 40s and 50s compared to those aged >60 years, suggesting that these findings were not primarily driven by associations with later life mild cognitive impairment and indicating that covert cerebrovascular disease may have consequences, albeit subtle, even in younger middle-aged persons.
This study is among the most comprehensive to date on the relationship between age, SVD, and brain atrophy. The findings were consistent with other population-based studies, but with a more comprehensive assessment of brain subregions. In the Framingham study and Austrian Stroke Prevention Study, total brain volume decreased with advancing age and was also associated with WMH.22,23 In the Rotterdam study of persons aged >60 years, both white matter and gray matter volumes decreased with advancing age, and infarcts were associated with decreased white matter volume but not decreased gray matter volume, as in the current study.24 Smaller cerebellar volume was associated with WMH and infratentorial infarcts in the Rotterdam study25; in this study, WMH was associated with lower cerebellar volume, but there were insufficient numbers of infratentorial infarcts for analysis. The Rotterdam study has reported that lobar cortical thickness decreases with age26; this study augments these findings by showing regional variation in thinning (see Fig 2) and that WMH, but not silent brain infarcts or microbleeds, has a mild effect on regional thinning (see Fig 3). To our knowledge, this is the first population-based study to report on associations between CMBs and brain volumes. There was no association between CMBs and atrophy; on the contrary, CMBs were associated with a small increase in basal ganglia and cerebellar volume, for unclear reasons. It seems unlikely that the volume differences were due to technical artifact caused by susceptibility effect, because CMB volumes were small and unlikely to have significantly influenced the volume calculations.
The associations between MRI SVD and outcomes were attenuated but still significant when controlling for atrophy, suggesting that atrophy does not mediate all of the effects of SVD on cognitive and gait dysfunction. Silent brain infarcts and WMH may disrupt brain connectivity even in the absence of overall atrophic changes.
In addition to causing SVD, vascular risk factors may have cerebral consequences that were not measured in this study. For example, data from the Framingham study show that higher systolic blood pressure was associated with increased white matter diffusivity in persons as young as their 30s and 40s.27
Study strengths include the population-based sampling within postal codes and use of high-resolution MRI, enabling determination of regional as well as global brain atrophy patterns, and cortical thickness. Limitations include the cross-sectional study design and the relatively brief cognitive and gait test battery, which had to be efficient to avoid undue subject burden in the context of multiple other assessments as part of the parent study. Although subjects were scanned on multiple scanners, we used protocols from ADNI designed to enable multicenter scan studies,12,28 analyzed data using research software validated against multiple scanner manufacturers and at both 1.5T and 3T,29 and used linear mixed models to account for clustering of variance by study site. The study findings may be affected by FreeSurfer segmentation accuracy, which has been less extensively validated for the basal ganglia than for other measures such as cortical thickness.14 Additionally, FreeSurfer-derived volumes have not been validated in patients with more advanced MRI SVD; however, a radiologist visually inspected all scans and excluded those with visually obvious errors.
This study has identified clinically unrecognized variation in cognitive and gait performance in middle age associated with potentially preventable covert cerebrovascular disease, which may indicate higher risk of future cognitive and gait impairment due to decreased cognitive reserve. Further research is warranted to determine whether prevention of midlife covert cerebrovascular disease would translate into a reduction in later life dementia, gait impairment, and falls.
Acknowledgments
The main PURE study was funded by the Population Health Research Institute, Canadian Institutes of Health Research, and Heart and Stroke Foundation of Ontario, and through unrestricted grants from several pharmaceutical companies (major contributions from AstraZeneca [Sweden and Canada], Sanofi-Aventis [France and Canada], Boehringer Ingelheim [Germany and Canada], Servier, and GlaxoSmithKline), with additional contributions from Novartis and King Pharma (S.Y.). The PURE-MIND substudy was funded by the Canadian Institutes of Health Research, Canadian Stroke Network, Heart and Stroke Foundation of Canada, and Heart and Stroke Foundation Canadian Partnership for Stroke Recovery (E.S.).
Authorship
E.E.S.: designed the study, obtained study funding, performed statistical analysis, performed the literature search, drafted the manuscript; M.O.: designed the study, obtained study funding, critically reviewed and revised the manuscript; G.D.: study site leader, collected study data, critically reviewed and revised the manuscript; S.A.L.: study site leader, collected study data, critically reviewed and revised the manuscript; A.W.: study site leader, collected study data, critically reviewed and revised the manuscript; M.S.: critically reviewed and revised the manuscript; P.P.: study site coleader, collected study data, critically reviewed and revised the manuscript; G.S.: study site coleader, collected study data, critically reviewed and revised the manuscript; S.E.B.: critically reviewed and revised the manuscript; S.S.: maintained study database, critically reviewed and revised the manuscript; M.D.N.: collected study data, critically reviewed and revised the manuscript; O.B.: critically reviewed and revised the manuscript; J.M.: analyzed study MRI data, critically reviewed and revised the manuscript; M.G.: critically reviewed and revised the manuscript; S.B.: analyzed study MRI data, critically reviewed and revised the manuscript; K.S.: analyzed study MRI data, critically reviewed and revised the manuscript; V.H.: analyzed study MRI data, critically reviewed and revised the manuscript; C.R.M.: analyzed study MRI data, critically reviewed and revised the manuscript; R.F.: critically reviewed and revised the manuscript; S.I.: supervised study statistical analysis, critically reviewed and revised the manuscript; J.D.: central study coordination, critically reviewed and revised the manuscript; S.R.: central study coordination, critically reviewed and revised the manuscript; K.T.: study site coleader, collected study data, critically reviewed and revised the manuscript; S.Y.: designed the study, obtained study funding, critically reviewed and revised the manuscript.
Potential Conflicts of Interest
Nothing to report.
References
- 1.Pantoni L. Cerebral small vessel disease: from pathogenesis and clinical characteristics to therapeutic challenges. Lancet Neurol. 2010;9:689–701. doi: 10.1016/S1474-4422(10)70104-6. [DOI] [PubMed] [Google Scholar]
- 2.Vermeer SE, Longstreth WT, Jr, Koudstaal PJ. Silent brain infarcts: a systematic review. Lancet Neurol. 2007;6:611–619. doi: 10.1016/S1474-4422(07)70170-9. [DOI] [PubMed] [Google Scholar]
- 3.LADIS Study Group. 2001–2011: a decade of the LADIS (Leukoaraiosis And DISability) Study: what have we learned about white matter changes and small-vessel disease? Cerebrovasc Dis. 2011;32:577–588. doi: 10.1159/000334498. [DOI] [PubMed] [Google Scholar]
- 4.Debette S, Beiser A, DeCarli C, et al. Association of MRI markers of vascular brain injury with incident stroke, mild cognitive impairment, dementia, and mortality: the Framingham Offspring Study. Stroke. 2010;41:600–606. doi: 10.1161/STROKEAHA.109.570044. [DOI] [PMC free article] [PubMed] [Google Scholar]
- 5.Vermeer SE, Den Heijer T, Koudstaal PJ, et al. Incidence and risk factors of silent brain infarcts in the population-based Rotterdam Scan Study. Stroke. 2003;34:392–396. doi: 10.1161/01.str.0000052631.98405.15. [DOI] [PubMed] [Google Scholar]
- 6.Singh-Manoux A, Kivimaki M, Glymour MM, et al. Timing of onset of cognitive decline: results from Whitehall II prospective cohort study. BMJ. 2012;344:d7622. doi: 10.1136/bmj.d7622. [DOI] [PMC free article] [PubMed] [Google Scholar]
- 7.Yusuf S, Islam S, Chow CK, et al. Use of secondary prevention drugs for cardiovascular disease in the community in high-income, middle-income, and low-income countries (the PURE Study): a prospective epidemiological survey. Lancet. 2011;378:1231–1243. doi: 10.1016/S0140-6736(11)61215-4. [DOI] [PubMed] [Google Scholar]
- 8.Hachinski V, Iadecola C, Petersen RC, et al. National Institute of Neurological Disorders and Stroke-Canadian Stroke Network vascular cognitive impairment harmonization standards. Stroke. 2006;37:2220–2241. doi: 10.1161/01.STR.0000237236.88823.47. [DOI] [PubMed] [Google Scholar]
- 9.Kaplan E, Fein D, Morris R, Delis D. The WAIS-R as a neuropsychological instrument. San Antonio, TX: Psychological Corporation; 1991. [Google Scholar]
- 10.Nasreddine ZS, Phillips NA, Bedirian V, et al. The Montreal Cognitive Assessment, MoCA: a brief screening tool for mild cognitive impairment. J Am Geriatr Soc. 2005;53:695–699. doi: 10.1111/j.1532-5415.2005.53221.x. [DOI] [PubMed] [Google Scholar]
- 11.Bohannon RW. Comfortable and maximum walking speed of adults aged 20–79 years: reference values and determinants. Age Ageing. 1997;26:15–19. doi: 10.1093/ageing/26.1.15. [DOI] [PubMed] [Google Scholar]
- 12.Gunter JL, Bernstein MA, Borowski BJ, et al. Measurement of MRI scanner performance with the ADNI phantom. Med Phys. 2009;36:2193–2205. doi: 10.1118/1.3116776. [DOI] [PMC free article] [PubMed] [Google Scholar]
- 13.Wardlaw JM, Smith EE, Biessels GJ, et al. Neuroimaging standards for research into small vessel disease and its contribution to ageing and neurodegeneration. Lancet Neurol. 2013;12:822–838. doi: 10.1016/S1474-4422(13)70124-8. [DOI] [PMC free article] [PubMed] [Google Scholar]
- 14.Fischl B, Salat DH, Busa E, et al. Whole brain segmentation: automated labeling of neuroanatomical structures in the human brain. Neuron. 2002;33:341–355. doi: 10.1016/s0896-6273(02)00569-x. [DOI] [PubMed] [Google Scholar]
- 15.Desikan RS, Segonne F, Fischl B, et al. An automated labeling system for subdividing the human cerebral cortex on MRI scans into gyral based regions of interest. Neuroimage. 2006;31:968–980. doi: 10.1016/j.neuroimage.2006.01.021. [DOI] [PubMed] [Google Scholar]
- 16.Hoyer WJ, Stawski RS, Wasylyshyn C, Verhaeghen P. Adult age and digit symbol substitution performance: a meta-analysis. Psychol Aging. 2004;19:211–214. doi: 10.1037/0882-7974.19.1.211. [DOI] [PubMed] [Google Scholar]
- 17.Kenny RA, Coen RF, Frewen J, et al. Normative values of cognitive and physical function in older adults: findings from the Irish Longitudinal Study on Ageing. J Am Geriatr Soc. 2013;61(suppl 2):S279–S290. doi: 10.1111/jgs.12195. [DOI] [PubMed] [Google Scholar]
- 18.Pendlebury ST, Cuthbertson FC, Welch SJ, et al. Underestimation of cognitive impairment by Mini-Mental State Examination versus the Montreal Cognitive Assessment in patients with transient ischemic attack and stroke: a population-based study. Stroke. 2010;41:1290–1293. doi: 10.1161/STROKEAHA.110.579888. [DOI] [PubMed] [Google Scholar]
- 19.Rosano C, Newman AB, Katz R, et al. Association between lower digit symbol substitution test score and slower gait and greater risk of mortality and of developing incident disability in well-functioning older adults. J Am Geriatr Soc. 2008;56:1618–1625. doi: 10.1111/j.1532-5415.2008.01856.x. [DOI] [PMC free article] [PubMed] [Google Scholar]
- 20.Bohannon RW. Reference values for the timed up and go test: a descriptive meta-analysis. J Geriatr Phys Ther. 2006;29:64–68. doi: 10.1519/00139143-200608000-00004. [DOI] [PubMed] [Google Scholar]
- 21.Kohara K, Fujisawa M, Ando F, et al. MTHFR gene polymorphism as a risk factor for silent brain infarcts and white matter lesions in the Japanese general population: the NILS-LSA Study. Stroke. 2003;34:1130–1135. doi: 10.1161/01.STR.0000069163.02611.B0. [DOI] [PubMed] [Google Scholar]
- 22.DeCarli C, Massaro J, Harvey D, et al. Measures of brain morphology and infarction in the Framingham heart study: establishing what is normal. Neurobiol Aging. 2005;26:491–510. doi: 10.1016/j.neurobiolaging.2004.05.004. [DOI] [PubMed] [Google Scholar]
- 23.Schmidt R, Ropele S, Enzinger C, et al. White matter lesion progression, brain atrophy, and cognitive decline: the Austrian Stroke Prevention study. Ann Neurol. 2005;58:610–616. doi: 10.1002/ana.20630. [DOI] [PubMed] [Google Scholar]
- 24.Ikram MA, Vernooij MW, Vrooman HA, et al. Brain tissue volumes and small vessel disease in relation to the risk of mortality. Neurobiol Aging. 2009;30:450–456. doi: 10.1016/j.neurobiolaging.2007.07.009. [DOI] [PubMed] [Google Scholar]
- 25.Hoogendam YY, van der Geest JN, van der Lijn F, et al. Determinants of cerebellar and cerebral volume in the general elderly population. Neurobiol Aging. 2012;33:2774–2781. doi: 10.1016/j.neurobiolaging.2012.02.012. [DOI] [PubMed] [Google Scholar]
- 26.van Velsen EF, Vernooij MW, Vrooman HA, et al. Brain cortical thickness in the general elderly population: the Rotterdam Scan Study. Neurosci Lett. 2013;550:189–194. doi: 10.1016/j.neulet.2013.06.063. [DOI] [PubMed] [Google Scholar]
- 27.Maillard P, Seshadri S, Beiser A, et al. Effects of systolic blood pressure on white-matter integrity in young adults in the Framingham Heart Study: a cross-sectional study. Lancet Neurol. 2012;11:1039–1047. doi: 10.1016/S1474-4422(12)70241-7. [DOI] [PMC free article] [PubMed] [Google Scholar]
- 28.Mortamet B, Bernstein MA, Jack CR, Jr, et al. Automatic quality assessment in structural brain magnetic resonance imaging. Magn Reson Med. 2009;62:365–372. doi: 10.1002/mrm.21992. [DOI] [PMC free article] [PubMed] [Google Scholar]
- 29.Han X, Jovicich J, Salat D, et al. Reliability of MRI-derived measurements of human cerebral cortical thickness: the effects of field strength, scanner upgrade and manufacturer. Neuroimage. 2006;32:180–194. doi: 10.1016/j.neuroimage.2006.02.051. [DOI] [PubMed] [Google Scholar]
- 30.Genovese CR, Lazar NA, Nichols T. Thresholding of statistical maps in functional neuroimaging using the false discovery rate. Neuroimage. 2002;15:870–878. doi: 10.1006/nimg.2001.1037. [DOI] [PubMed] [Google Scholar]