

ABSTRACT
The human oncogenic Kaposi's sarcoma-associated herpesvirus (KSHV) expresses a set of ∼20 viral microRNAs (miRNAs). miR-K10a stands out among these miRNAs because its entire stem-loop precursor overlaps the coding sequence for the Kaposin (Kap) A/C proteins. The ectopic expression of KapA has been reported to lead to transformation of rodent fibroblasts. However, these experiments inadvertently also introduced miR-K10a, which raises the question whether the transforming activity of the locus could in fact be due to miR-K10a expression. To answer this question, we have uncoupled miR-K10a and KapA expression. Our experiments revealed that miR-K10a alone transformed cells with an efficiency similar to that when it was coexpressed with KapA. Maintenance of the transformed phenotype was conditional upon continued miR-K10a but not KapA protein expression, consistent with its dependence on miRNA-mediated changes in gene expression. Importantly, miR-K10a taps into an evolutionarily conserved network of miR-142-3p targets, several of which are expressed in 3T3 cells and are also known inhibitors of cellular transformation. In summary, our studies of miR-K10a serve as an example of an unsuspected function of an mRNA whose precursor is embedded within a coding transcript. In addition, our identification of conserved miR-K10a targets that limit transformation will point the way to a better understanding of the role of this miRNA in KSHV-associated tumors.
IMPORTANCE Kaposi's sarcoma-associated herpesvirus (KSHV) is a human tumor virus. The viral Kaposin locus has known oncogenic potential, which has previously been attributed to the encoded KapA protein. Here we show that the virally encoded miR-K10a miRNA, whose precursor overlaps the KapA-coding region, may account for the oncogenic properties of this locus. Our data suggest that miR-K10a mimics the cellular miRNA miR-142-3p and thereby represses several known inhibitors of oncogenic transformation. Our work demonstrates that functional properties attributed to a coding region may in fact be carried out by an embedded noncoding element and sheds light on the functions of viral miR-K10a.
INTRODUCTION
The human oncogenic gammaherpesvirus Kaposi's sarcoma-associated herpesvirus (KSHV) is the etiological agent of Kaposi's sarcoma (KS) and B cell proliferative disorders, including primary effusion lymphoma (PEL) (1, 2). KSHV and many other herpesviruses are now known to express extensive sets of viral microRNAs (miRNAs) with suspected roles in viral replication and pathogenesis (reviewed in references 3 and 4). miRNAs are ∼22-nucleotide (nt)-long noncoding RNAs that are generated by the sequential endonucleolytic processing of primary transcripts by Drosha in the nucleus and Dicer in the cytoplasm. Mature miRNAs then function within the Argonaute (Ago) protein-containing miRNA-induced silencing complex (RISC) to repress gene expression from mRNAs bearing 3′ untranslated region (3′UTR) sequences with perfect matches to the 5′ end of the miRNA (the “seed”). Seed-based interactions typically require Watson-Crick base pairing of nt 2 to 8 of the miRNA or of nt 2 to 7 if the match is followed by an adenosine (5). KSHV expresses ∼20 mature viral miRNAs from 12 stem-loop precursors (6–9). The miR-K10 miRNAs stand out among the KSHV miRNAs for several reasons. The miR-K10 stem-loop encodes two equally abundant miRNAs, called miR-K10a and miR-K10a+1 (collectively referred to as miR-K10a/+1 here unless specified otherwise), due to differential processing of the miRNA 5′ end (10, 11). A low-frequency adenosine (A)-to-inosine (I) RNA editing event in the miR-K10a/+1 seed region also causes the expression of two similarly offset miR-K10b miRNAs, which are expressed at only low levels during KSHV latency but are potentially induced upon viral reactivation (8, 10–13). We have previously shown that miR-K10a/+1 regulate targets of the evolutionary conserved cellular miR-142-3p miRNAs, a consequence of their shared seed sequences and miRNA binding sites (11). The miR-K10 miRNAs are the only KSHV miRNAs processed from a coding region, i.e., that of the Kaposin A (KapA) and KapC proteins. Processing of the miR-K10 stem-loop from its exonic location results in destruction of a subset of the Kaposin A, B, and C mRNAs. The miR-K10 stem-loop can therefore be regarded as a cis-acting negative regulator of Kap protein expression (14). However, the miR-K10a and/or miR-K10a+1 seeds are the only KSHV miRNA seed sequences also found in miRNAs encoded by the related rhesus rhadinovirus (RRV) and retroperitoneal fibromatosis-associated herpesvirus Macaca nemestrina (RFHVMn) (15, 16). It therefore appears likely that miR-K10a/+1 also have important seed-specific functions in rhadinovirus biology and pathogenesis, in addition to their sequence-independent role as regulators of Kap protein expression. Known functions of miR-K10a include the inhibition of tumor necrosis factor-like weak inducer of apoptosis receptor protein (TWEAKR) and of TWEAK-induced apoptosis and cytokine secretion (17). The miR-K10a miRNAs have also previously been shown to inhibit transforming growth factor-β (TGF-β) signaling, by repressing the expression of TGF-β receptor 2 (18).
KapA has been proposed to be expressed as an ∼60-amino-acid transmembrane protein during latency (19–24). The ectopic expression of the KapA coding sequence in rodent fibroblasts resulted in their oncogenic transformation, i.e., loss of contact inhibition, loss of substrate dependence, and tumorigenesis in nude mice (12, 19, 21, 23). Other reported consequences of KapA expression include the activation of Erk signaling, the reorganization of the actin cytoskeleton, and altered cell-matrix adhesion (19, 22). The expression of KapA in the context of infection remains poorly characterized and is complicated by the poor antigenicity of KapA and the overlapping open reading frame (ORF) of the KapC proteins, which share their C termini with KapA. In fact, a recent study has raised the possibility that none of the Kaposin proteins might be translated during latency (25).
Importantly, previous studies that employed the ectopic expression of KapA necessarily also expressed the miR-K10a miRNAs. It is therefore possible that some or even all of the functions attributed to KapA are in fact consequences of the expression of the embedded miRNAs. This hypothesis is strengthened by a report that an A-to-G point mutation which mimics A-to-I editing of the locus and introduces a serine-to-glycine change into KapA, but also disrupts the miR-K10a/+1 seed sequences, abolished transformation (8, 12). We decided to specifically investigate whether the miR-K10a miRNAs could contribute to the transforming activity of the KapA locus. Our results indicate that miR-K10a/+1 alone transformed cells and that maintenance of the transformed status was conditional upon continued miR-K10a but not KapA protein expression. Our results furthermore suggest that this transforming activity of miR-K10a could be due to repression of miR-142-3p targets that are known inhibitors of transformation. Our study serves as a cautionary tale demonstrating potential pitfalls of the functional analysis of loci that harbor both coding and noncoding elements. Finally, our study may also point the way to the functional investigation of the miR-K10a miRNAs in KSHV infection of human cells and KSHV pathogenesis.
MATERIALS AND METHODS
Cell culture.
293T cells were maintained in Dulbecco modified Eagle medium (DMEM) containing 4.5 g/liter glucose and l-glutamine (Sigma-Aldrich, St. Louis, MO) and supplemented with 10% fetal bovine serum (FBS) (Gibco, Life Technologies, Carlsbad, CA). NIH 3T3 cells were maintained in DMEM containing 10% calf serum. Telomerase-immortalized human microvascular endothelial cells (iHMVEC) were grown in EBM2-MV medium supplemented with EGM-2 MV SingleQuot kit supplements and growth factors (Lonza). The PEL cell lines BC-1 and BC-3 were grown in RPMI 1640 medium containing l-glutamine (Sigma-Aldrich) and supplemented with 0.05 mM β-mercaptoethanol (Bio-Rad, Hercules, CA) and 10 or 15% fetal bovine serum, respectively. For mimic transfection, iHMVEC were seeded at 7 × 10⁵/10-cm dish and transfected with 10 nM mirVana mature miRNA mimic control 1 or an equimolar mix of miR-K10 and miR-K10a/+1 mimics using Lipofectamine RNAiMAX transfection reagent (Life Technologies) as instructed by the manufacturer.
Vectors and cloning procedures.
The inducible lentiviral expression vectors for the wild-type (WT) and frameshift mutant (FS) KapA loci were based on pTRIPZ (Thermo Scientific) (Fig. 1A). We first generated a control vector by ligating annealed oligonucleotides 5′-CCGGTAGAGTTAATTAAAGAGA and 5′-CGCGTCTCTTTAATTAACTCTA between the AgeI and MluI sites of the vector, thus replacing the turboRFP-miR-30 cassette with an AgeI-PacI-MluI cloning linker. We named the resulting vector pTRIPZ/APM. Next, we amplified WT and FS KapA cassettes using forward primer 5-AGAGAACCGGTACCATGGATAGAGGCTTAACG (WT) or 5′-AGAGAACCGGTACCATGGATAGAGGCTAACG (FS) and reverse primer 5′-CTACGCGTTCACTTGTCATCGTCATCCTTGTAATCGATATCATGATCTTTATAATCACCGTCATGGTCTTTGTAGTCGTGCGCGCCCGTTGCAAC and inserted the resulting fragments between the AgeI and MluI sites of pTRIPZ/APM. In the FS mutant, the middle T in the fourth codon following the initiation codon was deleted, which resulted in an in-frame UAA stop codon (ATG.GAT.AGA.GGC.TTA.ACG was changed to ATG.GAT.AGA.GGC.TAA.CG, where the initiation codon is underlined and the altered codon is in bold). The 3′primer introduced a 3× Flag epitope with the amino acid sequence DYKDHDGDYKDHDIDYKDDDDK. The lentiviral vectors pLCE and the siCXCR4-targeted control sponge pLCE/CXCR4 were described previously (26). The new lentiviral miR-K10a/+1-specific sponge was cloned as described previously for other miRNAs (26) and contained seven copies of the sequence GCCACTCGGGGCCTCAACACTAA, separated by spacers. For the miR-30-based expression of “shKap,” a KapA-directed small interfering RNA (siRNA), a synthetic fragment with the sequence 5′TGTTTGAATGAGGCTTCAGTACTTTACAGAATCGTTGCCTGCACATCTTGGAAACACTTGCTGGGATTACTTCTTCAGGTTAACCCAACAGAAGGCTCGAGAAGGTATATTGCTGTTGACAGTGAGCGCGTCCCGGATGTGCTACTAAATTGGTGAAGCCACAGATGCAATTTAGTAACACATCCGGGACATGCCTACTGCCTCGGACTTCAAGGGGCTACTTTAGGAGCAATTATCTTGTTTACTAAAACTGAATACCTTGCTATCTCTTTGATACATTTTTACAAAGCTGAATTAAAATGGTATAAATTAAATCACTTT was ordered as a gBlock (IDT) and PCR amplified with the forward primer 5′-AGAGAGTCGACTGTTTGAATGAGGCTTCA and the reverse primer 5′-CTCTCGCGGCCGCAAAGTGATTTAATTTATACC. The resulting fragment was cut with SalI and NotI and ligated between the XhoI and NotI sites of pLCE. The target sequence of shKap (5′-TGTCCCGGATGTGTTACTAAAT) is located upstream of the miR-K10a/+1 stem-loop precursor.
FIG 1.

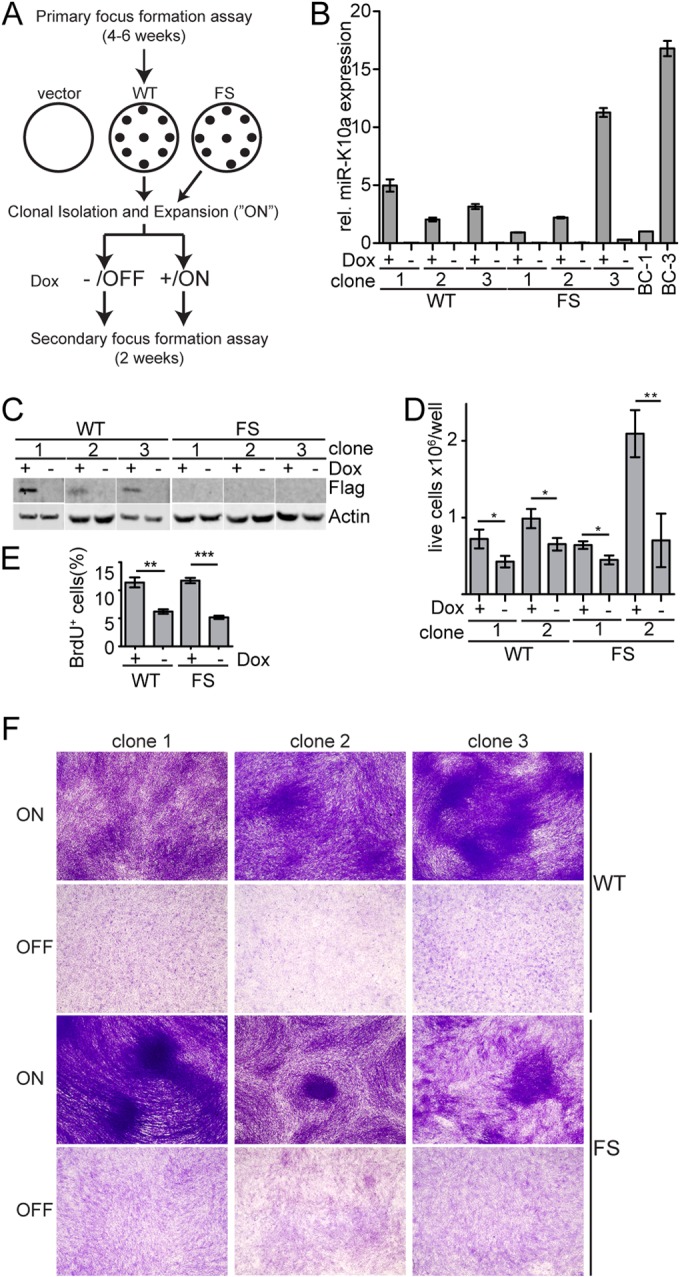
The miR-K10a miRNAs overcome contact inhibition in the absence of KapA in NIH/3T3 cells. (A) Schematic of the parental lentiviral vector pTRIPZ and wild-type (WT) or frameshift mutant (FS) pTRIPZ-based KapA/miR-K10a/+1 expression vectors. For KapA/miR-K10a/+1 expression, the tRFP-sh-miR cassette was replaced with the WT or FS KapA ORF. LTR, long terminal repeat; tRFP, turboRFP reporter; TRE, tetracycline-inducible promoter; sh-miR, miR-30-based siRNA expression cassette; rtTA3, reverse tetracycline transactivator 3; UBC, human ubiquitin C promoter; IRES, internal ribosomal entry site; PUROR puromycin resistance gene; WRE, woodchuck hepatitis virus posttranscriptional regulatory element; SIN-LTR, self-inactivating LTR. (B) Western blot analysis demonstrating the Dox-dependent (+, ON) expression of 3× Flag-tagged KapA in WT- but not FS-transduced cells. (C) Primer extension analysis demonstrating the Dox-dependent (ON) expression of miR-K10a and miR-K10a+1 in both WT- and FS-transduced cells. Expression levels were slightly below those observed in the PEL cell line BC-3. 5S RNA served as an input RNA control. (D) Focus formation assay shows equivalent numbers of Dox-dependent foci in WT- and FS-transduced cells. Foci were scored 6 weeks into the assay. n = 3 independent experiments, with three technical replicates each. Error bars, standard deviations (SD); n.s., not significant.
RNA extraction and miR-K10a expression analysis.
Total RNA was prepared using TRIzol (Life Technologies). Quantitative real-time PCR (qRT-PCR) analyses were performed on 3 ng of total RNA using TaqMan mature miRNA assays and controls (Life Technologies). miR-K10a/+1 expression in 3T3 and human cells was normalized to snoRNA202 and RNU48 expression, respectively. Primer extension reactions were performed on 10 μg total RNA using the primer extension system from Promega as described previously (11).
Quantitative Western blotting.
Cells were rinsed with ice-cold phosphate-buffered saline (PBS), scraped into ice-cold PBS, collected by centrifugation and lysed with lysis buffer (20 mM Tris [pH 7.5], 100 mM NaCl, 1% Triton X-100, 10% glycerol, 1 mM EDTA, and Complete EDTA-free protease inhibitors [Roche]) for 30 min on ice. The resulting lysates were cleared at 21,000 × g for 30 min at 4°C, and protein concentrations of the extracts were determined by bicinchoninic acid (BCA) assay (Pierce). Twenty micrograms (for p27 and p120) or 50 μg (for KapA) of extracts per lane were run on Bolt 4 to 12% Bis-Tris Plus gels (Life Technologies) and transferred to nitrocellulose membranes. Membranes were blocked with Odyssey blocking buffer (Li-Cor Biosciences, Lincoln, NE) and probed with primary antibody and IRDye 800CW-conjugated goat anti-rabbit or anti-mouse secondary antibodies (Li-Cor Biosciences). Blots were imaged and quantified with the Odyssey Fc imaging system (Li-Cor Biosciences). Quantification was performed on data from independent biological replicates. Anti-Flag M2 antibody was from Sigma, anti-p120 antibody from Cell Signaling Technologies (catalog number 4989), and anti-p27 (C-19) and anti-actin (C-2) antibodies from Santa Cruz Biotechnology.
Generation of viral transductants for focus formation assay.
Lentiviral vectors based on pTRIPZ and pLCE were produced as described previously (26), by cotransfection with packaging vectors into 293T cells using polyethylenimine (PEI). Titers of pTRIPZ-based vectors were determined using the Lenti-X qRT-PCR titration kit (Clontech), and the vectors were used to infect NIH 3T3 cells at ∼1 × 10⁴ genome copies/cell, resulting in close to 100% transduction efficiency. Two days after infection, pTRIPZ-transduced cells were placed under selection with 1 μg/ml of puromycin. For the primary focus formation assay, cells were treated or not for 4 days with doxycycline (Dox) (1 μg/ml) and seeded at 3 × 10⁵ cells/6-cm dish in triplicates. For primary focus formation assays, cells were maintained with puromycin and with or without Dox for 6 weeks, with three medium changes per week. For crystal violet staining, cells were washed once with cold PBS, fixed with 100% methanol for 20 min at −20°C, stained with 0.1% crystal violet in 20% methanol for 30 min at room temperature and rinsed with water. Foci were counted manually, and the experiment was repeated three independent times.
To establish focus-derived WT and FS cell lines, we isolated foci from Dox-treated WT and FS cell pools using cloning rings. Each clone was expanded in the presence of Dox under subconfluent conditions. For secondary focus formation assays, cells were maintained in the presence or absence of Dox for 10 days and then plated at 105 cells/well in 12-well plates in triplicate, with three medium changes per week. Two weeks into the assay, cells were stained with crystal violet as described above. The experiment was performed three independent times with at least five independent cells clones each.
Titers of pLCE-based lentiviral sponges and the shKap expression vector were determined on NIH 3T3 cells, followed by flow cytometric analysis of green fluorescent protein (GFP) expression on a BD FACSCanto II. Cells were infected at a multiplicity of infection (MOI) of 10, and cells with mean green fluorescence intensities in the top 20% (for sponges) or between the top 40 and 20% (shKap) were sorted. Cells transduced with the control vectors were sorted to match the mean fluorescence intensities (MFI) of the sponge- or shKap-transduced cells. Sorted cells (5 × 10⁴ or 105) were plated per well of 12-well plates for 2 weeks, with three medium changes per week, and then subjected to crystal violet staining. Results from secondary focus formation assays were documented using an Evos XL cell imaging system (Life Technologies) at a magnification of ×2.
Saturation density and cell cycle assays.
Focus derived WT- and FS-transduced cell clones 1 and 2 were seeded in triplicates in 6-cm dishes (3 × 10⁵ cells/dish), with three medium changes per week. Live cells were counted by trypan blue exclusion at day 10 with a TC10 automated cell counter (Bio-Rad). The experiment was performed in independent triplicates. For cell cycle analysis by bromodeoxyuridine (BrdU) incorporation, cells were plated at 105 cells/well in 12-well plates, with three medium changes per week. On day 14, cells were treated with 25 μM BrdU (Calbiochem) for 1 h at 37°C, harvested, washed once with phosphate-buffered saline (PBS), and fixed with 2% paraformaldehyde in PBS for 10 min. Fixed cells were washed twice with PBS and incubated in PBS containing 0.1% Triton X-100 for 10 min. Cells were washed again with PBS and treated with DNase I (Promega) for 45 min. Cells were washed again with PBS, blocked with 5% bovine serum albumin (BSA) in PBS for 45 min, and stained with Alexa Fluor 647 mouse anti-BrdU (clone 3D4; Pharmingen) for 1 h in the dark. Cells were washed with PBS and stained with DAPI (4′,6′-diamidino-2-phenylindole) overnight at 4°C. Sample acquisition was performed using an LSRFortessa cell analyzer (BD Biosciences). The experiment was performed in three independent replicates.
miRNA activity assays.
293T cells were transfected with 0.5 nM control 1 or an equimolar mix of miR-K10a/+1 mirVana mimics (Life Technologies) together with 0.3 μg of pLCE-sK10, pLCE-sCXCR4, or empty pLCE vector using Lipofectamine 2000. At 2 days posttransfection, dual-luciferase assays were conducted as described previously (26).
Bioinformatics.
In order to determine the degree of conservation of photoactivatable-ribonucleoside-enhanced cross-linking and immunoprecipitation (PAR-CLIP)-identified binding sites between the human and mouse genomes, we downloaded the 46way maf alignments from the UCSC Human Genome Browser web page (http://hgdownload.cse.ucsc.edu/goldenPath/hg19/multiz46way/maf/). Custom python scripts were used to extract the corresponding sequences for all 3′UTR PAR-CLIP binding sites from the human and mouse alignments for each of the miRNAs analyzed. miRNA binding sites were considered conserved if the exact match was present in both the human and mouse genomes or if at least a minimal match (i.e., 2 to 7 plus A or 2 to 8) was present in the mouse genome. Baseline gene expression in 3T3 was determined from a published GEO data set GSE32060 using the control sample 3T3-Control-RNA-seq (GSM794848) (27). Paired-end reads were aligned to the mouse reference genome mm10 using TopHat (v2.0.8b) with default parameters. Transcript abundance was determined with Cufflinks (v2.1.1) with expression values calculated in FPKM (fragments per kilobase of exon per million) format, and only mRNAs with an FPKM value of >3 and unambiguous assignment to a human mRNA were listed.
RESULTS
The miR-K10a miRNAs have transforming activity.
To address the role of the miR-K10a miRNAs in the transforming potential of the KapA locus, we constructed a lentiviral vector allowing the doxycycline (Dox)-inducible expression of both KapA and the miR-K10a miRNAs (Fig. 1A). The C terminus of KapA was fused to a 3× Flag epitope to facilitate protein detection. The addition of a C-terminal Flag tag to KapA has previously been shown to not affect the transforming activity of this locus (23). We also constructed a version of the same vector carrying a frameshift (FS) mutation just downstream of the KapA initiation codon, in order to abolish KapA protein expression while retaining expression of the miR-K10a miRNAs. Transduced NIH 3T3 cell pools were established in the absence (“OFF”) of transgene expression, under subconfluent conditions, in order to avoid spontaneous transformation events. Upon treatment with Dox, WT but not FS cultures expressed the KapA protein, as expected (Fig. 1B). In contrast, both WT and FS cultures expressed miR-K10a and miR-K10a+1 at a ratio and expression level typically observed in PEL cell lines (Fig. 1C). Next, untreated and Dox-treated cell lines transduced with the empty control vector or WT and FS vectors were plated for focus formation assays, in order to assess their ability to undergo contact inhibition. These experiments confirmed that the KapA locus has transforming activity. Importantly, WT- and FS-transduced cultures produced similar numbers of foci (Fig. 1D), demonstrating that miR-K10a expression is sufficient for transformation in the absence of KapA expression. Of note, the transforming activity of the locus was weak, and foci were generally observed only after 4 to 6 weeks into the assay.
Transgene expression is required to maintain the transformed phenotype.
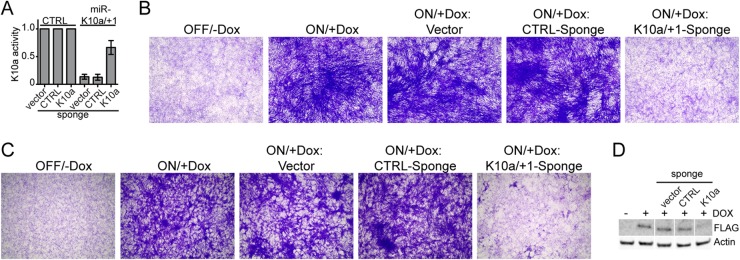
If the observed formation of foci is indeed due to reversible, miRNA-induced changes in gene expression, one would expect the maintenance of the transformed status to require continued transgene expression. This scenario is reminiscent of the “onco-miR addiction” that has been observed in cancers that depend on the expression of cellular oncogenic miRNAs, including miR-155 and miR-21 (for references and additional examples of addictive onco-miRs, see the review by Cheng and Slack [28]). To test our hypothesis, we isolated single transformed foci from WT- and FS-transduced cell pools and expanded focus-derived cell lines in the presence of Dox under subconfluent conditions, in order to avoid spontaneous transformation independent of transgene expression. After initial expansion, cell lines were further cultured in the presence of Dox to maintain transgene expression or Dox was withdrawn for 10 days to turn off transgene expression (Fig. 2A). We confirmed the loss of KapA and miR-K10a/+1 expression following Dox withdrawal by quantitative Western blotting and qRT-PCR (Fig. 2B and C) and plated the resulting cell lines for a second round of focus formation assays. Clonal, focus-derived WT and FS cell lines efficiently retained their transformed status when expanded in the presence of Dox but reverted to a completely nontransformed phenotype upon culture in the absence of Dox (Fig. 2F). Differences in the efficiency of secondary focus formation and cell morphology were observed for different clones of both WT and FS cell lines and did not correlate with the presence of KapA. Consistent with the loss of their transformed phenotype, cell lines that were cultured in the absence of Dox proliferated to smaller numbers than those cultured in the continued presence of Dox when plated close to confluence (Fig. 2D). The loss of the transformed phenotype was also reflected by a reduced percentage of cells in the S phase of the cell cycle (Fig. 2E). Thus, continued transgene expression is clearly required to maintain the transformed phenotype, consistent with transformation being due to reversible miRNA-mediated changes in gene expression.
FIG 2.
Continued transgene expression is required to maintain transformed status. (A) Schematic outlining the experimental setup used for secondary focus formation assays. (B) TaqMan qRT-PCR confirms loss of miR-K10a/+1 expression after withdrawal (−) of Dox for 10 days. miR-K10a/+1 expression levels in cells under continued Dox treatment (+) were in the physiological range observed in the PEL cell lines BC-1 and BC-3. (C) Western blot analysis demonstrates loss of KapA expression in WT cells after withdrawal (−) of Dox for 10 days. FS cells did not express KapA, as expected. (D) Loss of transgene expression after withdrawal (−) of Dox for 10 days results in lower cell densities. Cells were counted 10 days into the assay. Statistically significant differences are indicated (*, P < 0.05; **, P < 0.01 [unpaired t test]; error bars, SD; n = 3). (E) Loss of transgene expression results in reduced proliferation under confluent conditions. WT or FS cells were cultured in the presence (+) or absence (−) of Dox for 10 days, plated close to confluence, and, 14 days later, assayed for incorporation of BrdU. (F) Loss of transgene expression after withdrawal (OFF) of Dox for 10 days results in loss of the transformed phenotype. Data were obtained from 3 independent clones, which were representative of >5 clones each.
Specificity of miR-K10a/+1 transforming activity.
An additional strategy to confirm that the observed transformed phenotype in focus-derived cell lines is in fact due to the expression of the miR-K10a miRNAs is to directly inhibit their expression and/or function in cells that were continuously treated with Dox. To achieve this, we constructed and validated a lentiviral sponge directed against the miR-K10a miRNAs (Fig. 3A). Indeed, FS focus-derived cell lines transduced with the miR-K10a-specific sponge lost their transformed phenotype, while cells transduced with either empty lentiviral vector or a control sponge were indistinguishable from untransduced cells in this assay (Fig. 3B). The miR-K10a/+1 sponge also reversed WT cells to a nontransformed status (Fig. 3C), but we unexpectedly observed that KapA expression was compromised in this setting (Fig. 3D). While this experiment was therefore unable to address whether KapA alone has any transforming activity, it unequivocally established the specificity of the transforming activity of miR-K10a. To directly address whether KapA protein expression also contributes to the transformed phenotype of focus-derived WT cell lines, we transduced these cells with a lentivirus encoding a KapA-directed shRNA (shKap). Western blotting confirmed that shKap caused a strong reduction of KapA expression (Fig. 4A). Because shKap acts in the cytoplasm after nuclear pre-miR-K10a/+1 processing, miR-K10a/+1 expression was unaffected, as expected (Fig. 4B). Despite depletion of the KapA protein, the transformed status of the cell lines was unaffected, suggesting (i) that KapA expression is not required to sustain transformation and (ii) that the miR-K10a/+1-sponge-induced loss of the transformed phenotype of WT cells observed in Fig. 3C is likely due to a loss of miR-K10a/+1 expression.
FIG 3.
Inhibition of mature miR-K10a/+1 results in loss of the transformed phenotype in FS-transformed NIH 3T3 cells. (A) Dual-luciferase reporter assays confirm inhibition of miR-K10a/+1 activity by the miR-K10a/+1 sponge. Activities from the mir-K10a/+1-firefly luciferase reporter were normalized to those from an internal RLuc control. Normalized values obtained from cells expressing miR-K10a/+1 were normalized to those from control cells lacking miR-K10a/+1 expression, which were set at 1. (B) Sponge-mediated inhibition of mature miR-K10a/+1 results in loss of the transformed phenotype in NIH 3T3 cells transformed by FS vectors. The results shown are representative of 3 independent experiments. (C) Sponge-mediated inhibition of mature miR-K10a/+1 results in loss of the transformed phenotype in NIH 3T3 cells transformed by WT vectors. The results shown are representative of 3 independent experiments. (D) Western blot analysis showing unexpected reduction of 3× Flag-tagged KapA expression in WT-cells transduced with the miR-K10a/+1-specific sponge.
FIG 4.
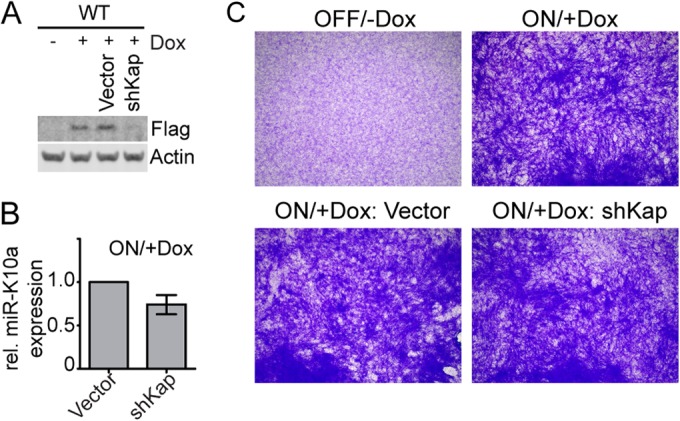
Inhibition of KapA expression does not affect the transformed phenotype in WT-transformed NIH 3T3 cells. (A) Western blotting confirms reduction of KapA expression (Flag) in cells expressing a KapA-directed sh-miR (shKap). (B) TaqMan qRT-PCR shows that miR-K10a/+1 expression was not affected by shKap. (C) shKap-induced inhibition of KapA does not affect the transformed phenotype. The results shown are representative of 3 independent experiments.
Conservation of miR-K10a/+1 targets in mice.
Our observation that the miR-K10a miRNAs alone could account for the transforming activity of the KapA locus in rodent fibroblasts raises the important question whether this result reflects physiological functions of these miRNAs. In this case, the responsible target(s) would have to be conserved between human and mice and to limit transformation in the NIH 3T3 system and cell types relevant to KSHV pathogenesis. The preferential evolutionary conservation of miRNA sequences and their binding sites is thought to reflect the functional importance of these sites in multiple species. However, KSHV has evolved together with its human host for millions of years, and its miRNA sequences are almost all distinct from the sequences of the miRNAs encoded by other gammaherpesviruses. Thus, it is reasonable to assume that the KSHV miRNAs are exquisitely adapted to the human transcriptome and do not necessarily target evolutionarily conserved sites. One important exception to this concept is a small number of KSHV miRNAs that have specifically evolved to access existing regulatory networks through seed sequences identical or similar to those of conserved cellular miRNAs (11, 29–31). We have previously shown that the miR-K10a miRNAs regulate many binding sites of the conserved miR-142-3p miRNAs (11), a result of their related seed sequences, and therefore we hypothesized that many miR-K10a/+1 binding sites might in fact be conserved between humans and mice.
To specifically determine the degree of sequence conservation of candidate binding sites of miR-K10a/+1 between human and mouse, we turned to our published transcriptome-wide analysis of viral and cellular miRNA binding sites in PEL cell lines using photoactivatable-ribonucleoside-enhanced cross-linking and immunoprecipitation (PAR-CLIP) technology (11). We listed the percentage of PAR-CLIP-identified binding sites of miR-K10a and/or miR-K10a+1 that were either minimally or exactly conserved between the human and mouse genomes, based on an alignment of 46 vertebrate genomes obtained from the UCSC genome browser. For comparison, we also analyzed the binding sites of all well-expressed KSHV miRNAs and of several evolutionarily conserved miRNAs that were highly expressed in our data set but lack obvious viral mimics (miR-181, miR-15/16, and miR-21). This analysis suggested that the binding sites of cellular miRNAs are in fact more highly conserved than those of all viral miRNAs that are not mimics of cellular miRNAs (Fig. 5). Candidate binding sites of the miR-K10a miRNAs showed levels of conservation comparable to those of cellular miRNAs. Interestingly, the only viral miRNAs whose candidate binding sites showed even higher conservation were miR-K3 and miR-K3+1, which we have previously identified as viral mimics of cellular miR-23 (30). One obvious caveat of this analysis is that many candidate miR-K10a/+1 binding sites are bioinformatically indistinguishable from binding sites of the miR-142-3p miRNAs (11). However, because our published data clearly show that both miRNAs regulate these “shared” sites (11), our data nevertheless suggest that ∼35% of PAR-CLIP-identified miR-K10a/+1 binding sites are conserved between the human and mouse transcriptomes. On the other hand, our analysis also shows that the majority of binding sites detected in human cells are not conserved in mice. Thus, the rodent model is of only limited utility for the analysis of viral miRNA targeting and function. While not directly addressed by our analysis, it also appears likely that viral miRNAs acquire novel binding sites in the rodent fibroblast model, thus giving rise to off-target effects. Such off-target effects could be due to sequence divergence between mice and humans but also could be due to the cell type-specific differences in gene expression. This caveat limits functional and mechanistic experiments in rodent transformation models.
FIG 5.
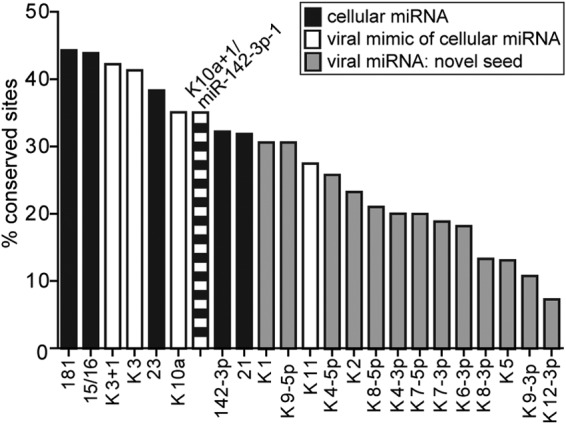
Conservation of PAR-CLIP-identified miRNA binding sites between human and mouse. Sites were scored as conserved if at least a minimal match to the miRNA was present in a two-way alignment between the human and mouse genomes (i.e., base pairing of nt 2 to 8 or of nt 2 to 7 with an A across from nt 1 of the miRNA). White, viral miRNAs that mimic cellular miRNAs; black, cellular miRNAs; gray, viral miRNAs with seed sequences unrelated to cellular miRNAs.
Conserved miR-K10a/+1 targets include inhibitors of transformation.
While experiments on miR-K10a/+1 function are therefore best conducted in the human system, we hypothesized that bioinformatics analyses could nevertheless help identify targets of the miR-K10a miRNAs with likely relevance to KSHV pathogenesis. We therefore listed PAR-CLIP binding sites that are at least minimally conserved between the human and mouse genomes and expressed in NIH 3T3 cells, based on published studies (11, 27). Under the settings used, this analysis identified 191 binding sites of miR-K10a and/or miR-K10a+1 in 179 mRNAs that met these criteria (see Table S1 in the supplemental material). We further mined this list manually to identify a subset of a 10 mRNAs that encode known inhibitors of transformation and may thus serve as good starting point for the analysis of miR-K10a/+1 functions in the human model (Table 1). To illustrate this point, we tested the effect of miR-K10a/+1 expression on two of these targets, i.e., the cell cycle inhibitor p27 and p120-catenin (referred to as p120 here). The cyclin-dependent kinase inhibitor (CDKI) family protein p27 mediates G1 arrest as a consequence of cell-cell contact and other signals, through inhibition of G1 cyclin-CDK complexes (32). p120 stabilizes cadherin-based cell-cell adhesion complexes and links these complexes to the actin skeleton and signal transduction pathways (33). Importantly, we have previously reported that both mRNAs are direct targets of the miR-K10a and miR-142-3p miRNAs and have confirmed the PAR-CLIP-identified binding sites by mutational analyses. Each of the previously confirmed binding sites is conserved between humans and mice (Fig. 6A and B). Using quantitative Western blotting, we confirmed regulation of p27 and p120 by the miR-K10a miRNAs in NIH 3T3 cells (Fig. 6C and D) and in human microvascular endothelial cells (Fig. 6E and F), thereby demonstrating that these proteins are indeed repressed by miR-K10a/+1 in both systems. Interestingly, our list of conserved targets also included BCLAF1, a previously reported target of several KSHV miRNAs (34). Using independently constructed WT and PAR-CLIP site mutant BCLAF1 reporter vectors and mimics of both miR-K10a and miR-K10a+1, we have confirmed the original finding that BCLAF1 reporters do not respond to miR-K10a/+1 expression, while the reporter of another known miR-K10a target (TNFRSF12A/TWEAKR [17]) was repressed as expected (Fig. 6G and H). Thus, the PAR-CLIP-detected binding site in the BCLAF1 mRNA could be a false-positive assignment or the reporter data could be false negative, for example, due to alternative polyadenylation of the reporter. In summary, we conclude that our analysis indeed identified candidate targets with potential relevance to KSHV infection in the human system. Of note, the mRNAs for p27 and p120 were reported to be modestly downregulated in KHSV-infected lymphatic endothelial cells (LECs), which is consistent with their repression by miR-K10a/+1 during infection (35).
TABLE 1.
Subset of candidate or validated targets of the miR-K10a miRNAs with binding sites that are conserved between humans and mice, have known expression in 3T3 cells, and function in the inhibition of transformationa
| Abbreviation | Full name | Reference(s) |
|---|---|---|
| APC | Adenomatous polyposis coli | 38 |
| BCLAF1 | BCL2-associated transcription factor 1 | 39 |
| BRCA1 | Breast cancer 1, early onset | 40, 41 |
| CDKN1B | Cyclin-dependent kinase inhibitor 1B (p27, Kip1) | 42–44 |
| CTNND1 | Catenin (cadherin-associated protein), delta 1 | 45 |
| CUL5 | Cullin 5 | 46 |
| E2F7 | E2F transcription factor 7 | 47 |
| IRF1 | Interferon-regulatory factor 1 | 48 |
| PHF17 | PHD finger protein 17 | 49 |
| RBBP7 | Retinoblastoma binding protein 7 | 50 |
Scored by focus formation and/or soft agar assays. Additional candidate targets with roles in cell growth and cancer included CMTM4, DCBLD2, ECT2, KDM3B, LIMK2, PPM1G, and SPRED1.
FIG 6.

miR-K10a/+1 inhibit p27 and p120 expression in NIH 3T3 and human endothelial cells. (A and B) Sequence alignment showing the previously validated, PAR-CLIP-identified binding sites of miR-K10a/+1 in the CDKN1B and CTNND1 3′UTRs. (C and D) Quantitative Western blot analysis of p27 and p120 expression in clonal FS-derived cell lines cultured for 10 days in the presence or absence of Dox, plated, and measured 14 days into the assay. Differences were statistically significant (P < 0.05 [unpaired t test]; error bars, SD; n = 4 independent experiments). (E and F) Telomerase-immortalized human microvascular endothelial cells (iHMVEC) were transfected with control mimic or equimolar concentrations of miR-K10a/+1 mimics. p27 and p120 expression was analyzed 2 days after transfection. Differences were statistically significant (P < 0.05 [unpaired t test]; error bars, SD; n = 5 independent experiments). (G) PAR-CLIP-identified binding sites for miR-K10a and/or miR-K10a/+1 in the 3′UTRs of TNFRSF12A (encoding TWEAKR) and BCLAF mRNAs. Two-nucleotide seed match mutations introduced in each binding site are indicated above the wt sequence (arrows). (H) miRNA binding sites were tested for regulation in dual luciferase reporter assays using human WT and binding site mutant 3′UTR reporters and either control miRNA or viral miRNA mimics. Data were normalized to an internal RLuc control, control mimic transfected cells, and 3′UTR mutants (error bars, SD; n = 3 independent experiments).
DISCUSSION
More than a decade ago, the KSHV KapA open reading frame was described as a locus with transforming potential in rodent fibroblasts. Since these original studies were conducted, it has been discovered that the KapA ORF also harbors the RNA stem-loop encoding miR-K10a/+1. This finding immediately raises the question whether some of the functions previously attributed to KapA might in fact be those of the embedded miRNAs. Here we show that the two miR-K10a miRNAs alone transform murine fibroblasts and that KapA protein expression is dispensable for transformation by this locus. Our results thus represent a novel example of a noncoding RNA element likely responsible for functions attributed to overlapping or neighboring coding sequences. Future functional work on the Kaposin proteins will therefore have to carefully distinguish functions of the encoded proteins from those of the miR-K10a miRNAs. Our results also raise the obvious new question of whether the transforming potential of the miR-K10a miRNAs reflects their physiological role in KSHV infection. Because the miR-K10a miRNAs access an evolutionarily conserved network of miR-142-3p targets, it is possible that their transforming activity is due to the regulation of conserved targets of miR-142-3p in NIH 3T3 cells and that the same targets are also relevant to the infection of human cells by KSHV and to KSHV pathogenesis. Conserved miR-K10a/+1 candidate targets included several known inhibitors of transformation, suggesting that the mechanism underlying the transforming activity of miR-K10a/+1 could be multifactorial and could largely reflect the regulation of physiologically relevant miR-K10a/+1 targets.
We have not performed experiments to directly elucidate the mechanism underlying the transforming activity of miR-K10a in NIH 3T3 cells, because functional studies of these miRNAs in NIH 3T3 cells are likely to be severely limited in this system by the loss of regulation of many actual targets of miR-K10a/+1, either because the binding sites are not conserved in mice or because the target mRNAs are not expressed in NIH 3T3 cells. An additional caveat to the mechanistic analysis of the miR-K10a/+1 transforming activity in a rodent model is the likely acquisition of numerous off-targets. While we therefore do not know whether the transforming activity in NIH 3T3 cells indeed reflects physiological activities of miR-K10a, our analysis has nevertheless identified a number of candidate targets that may well be relevant to KSHV infection of human cells and may serve as a starting point for further functional studies in the human system. To strengthen this conclusion, we have conducted an initial validation of two of the identified targets, p27 and p120.
p27 is a well-established cell cycle inhibitor at the G1/S transition. In addition to the binding site for miR-K10, the p27 mRNA also bears a validated binding site for KSHV miR-K11 (11). Moreover, KSHV cyclin causes the phosphorylation and inhibition of p27 (36), suggesting that this virus has evolved several strategies to inactivate p27. p27 is highly expressed in proliferating PEL cell lines, and it is currently unknown if further overexpression following inhibition of the miR-K10a miRNAs and miR-K11 would impair cell cycle progression or not. The p27 mRNA was modestly downregulated in de novo KSHV-infected LECs (35), however, raising the possibility that repression of p27 expression may be advantageous in this context. p120 functions as a core component of cadherin-based adherens junctions. While the potential regulation of p120 by KSHV has not been studied, it is known that adherens junctions are disrupted during KSHV latency (37). Because these structures are important for vessel integrity and growth factor signaling in endothelial cells, direct inhibition of p120 expression may represent one of the strategies employed by KSHV to disrupt adherens junctions.
In conclusion, the finding that KSHV and two other primate rhadinoviruses encode miRNAs bearing seeds of miR-K10a and/or miR-K10a+1 suggests that these miRNAs are important for rhadinovirus biology and pathogenesis (7, 11, 15, 16). Already-identified targets and functions of this miRNA include the repression of TWEAK and TGF-β-induced effects on cell proliferation, apoptosis, and cytokine signaling (17, 18). Our new findings that miR-K10a/+1 have transforming activity in rodent fibroblasts and our identification of inhibitors of transformation among miR-K10a/+1 targets further point to an important role of the miR-K10a miRNAs in the pathogenesis of KSHV.
Supplementary Material
ACKNOWLEDGMENTS
The research reported in this publication was supported by the National Cancer Institute of the National Institutes of Health under awards U54CA143869, R00 CA137860, and R01 CA180813, by the Zell Family Foundation and the Robert H. Lurie Comprehensive Cancer Center, and by ACS-IRG-93-037-18 and ACS Illinois Division award 254707. The Northwestern University Flow Cytometry Facility is supported by Cancer Center Support Grant NCI CA060553.
The content is solely the responsibility of the authors and does not necessarily represent the official views of the National Institutes of Health, ACS, or the Zell Family Foundation and the Robert H. Lurie Comprehensive Cancer Center.
We thank Michael Plebanek for technical contributions, Sarah Linnstaedt for helpful comments on the manuscript, and Paul Mehl and Jeffery Nelson in the Northwestern University Flow Cytometry Facility for cell sorting.
Footnotes
Supplemental material for this article may be found at http://dx.doi.org/10.1128/JVI.03317-14.
REFERENCES
- 1.Chang Y, Cesarman E, Pessin MS, Lee F, Culpepper J, Knowles DM, Moore PS. 1994. Identification of herpesvirus-like DNA sequences in AIDS-associated Kaposi's sarcoma. Science 266:1865–1869. doi: 10.1126/science.7997879. [DOI] [PubMed] [Google Scholar]
- 2.Cesarman E, Chang Y, Moore PS, Said JW, Knowles DM. 1995. Kaposi's sarcoma-associated herpesvirus-like DNA sequences in AIDS-related body-cavity-based lymphomas. N Engl J Med 332:1186–1191. doi: 10.1056/NEJM199505043321802. [DOI] [PubMed] [Google Scholar]
- 3.Gottwein E. 2012. Kaposi's sarcoma-associated herpesvirus microRNAs. Front Microbiol 3:165. doi: 10.3389/fmicb.2012.00165. [DOI] [PMC free article] [PubMed] [Google Scholar]
- 4.Kincaid RP, Sullivan CS. 2012. Virus-encoded microRNAs: an overview and a look to the future. PLoS Pathog 8:e1003018. doi: 10.1371/journal.ppat.1003018. [DOI] [PMC free article] [PubMed] [Google Scholar]
- 5.Bartel DP. 2009. MicroRNAs: target recognition and regulatory functions. Cell 136:215–233. doi: 10.1016/j.cell.2009.01.002. [DOI] [PMC free article] [PubMed] [Google Scholar]
- 6.Grundhoff A, Sullivan CS, Ganem D. 2006. A combined computational and microarray-based approach identifies novel microRNAs encoded by human gamma-herpesviruses. RNA 12:733–750. doi: 10.1261/rna.2326106. [DOI] [PMC free article] [PubMed] [Google Scholar]
- 7.Cai X, Lu S, Zhang Z, Gonzalez CM, Damania B, Cullen BR. 2005. Kaposi's sarcoma-associated herpesvirus expresses an array of viral microRNAs in latently infected cells. Proc Natl Acad Sci U S A 102:5570–5575. doi: 10.1073/pnas.0408192102. [DOI] [PMC free article] [PubMed] [Google Scholar]
- 8.Pfeffer S, Sewer A, Lagos-Quintana M, Sheridan R, Sander C, Grasser FA, van Dyk LF, Ho CK, Shuman S, Chien M, Russo JJ, Ju J, Randall G, Lindenbach BD, Rice CM, Simon V, Ho DD, Zavolan M, Tuschl T. 2005. Identification of microRNAs of the herpesvirus family. Nat Methods 2:269–276. doi: 10.1038/nmeth746. [DOI] [PubMed] [Google Scholar]
- 9.Samols MA, Hu J, Skalsky RL, Renne R. 2005. Cloning and identification of a microRNA cluster within the latency-associated region of Kaposi's sarcoma-associated herpesvirus. J Virol 79:9301–9305. doi: 10.1128/JVI.79.14.9301-9305.2005. [DOI] [PMC free article] [PubMed] [Google Scholar]
- 10.Umbach JL, Cullen BR. 2010. In-depth analysis of Kaposi's sarcoma-associated herpesvirus microRNA expression provides insights into the mammalian microRNA-processing machinery. J Virol 84:695–703. doi: 10.1128/JVI.02013-09. [DOI] [PMC free article] [PubMed] [Google Scholar]
- 11.Gottwein E, Corcoran DL, Mukherjee N, Skalsky RL, Hafner M, Nusbaum JD, Shamulailatpam P, Love CL, Dave SS, Tuschl T, Ohler U, Cullen BR. 2011. Viral microRNA targetome of KSHV-infected primary effusion lymphoma cell lines. Cell Host Microbe 10:515–526. doi: 10.1016/j.chom.2011.09.012. [DOI] [PMC free article] [PubMed] [Google Scholar]
- 12.Gandy SZ, Linnstaedt SD, Muralidhar S, Cashman KA, Rosenthal LJ, Casey JL. 2007. RNA editing of the human herpesvirus 8 kaposin transcript eliminates its transforming activity and is induced during lytic replication. J Virol 81:13544–13551. doi: 10.1128/JVI.01521-07. [DOI] [PMC free article] [PubMed] [Google Scholar]
- 13.Lin YT, Kincaid RP, Arasappan D, Dowd SE, Hunicke-Smith SP, Sullivan CS. 2010. Small RNA profiling reveals antisense transcription throughout the KSHV genome and novel small RNAs. RNA 16:1540–1558. doi: 10.1261/rna.1967910. [DOI] [PMC free article] [PubMed] [Google Scholar]
- 14.Lin YT, Sullivan CS. 2011. Expanding the role of Drosha to the regulation of viral gene expression. Proc Natl Acad Sci U S A 108:11229–11234. doi: 10.1073/pnas.1105799108. [DOI] [PMC free article] [PubMed] [Google Scholar]
- 15.Bruce AG, Ryan JT, Thomas MJ, Peng X, Grundhoff A, Tsai CC, Rose TM. 2013. Next-generation sequence analysis of the genome of RFHVMn, the macaque homolog of Kaposi's sarcoma (KS)-associated herpesvirus, from a KS-like tumor of a pig-tailed macaque. J Virol 87:13676–13693. doi: 10.1128/JVI.02331-13. [DOI] [PMC free article] [PubMed] [Google Scholar]
- 16.Umbach JL, Strelow LI, Wong SW, Cullen BR. 2010. Analysis of rhesus rhadinovirus microRNAs expressed in virus-induced tumors from infected rhesus macaques. Virology 405:592–599. doi: 10.1016/j.virol.2010.06.036. [DOI] [PMC free article] [PubMed] [Google Scholar]
- 17.Abend JR, Ramalingam D, Kieffer-Kwon P, Uldrick TS, Yarchoan R, Ziegelbauer JM. 2012. KSHV microRNAs target two components of the TLR/IL-1R signaling cascade, IRAK1 and MYD88, to reduce inflammatory cytokine expression. J Virol 86:11663–11674. doi: 10.1128/JVI.01147-12. [DOI] [PMC free article] [PubMed] [Google Scholar]
- 18.Lei X, Zhu Y, Jones T, Bai Z, Huang Y, Gao SJ. 2012. A KSHV microRNA and its variants target TGF-beta pathway to promote cell survival. J Virol 86:11698–116711. doi: 10.1128/JVI.06855-11. [DOI] [PMC free article] [PubMed] [Google Scholar]
- 19.Kliche S, Nagel W, Kremmer E, Atzler C, Ege A, Knorr T, Koszinowski U, Kolanus W, Haas J. 2001. Signaling by human herpesvirus 8 kaposin A through direct membrane recruitment of cytohesin-1. Mol Cell 7:833–843. doi: 10.1016/S1097-2765(01)00227-1. [DOI] [PubMed] [Google Scholar]
- 20.Russo JJ, Bohenzky RA, Chien MC, Chen J, Yan M, Maddalena D, Parry JP, Peruzzi D, Edelman IS, Chang Y, Moore PS. 1996. Nucleotide sequence of the Kaposi sarcoma-associated herpesvirus (HHV8). Proc Natl Acad Sci U S A 93:14862–14867. doi: 10.1073/pnas.93.25.14862. [DOI] [PMC free article] [PubMed] [Google Scholar]
- 21.Muralidhar S, Pumfery AM, Hassani M, Sadaie MR, Kishishita M, Brady JN, Doniger J, Medveczky P, Rosenthal LJ. 1998. Identification of kaposin (open reading frame K12) as a human herpesvirus 8 (Kaposi's sarcoma-associated herpesvirus) transforming gene. J Virol 72:4980–4988. [DOI] [PMC free article] [PubMed] [Google Scholar]
- 22.Muralidhar S, Veytsmann G, Chandran B, Ablashi D, Doniger J, Rosenthal LJ. 2000. Characterization of the human herpesvirus 8 (Kaposi's sarcoma-associated herpesvirus) oncogene, kaposin (ORF K12). J Clin Virol 16:203–213. doi: 10.1016/S1386-6532(99)00081-5. [DOI] [PubMed] [Google Scholar]
- 23.Tomkowicz B, Singh SP, Cartas M, Srinivasan A. 2002. Human herpesvirus-8 encoded Kaposin: subcellular localization using immunofluorescence and biochemical approaches. DNA Cell Biol 21:151–162. doi: 10.1089/10445490252925413. [DOI] [PubMed] [Google Scholar]
- 24.Sadler R, Wu L, Forghani B, Renne R, Zhong W, Herndier B, Ganem D. 1999. A complex translational program generates multiple novel proteins from the latently expressed kaposin (K12) locus of Kaposi's sarcoma-associated herpesvirus. J Virol 73:5722–5730. [DOI] [PMC free article] [PubMed] [Google Scholar]
- 25.Arias C, Weisburd B, Stern-Ginossar N, Mercier A, Madrid AS, Bellare P, Holdorf M, Weissman JS, Ganem D. 2014. KSHV 2.0: a comprehensive annotation of the Kaposi's sarcoma-associated herpesvirus genome using next-generation sequencing reveals novel genomic and functional features. PLoS Pathog 10:e1003847. doi: 10.1371/journal.ppat.1003847. [DOI] [PMC free article] [PubMed] [Google Scholar]
- 26.Gottwein E, Cullen BR. 2010. A human herpesvirus microRNA inhibits p21 expression and attenuates p21-mediated cell cycle arrest. J Virol 84:5229–5237. doi: 10.1128/JVI.00202-10. [DOI] [PMC free article] [PubMed] [Google Scholar]
- 27.Shalgi R, Hurt JA, Krykbaeva I, Taipale M, Lindquist S, Burge CB. 2013. Widespread regulation of translation by elongation pausing in heat shock. Mol Cell 49:439–452. doi: 10.1016/j.molcel.2012.11.028. [DOI] [PMC free article] [PubMed] [Google Scholar]
- 28.Cheng CJ, Slack FJ. 2012. The duality of oncomiR addiction in the maintenance and treatment of cancer. Cancer J 18:232–237. doi: 10.1097/PPO.0b013e318258b75b. [DOI] [PMC free article] [PubMed] [Google Scholar]
- 29.Skalsky RL, Samols MA, Plaisance KB, Boss IW, Riva A, Lopez MC, Baker HV, Renne R. 2007. Kaposi's sarcoma-associated herpesvirus encodes an ortholog of miR-155. J Virol 81:12836–12845. doi: 10.1128/JVI.01804-07. [DOI] [PMC free article] [PubMed] [Google Scholar]
- 30.Manzano M, Shamulailatpam P, Raja AN, Gottwein E. 2013. Kaposi's sarcoma-associated herpesvirus encodes a mimic of cellular miR-23. J Virol 87:11821–11830. doi: 10.1128/JVI.01692-13. [DOI] [PMC free article] [PubMed] [Google Scholar]
- 31.Gottwein E, Mukherjee N, Sachse C, Frenzel C, Majoros WH, Chi JT, Braich R, Manoharan M, Soutschek J, Ohler U, Cullen BR. 2007. A viral microRNA functions as an orthologue of cellular miR-155. Nature 450:1096–1099. doi: 10.1038/nature05992. [DOI] [PMC free article] [PubMed] [Google Scholar]
- 32.Besson A, Dowdy SF, Roberts JM. 2008. CDK inhibitors: cell cycle regulators and beyond. Dev Cell 14:159–169. doi: 10.1016/j.devcel.2008.01.013. [DOI] [PubMed] [Google Scholar]
- 33.Reynolds AB. 2007. p120-catenin: past and present. Biochim Biophys Acta 1773:2–7. doi: 10.1016/j.bbamcr.2006.09.019. [DOI] [PMC free article] [PubMed] [Google Scholar]
- 34.Ziegelbauer JM, Sullivan CS, Ganem D. 2009. Tandem array-based expression screens identify host mRNA targets of virus-encoded microRNAs. Nat Genet 41:130–134. doi: 10.1038/ng.266. [DOI] [PMC free article] [PubMed] [Google Scholar]
- 35.Hansen A, Henderson S, Lagos D, Nikitenko L, Coulter E, Roberts S, Gratrix F, Plaisance K, Renne R, Bower M, Kellam P, Boshoff C. 2010. KSHV-encoded miRNAs target MAF to induce endothelial cell reprogramming. Genes Dev 24:195–205. doi: 10.1101/gad.553410. [DOI] [PMC free article] [PubMed] [Google Scholar]
- 36.Sarek G, Jarviluoma A, Ojala PM. 2006. KSHV viral cyclin inactivates p27KIP1 through Ser10 and Thr187 phosphorylation in proliferating primary effusion lymphomas. Blood 107:725–732. doi: 10.1182/blood-2005-06-2534. [DOI] [PubMed] [Google Scholar]
- 37.Guilluy C, Zhang Z, Bhende PM, Sharek L, Wang L, Burridge K, Damania B. 2011. Latent KSHV infection increases the vascular permeability of human endothelial cells. Blood 118:5344–5354. doi: 10.1182/blood-2011-03-341552. [DOI] [PMC free article] [PubMed] [Google Scholar]
- 38.Park KS, Jeon SH, Kim SE, Bahk YY, Holmen SL, Williams BO, Chung KC, Surh YJ, Choi KY. 2006. APC inhibits ERK pathway activation and cellular proliferation induced by RAS. J Cell Sci 119:819–827. doi: 10.1242/jcs.02779. [DOI] [PubMed] [Google Scholar]
- 39.Kasof GM, Goyal L, White E. 1999. Btf, a novel death-promoting transcriptional repressor that interacts with Bcl-2-related proteins. Mol Cell Biol 19:4390–4404. [DOI] [PMC free article] [PubMed] [Google Scholar]
- 40.Rao VN, Shao N, Ahmad M, Reddy ES. 1996. Antisense RNA to the putative tumor suppressor gene BRCA1 transforms mouse fibroblasts. Oncogene 12:523–528. [PubMed] [Google Scholar]
- 41.Wang Q, Zhang H, Kajino K, Greene MI. 1998. BRCA1 binds c-Myc and inhibits its transcriptional and transforming activity in cells. Oncogene 17:1939–1948. doi: 10.1038/sj.onc.1202403. [DOI] [PubMed] [Google Scholar]
- 42.Miller JP, Yeh N, Hofstetter CP, Keskin D, Goldstein AS, Koff A. 2012. p27kip1 protein levels reflect a nexus of oncogenic signaling during cell transformation. J Biol Chem 287:19775–19785. doi: 10.1074/jbc.M112.361972. [DOI] [PMC free article] [PubMed] [Google Scholar]
- 43.Vidal A, Millard SS, Miller JP, Koff A. 2002. Rho activity can alter the translation of p27 mRNA and is important for RasV12-induced transformation in a manner dependent on p27 status. J Biol Chem 277:16433–16440. doi: 10.1074/jbc.M112090200. [DOI] [PubMed] [Google Scholar]
- 44.Yang HY, Shao R, Hung MC, Lee MH. 2001. p27 Kip1 inhibits HER2/neu-mediated cell growth and tumorigenesis. Oncogene 20:3695–3702. doi: 10.1038/sj.onc.1204472. [DOI] [PubMed] [Google Scholar]
- 45.Wildenberg GA, Dohn MR, Carnahan RH, Davis MA, Lobdell NA, Settleman J, Reynolds AB. 2006. p120-catenin and p190RhoGAP regulate cell-cell adhesion by coordinating antagonism between Rac and Rho. Cell 127:1027–1039. doi: 10.1016/j.cell.2006.09.046. [DOI] [PubMed] [Google Scholar]
- 46.Laszlo GS, Cooper JA. 2009. Restriction of Src activity by Cullin-5. Curr Biol 19:157–162. doi: 10.1016/j.cub.2008.12.007. [DOI] [PMC free article] [PubMed] [Google Scholar]
- 47.Aksoy O, Chicas A, Zeng T, Zhao Z, McCurrach M, Wang X, Lowe SW. 2012. The atypical E2F family member E2F7 couples the p53 and RB pathways during cellular senescence. Genes Dev 26:1546–1557. doi: 10.1101/gad.196238.112. [DOI] [PMC free article] [PubMed] [Google Scholar]
- 48.Tanaka N, Ishihara M, Kitagawa M, Harada H, Kimura T, Matsuyama T, Lamphier MS, Aizawa S, Mak TW, Taniguchi T. 1994. Cellular commitment to oncogene-induced transformation or apoptosis is dependent on the transcription factor IRF-1. Cell 77:829–839. doi: 10.1016/0092-8674(94)90132-5. [DOI] [PubMed] [Google Scholar]
- 49.Zeng L, Bai M, Mittal AK, El-Jouni W, Zhou J, Cohen DM, Zhou MI, Cohen HT. 2013. Candidate tumor suppressor and pVHL partner Jade-1 binds and inhibits AKT in renal cell carcinoma. Cancer Res 73:5371–5380. doi: 10.1158/0008-5472.CAN-12-4707. [DOI] [PMC free article] [PubMed] [Google Scholar]
- 50.Guan LS, Li GC, Chen CC, Liu LQ, Wang ZY. 2001. Rb-associated protein 46 (RbAp46) suppresses the tumorigenicity of adenovirus-transformed human embryonic kidney 293 cells. Int J Cancer 93:333–338. doi: 10.1002/ijc.1338. [DOI] [PubMed] [Google Scholar]
Associated Data
This section collects any data citations, data availability statements, or supplementary materials included in this article.