

ABSTRACT
Human noroviruses are the dominant cause of outbreaks of gastroenteritis around the world. Human noroviruses interact with the polymorphic human histo-blood group antigens (HBGAs), and this interaction is thought to be important for infection. Indeed, synthetic HBGAs or HBGA-expressing enteric bacteria were shown to enhance norovirus infection in B cells. A number of studies have found a possible relationship between HBGA type and norovirus susceptibility. The genogroup II, genotype 4 (GII.4) noroviruses are the dominant cluster, evolve every other year, and are thought to modify their binding interactions with different HBGA types. Here we show high-resolution X-ray crystal structures of the capsid protruding (P) domains from epidemic GII.4 variants from 2004, 2006, and 2012, cocrystallized with a panel of HBGA types (H type 2, Lewis Y, Lewis B, Lewis A, Lewis X, A type, and B type). Many of the HBGA binding interactions were found to be complex, involving capsid loop movements, alternative HBGA conformations, and HBGA rotations. We showed that a loop (residues 391 to 395) was elegantly repositioned to allow for Lewis Y binding. This loop was also slightly shifted to provide direct hydrogen- and water-mediated bonds with Lewis B. We considered that the flexible loop modulated Lewis HBGA binding. The GII.4 noroviruses have dominated outbreaks over the past decade, which may be explained by their exquisite HBGA binding mechanisms, their fondness for Lewis HBGAs, and their temporal amino acid modifications.
IMPORTANCE Our data provide a comprehensive picture of GII.4 P domain and HBGA binding interactions. The exceptionally high resolutions of our X-ray crystal structures allowed us to accurately recognize novel GII.4 P domain interactions with numerous HBGA types. We showed that the GII.4 P domain-HBGA interactions involved complex binding mechanisms that were not previously observed in norovirus structural studies. Many of the GII.4 P domain-HBGA interactions we identified were negative in earlier enzyme-linked immunosorbent assay (ELISA)-based studies. Altogether, our data show that the GII.4 norovirus P domains can accommodate numerous HBGA types.
INTRODUCTION
Human noroviruses are responsible for most epidemic outbreaks of gastroenteritis. There are still no antivirals or vaccines approved, despite the discovery of these viruses over 4 decades ago (1). Noroviruses are genetically and antigenically diverse (2), yet a single genetic cluster (genogroup II, genotype 4 [GII.4]) has dominated over the past decade (3). The GII.4 noroviruses evolve ∼5% every year and are believed to have a mechanism that allows them to evade the immune system or alter receptor binding profiles (4–6). However, immunity to noroviruses is still poorly understood (7).
Human noroviruses interact with histo-blood group antigens (HBGAs), and this is thought to be important for viral infections (8–11). A recent report showed for the first time that human noroviruses infect B cells and that HBGAs (synthetic or from HBGA-expressing enteric bacteria) can enhance the infection (12). HBGAs are also found as soluble antigens in saliva and are expressed on epithelial cells. Genetic polymorphisms in genes that control their synthesis are known to provide intraspecies diversity (13). To date, based on the ABH and Lewis HBGA types, at least nine different HBGAs have been found to interact with human noroviruses. Individuals expressing the O type are thought to have a significantly higher infection rate than those for individuals with other blood types (11). The GII noroviruses are thought to have preferences for HBGAs in a strain-dependent manner (14–19).
Expression of the norovirus capsid protein in insect cells results in the formation of virus-like particles (VLPs) that are antigenically similar to native virions. The X-ray crystal structure of prototype (GI.1) norovirus VLPs identified two domains: the shell (S) and protruding (P) domains (20). The S domain forms a scaffold surrounding the viral RNA, whereas the P domain is thought to contain the determinants for cell attachment and strain diversity. The P domain can be further subdivided into P1 and P2 subdomains, and each subdomain likely has unique functions. In this study, we determined the X-ray crystal structures of P domains from three epidemic GII.4 variants, from 2004, 2006, and 2012, in complex with a panel of HBGAs in order to elucidate HBGA binding mechanisms. Our data showed that the GII.4 noroviruses bound numerous HBGA types and that binding involved complex interactions, including P domain loop movements and alternative HBGA conformations. Importantly, many of our new findings challenge previous enzyme-linked immunosorbent assay (ELISA)-based studies and reveal interactions that have not been recognized so far (4–6). Altogether, our data show that the GII.4 noroviruses are capable of binding diverse HBGA types, which may correlate with a larger proportion of the human population being susceptible to GII.4 infections.
MATERIALS AND METHODS
Sequence analysis and expression and purification of the P domain.
The P domain amino acid sequences from four GII.4 variants, from 1998, 2004, 2006, and 2012 (termed VA387-1998 [PBD entry 2OBS], Farm-2004 [GenBank accession number JQ478408], Saga-2006 [accession number AB447457], and NSW-2012 [accession number JX459908], respectively), were aligned using Clustal X. The Farm-2004, Saga-2006, and NSW-2012 P domains (residues 224 to 538) were expressed in Escherichia coli and purified as previously described (21). Briefly, the codon-optimized P domains were cloned into a modified expression vector (pMal-c2X) and transformed into E. coli BL21 cells for protein expression. Transformed cells were grown in LB medium supplemented with 100 μg/ml ampicillin for 4 h at 37°C. Expression was induced with 0.75 mM IPTG (isopropyl-β-d-thiogalactopyranoside) at an optical density at 600 nm (OD600) of 0.7 for 18 h at 22°C. Cells were harvested by centrifugation at 6,000 rpm for 15 min and disrupted by sonication on ice. A His-tagged P domain protein was purified from a Ni column (Qiagen) and digested with HRV-3C protease (Novagen) overnight at 4°C. Cleaved P domains were separated on the Ni column and dialyzed in gel filtration buffer (25 mM Tris-HCl and 300 mM NaCl) overnight at 4°C. The P domains were purified by size-exclusion chromatography, concentrated to 3 to 7 mg/ml, and stored in gel filtration buffer at 4°C.
Crystallization of norovirus P domains.
Crystals were grown in a 1:1 mixture of protein sample and mother liquor for 2 to 6 days at 18°C. Farm-2004 P domain crystals were grown in 20% polyethylene glycol 3350 (PEG 3350) and 0.2 M magnesium formate, Saga-2006 crystals were grown in 3 M sodium acetate (pH 6.9), and NSW-2012 crystals were grown in 20% PEG 3350 and 0.2 M sodium formate. Farm-2004, Saga-2006, and NSW-2012 formed long, rod-shaped crystals, diamond-shaped crystals, and both diamond- and plate-shaped crystals, respectively. For the P domain and HBGA complexes, we cocrystallized a 30× to 60× molar excess of HBGAs (Dextra, United Kingdom). Prior to flash freezing, crystals were transferred to a cryoprotectant containing mother liquor, a 30× molar excess of HBGAs, and 30% ethylene glycol or glycerol. Unfortunately, we were unable to produce complex crystals for all P domains and HBGAs, and soaking experiments with HBGAs produced crystals with high mosaicity and/or the crystals dissolved.
Data collection, structure solution, and refinement.
X-ray diffraction data were collected at the European Synchrotron Radiation Facility, France, at beamlines BM30A and ID23-1, and were processed with XDS (22). Structures were solved using molecular replacement in PHASER (23). The Saga-2006 P domain was determined by molecular replacement using the previously solved GII.10 P domain as a search model (21). The Saga-2006 P domain was then used to determine the structures of the Farm-2004 and NSW-2012 P domains. The Farm-2004 P domain formed crystals in space group P212121, while the Saga-2006 and NSW-2012 P domains were both solved in space group C2. Structures were refined in multiple rounds of manual model building in COOT (24), with subsequent refinement with PHENIX (25). The HBGAs were added to the models at the final stages of structural refinement in order to reduce bias during refinement. Structures were validated with Molprobity (26) and Procheck (27). HBGA interactions were analyzed using Accelrys Discovery Studio (version 4.1), with hydrogen bonding interaction distances of 2.4 to 3.5 Å and hydrophobic interaction distances of 3.4 to 4.5 Å. Figures and protein contact potentials were generated using PyMOL (version 1.12r3pre).
Protein structure accession numbers.
Atomic coordinates and structure factors were deposited in the Protein Data Bank (PDB) under accession numbers 4OOV, 4OOX, 4OOS, 4X05, 4OPS, 4WZK, 4X07, 4X06, 4WZL, 4OPO, 4WZE, 4WZT, 4OP7, and 4X0C.
RESULTS
Structures of unliganded GII.4 P domains.
Three globally important epidemic GII.4 noroviruses, from 2004, 2006, and 2012 (Farm-2004, Saga-2006, and NSW-2012 [also known as Sydney 2012], respectively), were selected for P domain and HBGA binding analysis using X-ray crystallography (Fig. 1). Most of the amino acid variations were observed in the P2 subdomains. Data statistics for GII.4 P domain apo structures are provided in Table 1. The P1 subdomains comprised residues 224 to 274 and 418 to 530, whereas the P2 subdomains were between residues 275 and 417 (Fig. 2). Similar to that of other human noroviruses, the P1 subdomain comprised β-sheets and one α-helix, while the P2 subdomain contained six antiparallel β-strands that formed a barrel-like structure. Overall, the GII.4 P dimer structures were similar, with a maximum root mean square deviation (RMSD) of 0.52 (Fig. 2D). This result corresponded well with the high sequence identities (93 to 95%) and the amino acid sequence alignment (Fig. 1). In order to follow GII.4 P domain evolution, amino acid changes from an earlier GII.4 P domain (from 1998) were projected onto the Farm-2004, Saga-2006, and NSW-2012 P dimer surfaces (Fig. 3). Most amino acid changes were surface exposed, and ∼50% of these became fixed over the years. The region immediately beneath the HBGA binding pocket showed little variation, whereas the surrounding regions contained only a few amino changes. This result suggested that the HBGA pocket is stable and likely contains important functions.
FIG 1.

Amino acid alignment of norovirus GII.4 variants. The P domain amino acid sequences of four GII.4 variants, from 1998, 2004, 2006, and 2012 (termed VA387-1998, Farm-2004, Saga-2006, and NSW-2012, respectively), were aligned using Clustal X. The capsid sequences shared 93 to 95% amino acid identity. The S domain was highly conserved, with only seven amino acid differences (not shown), whereas the P1 (red) and P2 (yellow) subdomains were more variable. The common set of amino acids interacting with HBGAs is shaded in blue (chain A) and green (chain B). Compared to the sequence of the earlier discovered GII.4 variant P domain (VA387-1998), one amino acid insertion was observed in 2004 and remained in 2006 and 2012.
TABLE 1.
Data collection and refinement statistics for GII.4 P domain apo structuresa
| Parameter | Value or description |
||
|---|---|---|---|
| Farm-2004 (PDB entry 4OOV) | Saga-2006 (PDB entry 4OOX) | NSW-2012 (PDB entry 4OOS) | |
| Data collection parameters | |||
| Space group | P212121 | C2 | C2 |
| Cell dimensions | |||
| a,b,c (Å) | 62.95, 90.12, 109.21 | 96.72, 58.94, 62.14 | 98.48, 55.07, 63.46 |
| α, β, γ (°) | 90, 90, 90 | 90, 119.88, 90 | 90, 120.10, 90 |
| Resolution range (Å) | 46.70–1.50 (1.55–1.50) | 48.22–1.03 (1.07–1.03) | 46.25–1.60 (1.66–1.60) |
| Rmerge | 7.48 (54.74) | 3.40 (52.85) | 4.43 (24.53) |
| I/σI | 14.18 (2.37) | 15.12 (1.93) | 20.63 (5.12) |
| Completeness (%) | 99.24 (97.64) | 96.03 (90.00) | 98.14 (94.97) |
| Redundancy | 4.9 (4.1) | 3.0 (2.7) | 3.5 (3.3) |
| Refinement parameters | |||
| Resolution range (Å) | 46.70–1.53 | 27.17–1.20 | 42.60–1.64 |
| No. of reflections | 93,719 | 92,504 | 35,573 |
| Rwork/Rfree | 14.08/16.41 | 11.96/14.32 | 13.77/16.15 |
| No. of atoms | 10,090 | 4,975 | 5,021 |
| Protein | 4,755 | 2,436 | 2,406 |
| Ligand/ion | 32 | 40 | 24 |
| Water | 778 | 295 | 318 |
| Avg B factor (Å2) | |||
| Protein | 13.80 | 13.90 | 12.90 |
| Ligand/ion | 22.30 | 22.90 | 18.80 |
| Water | 26.40 | 26.00 | 23.30 |
| RMSD | |||
| Bond length (Å) | 0.009 | 0.010 | 0.005 |
| Bond angle (°) | 1.29 | 1.38 | 1.09 |
The data sets were collected from single crystals. Values in parentheses are for the highest-resolution shell.
FIG 2.

X-ray crystal structures of unbound GII.4 P domains. (A) The Farm-2004 P domain apo structure contained one dimer per asymmetric unit. The P domain was subdivided into P1 (chain A in pink and chain B in pale cyan) and P2 (chain A in green cyan and chain B in light magenta) subdomains. (B) The Saga-2006 P domain apo structure contained one monomer per asymmetric unit (a dimer is shown) and was subdivided into P1 (chain A in brown and chain B in yellow-orange) and P2 (chain A in deep teal and chain B in dirty violet) subdomains. (C) The NSW-2012 P domain apo structure contained one monomer per asymmetric unit (a dimer is shown) and was subdivided into P1 (chain A in lime and chain B in marine) and P2 (chain A in blue-white and chain B in teal) subdomains. (D) Superposition of the Farm-2004, Saga-2006, and NSW-2012 P dimers revealed that their overall structures were similar.
FIG 3.

Amino acid variations in GII.4 P dimers from 2004, 2006, and 2012 variants. Amino acid changes (red) were highlighted on GII.4 P dimers (side and top views). The changes were numbered according to a change from 1998 to the respective year (labeled once). A cumulative addition of amino acid changes was found. (A) Farm-2004 contained a single amino acid insertion, Gly394, and this remained in 2012. A small number of amino acid changes surrounding the HBGA pocket (black circle), i.e., I389V, L375F, and Q376E, was observed. (B) Saga-2006 contained additional changes, several of which became fixed, e.g., L375F and Q376E. (C) NSW-2012 showed the majority of changes, including several changes in the P1 subdomain.
Structure of 2006 GII.4 P domain–H2-tri complex.
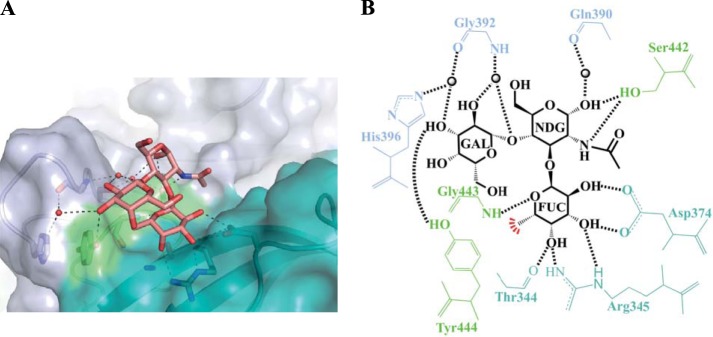
The HBGAs chosen for this study were involved in a primary biosynthetic pathway and were previously analyzed in ELISA-based studies (8, 10, 11, 28–31). Data collection and refinement statistics for P domain-HBGA complex structures are provided in Tables 2, 3, and 4. The H2 trisaccharide (H2-tri) contains a single ABH fucose moiety. Two H2-tri moieties bound to the Saga-2006 P dimer. The electron density was well defined for all three saccharide units, indicating that the HBGA was firmly held by the P domain (Fig. 4). The H2-tri unit was held in place by a network of hydrophilic and hydrophobic interactions at the dimeric interface (Fig. 5A and B). The fucose was held by six direct hydrogen bonds: two from the side chain of Asp374, two from the side chain of Arg345, one from the main chain of Thr344, and one from the main chain of Gly443. A hydrophobic interaction was provided from Tyr444. These five amino acids (Thr344, Arg345, Asp374, Gly443, and Tyr444) were the common set of residues involved in other GII P-HBGA binding interactions at this “regular pocket” (21). The central galactose of H2-tri was held by two hydrogen bonds from the side chain of Ser442, while the terminal N-acetylglucosamine was held by one hydrogen bond from the main chain of Gly392. A number of water-mediated interactions were also observed for Saga-2006–H2-tri.
TABLE 2.
Data collection and refinement statistics for Farm-2004 P domain and HBGA complex structuresa
| Parameter | Value or description |
|
|---|---|---|
| B-tri (PDB entry 4X05) | Leb-tetra (PDB entry 4OPS) | |
| Data collection parameters | ||
| Space group | C2 | P212121 |
| Cell dimensions | ||
| a,b,c (Å) | 175.11, 89.54, 106.73 | 71.45, 90.11, 91.87 |
| α, β, γ (°) | 90, 127.55, 90 | 90, 90, 90 |
| Resolution range (Å) | 19.89–1.96 (2.01–1.96) | 47.81–1.75 (1.79–1.75) |
| Rmerge | 15.8 (113.90) | 11.20 (53.53) |
| I/σI | 8.89 (1.29) | 9.88 (2.41) |
| Completeness (%) | 99.10 (99.30) | 97.30 (95.10) |
| Redundancy | 5.5 (4.7) | 5.5 (5.7) |
| Refinement parameters | ||
| Resolution range (Å) | 19.89–1.98 | 47.81–1.76 |
| No. of reflections | 90,505 | 57,869 |
| Rwork/Rfree | 16.30/20.31 | 18.50/21.64 |
| No. of atoms | 10,774 | 9,541 |
| Protein | 9,437 | 4,723 |
| Ligand/ion | 132 | 46 |
| Water | 12,045 | 324 |
| Avg B factor (Å2) | ||
| Protein | 22.70 | 23.20 |
| Ligand/ion | 43.00 | 57.20 |
| Water | 31.20 | 26.80 |
| RMSD | ||
| Bond lengths (Å) | 0.008 | 0.013 |
| Bond angles (°) | 1.10 | 1.36 |
The data sets were collected from single crystals. Values in parentheses are for the highest-resolution shell.
TABLE 3.
Data collection and refinement statistics for Saga-2006 P domain and HBGA complex structuresa
| Parameter | Value or description |
|||||
|---|---|---|---|---|---|---|
| H2-tri (PDB entry 4WZK) | A-tri (PDB entry 4X07) | B-tri (PDB entry 4X06) | Lea-tri (PDB entry 4WZL) | Leb-tetra (PDB entry 4OPO) | Ley-tetra (PDB entry 4WZE) | |
| Data collection parameters | ||||||
| Space group | C2 | C2 | C2 | C2 | C2 | C2 |
| Cell dimensions | ||||||
| a,b,c (Å) | 114.99, 58.81, 98.02 | 97.96, 58.64, 114.59 | 113.83, 58.65, 97.31 | 96.87, 58.83, 124.44 | 113.66, 58.6, 97.17 | 97.02, 58.50, 113.86 |
| α, β, γ (°) | 90, 108.11, 90 | 90, 105.49, 90 | 90, 107.34, 90 | 90, 119.8, 90 | 90, 107.15, 90 | 90, 108.1, 90 |
| Resolution range (Å) | 46.58–1.47 (1.51–1.47) | 48.01–1.28 (1.32–1.28) | 48.10–1.22 (1.25–1.22) | 49.59–1.57 (1.61–1.57) | 46.42–1.38 (1.42–1.38) | 48.16–1.45 (1.49–1.45) |
| Rmerge | 3.091 (48.00) | 6.353 (41.88) | 3.519 (35.40) | 5.205 (48.73) | 7.537 (93.06) | 2.8 (45.5) |
| I/σI | 17.31 (2.27) | 7.40 (1.96) | 13.92 (2.54) | 8.11 (1.99) | 12.76 (1.71) | 10.16 (1.84) |
| Completeness (%) | 97.30 (95.10) | 98.00 (92.70) | 96.70 (90.20) | 97.61 (88.60) | 99.20 (97.04) | 95.17 (93.87) |
| Redundancy | 2.9 (2.9) | 4.5 (3.6) | 2.6 (2.5) | 3.0 (2.9) | 3.7 (3.6) | 2.3 (2.2) |
| Refinement parameters | ||||||
| Resolution range (Å) | 29.66–1.49 | 43.18–1.46 | 32.32–1.22 | 42.47–1.70 | 46.42–1.40 | 31.76–1.46 |
| No. of reflections | 99,198 | 106,175 | 176,446 | 65,702 | 119,485 | 100,015 |
| Rwork/Rfree | 13.88/17.35 | 16.53/19.30 | 13.41/16.12 | 17.03/19.55 | 15.08/18.54 | 17.74/21.17 |
| No. of atoms | 9,013 | 10,143 | 10,037 | 9,985 | 10,227 | 9,826 |
| Protein | 4,803 | 4,842 | 4,865 | 4,812 | 4,850 | 4,801 |
| Ligand/ion | 80 | 80 | 140 | 124 | 120 | 100 |
| Water | 540 | 799 | 716 | 569 | 812 | 542 |
| Avg B factor (Å2) | ||||||
| Protein | 24.20 | 15.50 | 15.80 | 17.10 | 12.90 | 22.80 |
| Ligand/ion | 47.90 | 36.00 | 27.90 | 37.40 | 30.40 | 41.70 |
| Water | 33.10 | 27.40 | 25.60 | 28.20 | 25.30 | 32.30 |
| RMSD | ||||||
| Bond lengths (Å) | 0.011 | 0.008 | 0.010 | 0.006 | 0.007 | 0.033 |
| Bond angles (°) | 1.29 | 1.20 | 1.36 | 1.08 | 1.20 | 1.73 |
The data sets were collected from single crystals. Values in parentheses are for the highest-resolution shell.
TABLE 4.
Data collection and refinement statistics for NSW-2012 P domain and HBGA complex structuresa
| Parameter | Value or description |
||
|---|---|---|---|
| A-tri (PDB entry 4WZT) | B-tri (PDB entry 4OP7) | Lex-tri (PDB entry 4X0C) | |
| Data collection parameters | |||
| Space group | P41212 | P41212 | P41212 |
| Cell dimensions | |||
| a,b,c (Å) | 104.74, 104.74, 190.85 | 104.61, 104.61, 190.54 | 104.83, 104.83, 191 |
| α, β, γ (°) | 90, 90, 90 | 90, 90, 90 | 90, 90, 90 |
| Resolution range (Å) | 48.26–1.85 (1.90–1.85) | 48.19–1.90 (1.97–1.90) | 45.95–1.70 (1.75–1.70) |
| Rmerge | 8.758 (98.50) | 11.31 (115.40) | 6.856 (128.60) |
| I/σI | 16.73 (1.60) | 10.70 (1.09) | 15.62 (1.20) |
| Completeness (%) | 98.80 (98.30) | 93.80 (93.70) | 99.20 (97.60) |
| Redundancy | 6.5 (6.5) | 4.3 (4.2) | 3.6 (3.6) |
| Refinement parameters | |||
| Resolution range (Å) | 48.26–1.91 | 48.19–1.92 | 40.14–1.72 |
| No. of reflections | 81,872 | 76,345 | 112,461 |
| Rwork/Rfree | 15.37/17.91 | 18.47/20.81 | 15.96/17.95 |
| No. of atoms | 10,006 | 9,760 | 10,085 |
| Protein | 4,803 | 4,762 | 4,802 |
| Ligand/ion | 88 | 76 | 142 |
| Water | 718 | 492 | 747 |
| Avg B factor (Å2) | |||
| Protein | 26.30 | 26.90 | 23.10 |
| Ligand/ion | 42.80 | 37.90 | 43.60 |
| Water | 34.50 | 31.50 | 34.70 |
| RMSD | |||
| Bond lengths (Å) | 0.008 | 0.007 | 0.013 |
| Bond angles (°) | 1.13 | 1.11 | 1.32 |
The data sets were collected from single crystals. Values in parentheses are for the highest-resolution shell.
FIG 4.

Representative simulated annealing difference omit maps. The omit maps (blue) were contoured between 2.5 and 2.0 σ. H2-tri is an α-l-fucose-(1-2)-β-d-galactose-(1-4)-N-acetyl-β/α-d-glucosamine, A-tri is an α-l-fucose-(1-2)-β-d-galactose-(3-1)-N-acetyl-α-d-galactosamine, B-tri is an α-l-fucose-(1-2)-β/α-d-galactose-(3-1)-α-d-galactose, Ley-tetra is an α-l-fucose-(1-2)-β-d-galactose-(1-4)-N-acetyl-β/α-d-glucosamine-(3-1)-α-l-fucose, Leb-tetra is an α-l-fucose-(1-2)-β-d-galactose-(1-3)-N-acetyl-β-d-glucosamine-(4-1)-α-l-fucose, Lea-tri is a β-d-galactose-(1-3)-N-acetyl-β/α-d-glucosamine-(4-1)-α-l-fucose (the electron density was well defined for fucose and partially defined for the N-acetylglucosamine and galactose), and Lex-tri is a β-d-galactose-(1-4)-N-acetyl-β/α-d-glucosamine-(3-1)-α-l-fucose. Underlining represents the position of the reducing end hydroxyl group, which was fixed in the α position in the crystal structures.
FIG 5.

Saga-2006 P dimer binding interactions with H2-tri. (A) Closeup surface and ribbon representation of the Saga-2006–H2-tri complex structure, showing the hydrogen bonds (black lines) with H2-tri (cyan sticks) and water-mediated interactions (red spheres). (B) Saga-2006 P dimer and H2-tri binding interactions. FUC, α-fucose; GAL, β-galactose; NDG, α-N-acetylglucosamine. The black lines represent the hydrogen bonds, the red line represents the hydrophobic interaction with the hydroxyl group of Tyr444, and the sphere represents water. (C) The ABH fucose of Saga-2006–H2-tri bound at the regular pocket. The acetyl group of N-acetylglucosamine was leaning toward the edge of the P dimer. (D) The ABH fucose of TCH05-2004–H1-pentasaccharide bound at the regular pocket. The acetyl group of N-glucosamine was leaning toward the center of the P dimer.
Comparisons with other GII.4 P domain H2-tri complex structures were not possible, since the Saga-2006–H2-tri structure is the first known GII.4 P–H2-tri complex structure. Superposition of a GII.4 2004 P dimer-H1 pentasaccharide structure (PDB entry 3SLN) on the Saga-2006–H2-tri structure revealed that the first three saccharides were positioned similarly to H2-tri on the P dimers (Fig. 5C and D). However, the N-acetylglucosamine in Saga-2006–H2-tri was flipped 180° compared to that of the H1 pentasaccharide. The two remaining saccharides of the H1 pentasaccharide were raised off the P domain, though they were not held by any residues (19). This result shows that the H-type orientation is variable among GII.4 variants or that the longer pentasaccharide and the H type influence the binding orientation.
Structure of 2006 GII.4 P domain–Ley-tetra complex.
The Lewisy tetrasaccharide (Ley-tetra) contains both an ABH fucose and a Lewis fucose moiety. Two Ley-tetra moieties bound to the Saga-2006 P dimer. The electron density was well defined for all four saccharide units (Fig. 4). The Lewis fucose of Ley-tetra bound at the regular pocket and was held by the common set of residues (Fig. 6A and B). The N-acetylglucosamine was held by one hydrogen bond from the side chain of Ser442, and the galactose was held by one direct hydrogen bond from the hydroxyl group of Tyr444. The ABH fucose was not held by any direct hydrogen bonds. Several P domain water-mediated interactions with fucose and galactose were also observed. In order for Ley-tetra to bind to Saga-2006, a loop (residues 391 to 394) was shifted from the apo position to an alternative conformation (Fig. 6C).
FIG 6.

Saga-2006 P dimer binding interactions with Ley-tetra. (A) Closeup surface and ribbon representation of the Saga-2006–Ley-tetra complex structure, showing the hydrogen bonds with Ley-tetra (green sticks) and water-mediated interactions. (B) Saga-2006 P dimer and Ley-tetra binding interactions. FUC, α-fucose; NDG, α-N-acetylglucosamine; GAL, β-galactose. (C) A loop in the Saga-2006 P2 subdomain (residues 391 to 394) was repositioned from the apo position (gray) to an alternative position (deep teal) for Ley-tetra binding. (D) The Lewis fucose of Saga-2004–Ley-tetra bound at the regular pocket on the P domain and was leaning toward the edge of the P dimer. (E) The ABH fucose of GII.10 P domain Ley-tetra bound at the regular pocket and was orientated toward the center of the P dimer.
Other GII.4 P domain–Ley-tetra complex structures were not available; however, comparison with the GII.10 P domain–Ley-tetra structure (21) revealed different Ley-tetra orientations on the P domains (Fig. 6D and E). The Lewis fucose of Saga-2006–Ley-tetra bound at the regular pocket, whereas the ABH fucose of GII.10 P domain Ley-tetra bound at the regular pocket. Also, the terminal saccharides of GII.10 P domain Ley-tetra were directed toward the center of the P dimer, while the terminal saccharides of Saga-2006–Ley-tetra were leaning toward the edge of the P dimer. Interestingly, Saga-2006 had fewer direct hydrogen bonds with Ley-tetra than GII.10 did (6 and 10, respectively). Together, these findings suggest that there is an Ley-tetra placement constraint among the different GII P domains.
Structures of 2004 and 2006 GII.4 P domain–Leb-tetra complexes.
The Lewisb tetrasaccharide (Leb-tetra) contains both ABH and Lewis fucose moieties. One Leb-tetra unit bound to the Farm-2004 P dimer, whereas two Leb-tetra units bound to the Saga-2006 P dimer. The electron density was well defined for all four saccharide units (Fig. 4). The ABH fucose of Farm-2004–Leb-tetra bound at the regular pocket and was held by the common set of residues (Fig. 7A and B). The galactose of Farm-2004–Leb-tetra was held by one hydrogen bond from the side chain of Ser442, while the N-acetylglucosamine was not held by any hydrogen bonds. The Lewis fucose of Farm-2004–Leb-tetra was held by one hydrogen bond from the side chain of Asp391 and one hydrogen bond from the main chain of Gly392. A similar set of direct hydrogen bonds was found in the Saga-2006–Leb-tetra structure (Fig. 7C and D). Several P domain water-mediated interactions with the ABH and Lewis fucose moieties were also observed.
FIG 7.

Farm-2004 and Saga-2006 P dimer binding interactions with Leb-tetra. (A) Closeup surface and ribbon representation of the Farm-2004–Leb-tetra complex structure, showing the hydrogen bonds with Leb-tetra (marine sticks) and water-mediated interactions. (B) Farm-2004 P dimer and Leb-tetra binding interactions. FUC, α-fucose; GAL, β-galactose; NAG, β-N-acetylglucosamine. The black lines represent the hydrogen bonds, the red line represents the hydrophobic interaction with the hydroxyl group of Tyr444, and the sphere represents water. (C) Closeup surface and ribbon representation of the Saga-2006–Leb-tetra complex structure, showing the hydrogen bonds with Leb-tetra and water-mediated interactions. (D) Saga-2006 P dimer and Leb-tetra binding interactions. (E) Superposition of both the A and B chains of the Farm-2004 apo (gray and black) and Farm-2004–Leb-tetra (cyan and pink) structures.
In order to better understand Leb-tetra binding interactions, we superpositioned chains A and B of the Farm-2004 apo and Farm-2004–Leb-tetra structures (Fig. 7E). The loop in chain A interacting with the Lewis fucose of Farm-2004–Leb-tetra (residues 391 to 394) was in a suitable position to allow direct hydrogen bonds with the Lewis fucose. The equivalent loop in chain A of the Farm-2004 apo structure was in a slightly different conformation. This result suggested that the loop was repositioned to support Lewis fucose binding. The loop at the unoccupied HBGA binding site of Farm-2004–Leb-tetra (chain B) had a conformation similar to that of the equivalent loop (chain B) of the Farm-2004 apo structure. The reason that the second Leb-tetra unit did not bind to Farm-2004 was not determined, although steric hindrance from the neighboring molecule may have played a role, as previously discussed (21). Nevertheless, these results highlight the complexity and importance of the flexible loop in Leb-tetra binding.
Structure of 2006 GII.4 P domain–Lea-tri complex.
The Lewisa trisaccharide (Lea-tri) contains a single Lewis fucose moiety. The electron density was well defined for the Lewis fucose and less defined for the other two saccharides, which indicated that these saccharides were only loosely held on the P domain (Fig. 4). Two Lea-tri units bound to the Saga-2006 P dimer. The Lewis fucose bound at the regular pocket and was held by the common set of residues (Fig. 8A and B). The N-acetylglucosamine was held by one hydrogen bond from the side chain of Ser442. Galactose was held by two hydrogen bonds from the hydroxyl group of Tyr444. Several P domain water-mediated interactions were also observed with all three saccharides.
FIG 8.

Saga-2006 P dimer binding interactions with Lea-tri and superposition of GII.4 P domains. (A) Closeup surface and ribbon representation of the Saga-2006–Lea-tri complex structure, showing hydrogen bonds with Lea-tri (camel-colored sticks) and water-mediated interactions. (B) Saga-2006 P dimer and Lea-tri binding interactions. FUC, α-fucose; NDG, α-N-acetylglucosamine; GAL, β-galactose. (C) Superposition of apo and HBGA-bound Farm-2004, Saga-2006, and NSW-2012 P dimer structures (with HBGAs removed from the structures). The circles represent the HBGA binding pocket. Farm-2004 P1 subdomains (chain A in pink and chain B in pale cyan) and P2 subdomains (chain A in green cyan and chain B in light magenta), Saga-2006 P1 subdomains (chain A in brown and chain B in yellow-orange) and P2 subdomains (chain A in deep teal and chain B in dirty violet), and NSW-2012 P1 subdomains (chain A in lime and chain B in marine) and P2 subdomains (chain A in blue-white and chain B in teal) are indicated by color coding. (D) Close-up of the P2 subdomain flexible loop (residues 391 to 394). In the case of H2-tri, Ley-tetra, Lea-tri, and Lex-tri, the N-acetylglucosamine was held by the side chain of Ser442, while the galactose was held by a hydrogen bond from the hydroxyl group of Tyr444. The loop required for the Lewis HBGA-tetrasaccharide interactions was found in multiple conformations on both A and B chains.
Other GII P domain–Lea-tri complex structures have yet to be determined. Superposition of the Farm-2004, Saga-2006, and NSW-2012 GII.4 apo structures showed that the conformations of the side chains that interacted with N-acetylglucosamine and galactose (i.e., Ser442 and Tyr444) were similarly orientated. This result suggests that Farm-2004 and NSW-2012 are also capable of Lea-tri binding (Fig. 8C and D), although further studies are required.
Structure of 2012 GII.4 P domain–Lex-tri complex.
The Lewisx trisaccharide (Lex-tri) contains a single Lewis fucose moiety. Two Lex-tri units bound to the NSW-2012 P dimer. The electron density was well defined for all three saccharide units, which indicated that the HBGA was firmly held by the P domain (Fig. 4). The Lewis fucose bound at the regular pocket and was held by the common set of residues (Fig. 9). The N-acetylglucosamine was held by two hydrogen bonds with the side chain of Ser442, while the galactose was held by one hydrogen bond from the hydroxyl group of Tyr444. Interestingly, the terminal galactose of one Lex-tri unit was held in two conformations, with an ∼1.5-Å shift (data not shown; see the PBD). However, this shift did not result in any additional binding interactions.
FIG 9.
NSW-2012 P dimer interaction with Lex-tri. (A) Closeup surface and ribbon representation of the NSW-2012–Lex-tri complex structure, showing the hydrogen bonds with Lex-tri (salmon-colored sticks) and water-mediated interactions. (B) NSW-2012 and Lex-tri binding interactions. FUC, α-fucose; NDG, α-N-acetylglucosamine; GAL, β-galactose. The black lines represent the hydrogen bonds, the red line represents the hydrophobic interaction with the hydroxyl group of Tyr444, and the sphere represents water.
Previous GII P domain and Lex-tri complex structures have not been determined. Nevertheless, the side chains that interacted with N-acetylglucosamine and galactose were similarly orientated in all three GII.4 P domains (Fig. 8C and D), suggesting that Farm-2004 and Saga-2006 may also bind Lex-tri.
Structures of 2006 and 2012 GII.4 P domain–A-tri complexes.
Two A trisaccharides (A-tri) bound to both Saga-2006 and NSW-2012 P dimers. The electron density was well defined for all three saccharide units (Fig. 4). The orientations of the A-tri units in the Saga-2006 and NSW-2012 P domains were similar. Fucose was held by the common set of residues, while galactose and N-acetylgalactosamine were not supported by any direct hydrogen bonds (Fig. 10). Compared to their counterparts in other GII structures, the A-tri saccharide units were similarly orientated on the P dimers (21).
FIG 10.

Saga-2006 and NSW-2012 P dimer interactions with A-tri. (A) Closeup surface and ribbon representation of the Saga-2006 A-tri complex structure, showing the hydrogen bonds with A-tri (yellow sticks) and water-mediated interactions. (B) Saga-2006 and A-tri binding interactions. FUC, α-fucose; GLA, α-galactose; A2G, α-N-acetylgalactosamine. The black lines represent the hydrogen bonds, the red line represents the hydrophobic interaction with the hydroxyl group of Tyr444, and the sphere represents water. (C) Closeup surface and ribbon representation of the NSW-2012–A-tri complex structure, showing the hydrogen bonds with A-tri and water-mediated interactions. (D) NSW-2012 and A-tri binding interactions.
Structures of 2004, 2006, and 2012 GII.4 P domain–B-tri complexes.
Two B trisaccharides (B-tri) bound to Farm-2004 (Fig. 11A and B), Saga-2006 (Fig. 11C and D), and NSW-2012 (Fig. 11E and F) P dimers. The electron density was well defined for all three saccharide units (Fig. 4). The fucose was held by the common set of residues in all complex structures, while the central and terminal galactose residues were not held by any direct hydrogen bonds (Fig. 11). Similar to that of NSW-2012–Lex-tri, the terminal galactose of B-tri bound to Saga-2006 was held in two conformations, with an ∼1.5-Å shift, and this resulted in several new water-mediated interactions (Fig. 11C and D). Interestingly, the loop described earlier (residues 391 to 394) (Fig. 8C and D) was found in two different positions in the Saga-2006–B-tri structure. In one conformation, the loop was orientated as in the Saga-2006 apo structure, while the alternative conformation was positioned similarly to that in the Saga-2006–Ley-tetra structure (Fig. 6C). The loop movement did not result in any additional binding interactions but merely indicated that the loop had a preference for at least two conformations. Compared to their counterparts in other GII structures, the B-tri saccharide moieties were similarly positioned on the P domains (21).
FIG 11.

Farm-2004, Saga-2006, and NSW-2012 P dimer interactions with B-tri. (A) Closeup surface and ribbon representation of the Farm-2004–B-tri complex structure, showing hydrogen bonds with B-tri (pink sticks) and water-mediated interactions. (B) Farm-2004 P dimer and B-tri binding interactions. FUC, α-fucose; GLA, α-galactose. The black lines represent the hydrogen bonds, the red line represents the hydrophobic interaction with the hydroxyl group of Tyr444, and the sphere represents water. (C) Closeup surface and ribbon representation of the Saga-2006–B-tri complex structure, showing hydrogen bonds with B-tri and water-mediated interactions. The galactose was found in two different conformations (gray and pink sticks). (D) Saga-2006 P dimer and B-tri binding interactions, showing newly formed hydrogen bonds (blue lines) with the alternative galactose position. (E) Closeup surface and ribbon representation of the NSW-2012–B-tri complex structure, showing hydrogen bonds with B-tri and water-mediated interactions. (F) NSW-2012 P dimer and B-tri binding interactions.
Protein contact potential.
The protein contact potential was calculated for a panel of GII.4 P dimers in order to better understand the temporal variations in surface charge that might alter antigenicity and HBGA binding (Fig. 12). The region ahead of the regular pocket and toward the center of the P dimer (binding sites of A and B types) remained virtually unchanged and was mostly negatively charged. The regions that contributed to binding of terminal saccharide moieties of Lewis HBGAs underwent a modification, i.e., from small areas of negative and positive charges (in the 1998 variant) to large areas of mostly negative charge. In this view, it appeared that the more recent GII.4 HBGA binding pocket became more negatively charged.
FIG 12.

Surface representation of protein contact potential of GII.4 P dimers. The protein contact potential (where red represents a negative charge, white represents a neutral charge, and blue represents a positive charge; ∼−55 to +55 kT/e) was calculated for VA387-1998 (PDB entry 2OBT), TCH-2004 (PDB entry 3SLD), Farm-2004, Saga-2006, and NSW-2012 (top views [left] and close-ups of the HBGA pocket [right]). Leb-tetra of the Farm-2004–Leb-tetra structure (marine sticks) was modeled into the VA387, TCH-05, Saga-2006, and NSW-2012 structures. B-tri (pink sticks) and A-tri (yellow sticks) were complex structures. The regions surrounding the regular ABH fucose binding pocket remained mostly unchanged and negatively charged. The regions binding terminal saccharides of Lewis HBGAs changed from small patches of negative/positive charge to larger areas of negative charge.
DISCUSSION
There is considerable debate on norovirus GII.4 evolution and the corresponding interactions with different HBGA types (4–6, 8, 11, 28–31). In this study, we determined the X-ray crystal structures of three P domains from epidemic GII.4 variants, from 2004, 2006, and 2012, with a panel of HBGAs. The exceptionally high resolutions of our structures allowed us to accurately define HBGA interactions, several of which were not previously determined for GII.4 P domains (i.e., H2-tri, Ley-tetra, Lea-tri, and Lex-tri). A common set of conserved residues (i.e., Asp374, Arg345, Thr344, Tyr444, and Gly443) firmly held both the ABH and Lewis fucose moieties. The GII.4 variants were capable of binding numerous Lewis HBGA types, and we discovered that the Lewis HBGA binding mechanisms, particularly those for Ley-tetra and Leb-tetra, involved more complex interactions than the A-tri and B-tri binding interactions. A flexible loop (residues 391 to 395) on the P dimer appeared to be versatile and acted as a helping hand with Lewis HBGA tetrasaccharides. In one example, the loop was cleverly repositioned to allow Ley-tetra binding (Fig. 6C). In another example, the loop provided direct hydrogen- and water-mediated bonds with Leb-tetra after a slight repositioning (Fig. 7). This flexible loop likely modulates binding of Lewis HBGAs, although in vivo interactions may involve additional mechanisms.
In comparing the sequences of the variant GII.4 P domains, we found that most amino acid changes were surface exposed and that ∼50% became fixed (Fig. 3). The region immediately beneath the HBGA binding pocket showed few amino acid changes. On the other hand, the regions that contributed to binding of terminal saccharides of Lewis HBGAs underwent a more noticeable modification, i.e., from small areas of negative and positive charges (in the 1998 variant) to larger areas of mostly negative charge (Fig. 12). The amino acid variations likely corresponded to temporal changes in antigenicity, as previously described (32), but how these changes related to apparent alterations in HBGA binding remains unclear.
Even though not all complex structures could be determined, we considered that these three GII.4 P domains were capable of binding to all HBGA types examined, since binding interactions were similar and only a few amino acid changes surrounding the HBGA pocket were observed. We previously showed that the rarely detected GII.10 strain also firmly bound a number of HBGA types (H2-tri, A-tri, B-tri, and Ley-tetra) but only weakly bound Leb-tetra and was unable to bind Lea-tri and Lex-tri (21). Therefore, it is tempting to speculate that the GII.4 P domains are better adapted to bind numerous HBGA types, whereas the rarely detected GII.10 virus is less capable, which may also convey to the lower prevalence of GII.10 strains in the general population (21) and the worldwide distribution of GII.4 viruses.
The affinities between noroviruses and HBGAs are weak and in the high micromolar range (33). We previously showed that the GII.10 P domain bound H2-tri with an affinity of 390 μM (33). Similarly, the Saga-2006 P domain had weak affinities for HBGAs (∼100 μM) by saturation transfer difference-nuclear magnetic resonance (STD-NMR) analysis (A. Mallagaray, G. S. Hansman, and T. Peters, unpublished data). In addition, a recent study found that a GII.4 P domain (VA387 strain) had comparable affinities for different HBGA types in vitro (34). Based on the number of direct hydrogen bonds and water-mediated interactions, small changes in P domain affinities for HBGAs may exist, and these may be important in vivo.
The precise roles of HBGAs in a norovirus infection are still poorly understood, although synthetic HBGAs or HBGA-expressing enteric bacteria were found to enhance human norovirus infection in B cells (12). Interestingly, the synthetic HBGA (H-type disaccharide) in the infection experiment was conjugated to polyacrylic acid (PAA). Several studies have found that conjugated linkers may affect and/or influence HBGA binding interactions (35, 36). Further structural studies with norovirus VLPs in complex with HBGAs may help to explain the possible binding mechanisms in vivo.
Many of our newly determined HBGA binding results challenged previous ELISA-based findings (4–6). We found that Farm-2004 bound Leb-tetra and B-tri, whereas an ELISA study showed that GII.4 VLPs with an identical P domain sequence (termed 2002) did not bind Leb-tetra and only weakly bound B-tri (6). We also found that Saga-2006 bound H2-tri, A-tri, B-tri, Lea-tri, Leb-tetra, and Ley-tetra, while several ELISA studies showed that GII.4 VLPs with an almost identical P domain sequence (termed 2006) did not bind to Ley-tetra (5), A-tri (5), H2-tri (4), or Lea-tri (4). Finally, we showed that NSW-2012 bound A-tri, B-tri, and Lex-tri, whereas a recent ELISA study showed that GII.4 2012 VLPs with an identical P domain sequence (termed GII.4-2012) did not bind to Lex-tri (4). Certainly, in vivo interactions may be different from the results of X-ray crystallography and ELISA-based studies. Nevertheless, these new data provide a new focal point for improving HBGA binding assays in order to increase our understanding of norovirus and HBGA interactions.
ACKNOWLEDGMENTS
The funding for this study was provided by the CHS foundation and the Helmholtz-Chinese Academy of Sciences.
G.S.H. designed the research, M.M.L. and Anne-Kathrin Herrmann performed initial Farm-2004 structural refinement, and G.S.H. and B.K.S. finalized all structures.
We acknowledge the European Synchrotron Radiation Facility (beamlines ID23-1 and BM30A) for provision of synchrotron radiation facilities. We thank Thomas Peters and Alvaro Mallagaray for performing the STD-NMR experiments (unpublished data). We also thank members of the Norovirus Study Group, Joel Sussman, and Henri-Jacques Delecluse for critical comments on the manuscript.
REFERENCES
- 1.Kapikian AZ, Wyatt RG, Dolin R, Thornhill TS, Kalica AR, Chanock RM. 1972. Visualization by immune electron microscopy of a 27-nm particle associated with acute infectious nonbacterial gastroenteritis. J Virol 10:1075–1081. [DOI] [PMC free article] [PubMed] [Google Scholar]
- 2.Hansman GS, Natori K, Shirato-Horikoshi H, Ogawa S, Oka T, Katayama K, Tanaka T, Miyoshi T, Sakae K, Kobayashi S, Shinohara M, Uchida K, Sakurai N, Shinozaki K, Okada M, Seto Y, Kamata K, Nagata N, Tanaka K, Miyamura T, Takeda N. 2006. Genetic and antigenic diversity among noroviruses. J Gen Virol 87:909–919. doi: 10.1099/vir.0.81532-0. [DOI] [PubMed] [Google Scholar]
- 3.Siebenga JJ, Vennema H, Renckens B, de Bruin E, van der Veer B, Siezen RJ, Koopmans M. 2007. Epochal evolution of GGII.4 norovirus capsid proteins from 1995 to 2006. J Virol 81:9932–9941. doi: 10.1128/JVI.00674-07. [DOI] [PMC free article] [PubMed] [Google Scholar]
- 4.Debbink K, Lindesmith LC, Donaldson EF, Costantini V, Beltramello M, Corti D, Swanstrom J, Lanzavecchia A, Vinje J, Baric RS. 2013. Emergence of new pandemic GII.4 Sydney norovirus strain correlates with escape from herd immunity. J Infect Dis 208:1877–1887. doi: 10.1093/infdis/jit370. [DOI] [PMC free article] [PubMed] [Google Scholar]
- 5.Lindesmith LC, Debbink K, Swanstrom J, Vinje J, Costantini V, Baric RS, Donaldson EF. 2012. Monoclonal antibody-based antigenic mapping of norovirus GII.4-2002. J Virol 86:873–883. doi: 10.1128/JVI.06200-11. [DOI] [PMC free article] [PubMed] [Google Scholar]
- 6.Lindesmith LC, Donaldson EF, Lobue AD, Cannon JL, Zheng DP, Vinje J, Baric RS. 2008. Mechanisms of GII.4 norovirus persistence in human populations. PLoS Med 5:e31. doi: 10.1371/journal.pmed.0050031. [DOI] [PMC free article] [PubMed] [Google Scholar]
- 7.Debbink K, Lindesmith LC, Donaldson EF, Baric RS. 2012. Norovirus immunity and the great escape. PLoS Pathog 8:e1002921. doi: 10.1371/journal.ppat.1002921. [DOI] [PMC free article] [PubMed] [Google Scholar]
- 8.Huang P, Farkas T, Marionneau S, Zhong W, Ruvoen-Clouet N, Morrow AL, Altaye M, Pickering LK, Newburg DS, LePendu J, Jiang X. 2003. Noroviruses bind to human ABO, Lewis, and secretor histo-blood group antigens: identification of 4 distinct strain-specific patterns. J Infect Dis 188:19–31. doi: 10.1086/375742. [DOI] [PubMed] [Google Scholar]
- 9.Huang P, Farkas T, Zhong W, Tan M, Thornton S, Morrow AL, Jiang X. 2005. Norovirus and histo-blood group antigens: demonstration of a wide spectrum of strain specificities and classification of two major binding groups among multiple binding patterns. J Virol 79:6714–6722. doi: 10.1128/JVI.79.11.6714-6722.2005. [DOI] [PMC free article] [PubMed] [Google Scholar]
- 10.Harrington PR, Lindesmith L, Yount B, Moe CL, Baric RS. 2002. Binding of Norwalk virus-like particles to ABH histo-blood group antigens is blocked by antisera from infected human volunteers or experimentally vaccinated mice. J Virol 76:12335–12343. doi: 10.1128/JVI.76.23.12335-12343.2002. [DOI] [PMC free article] [PubMed] [Google Scholar]
- 11.Rockx BH, Vennema H, Hoebe CJ, Duizer E, Koopmans MP. 2005. Association of histo-blood group antigens and susceptibility to norovirus infections. J Infect Dis 191:749–754. doi: 10.1086/427779. [DOI] [PubMed] [Google Scholar]
- 12.Jones MK, Watanabe M, Zhu S, Graves CL, Keyes LR, Grau KR, Gonzalez-Hernandez MB, Iovine NM, Wobus CE, Vinje J, Tibbetts SA, Wallet SM, Karst SM. 2014. Enteric bacteria promote human and mouse norovirus infection of B cells. Science 346:755–759. doi: 10.1126/science.1257147. [DOI] [PMC free article] [PubMed] [Google Scholar]
- 13.Ayukekbong JA, Fobisong C, Tah F, Lindh M, Nkuo-Akenji T, Bergstrom T. 2014. Pattern of circulation of norovirus GII strains during natural infection. J Clin Microbiol 52:4253–4259. doi: 10.1128/JCM.01896-14. [DOI] [PMC free article] [PubMed] [Google Scholar]
- 14.Tan M, Jiang X. 2005. Norovirus and its histo-blood group antigen receptors: an answer to a historical puzzle. Trends Microbiol 13:285–293. doi: 10.1016/j.tim.2005.04.004. [DOI] [PubMed] [Google Scholar]
- 15.Tan M, Jiang X. 2011. Norovirus-host interaction: multi-selections by human histo-blood group antigens. Trends Microbiol 19:382–388. doi: 10.1016/j.tim.2011.05.007. [DOI] [PMC free article] [PubMed] [Google Scholar]
- 16.Cao S, Lou Z, Tan M, Chen Y, Liu Y, Zhang Z, Zhang XC, Jiang X, Li X, Rao Z. 2007. Structural basis for the recognition of blood group trisaccharides by norovirus. J Virol 81:5949–5957. doi: 10.1128/JVI.00219-07. [DOI] [PMC free article] [PubMed] [Google Scholar]
- 17.Bu W, Mamedova A, Tan M, Xia M, Jiang X, Hegde RS. 2008. Structural basis for the receptor binding specificity of Norwalk virus. J Virol 82:5340–5347. doi: 10.1128/JVI.00135-08. [DOI] [PMC free article] [PubMed] [Google Scholar]
- 18.Kubota T, Kumagai A, Ito H, Furukawa S, Someya Y, Takeda N, Ishii K, Wakita T, Narimatsu H, Shirato H. 2012. Structural basis for the recognition of Lewis antigens by genogroup I norovirus. J Virol 86:11138–11150. doi: 10.1128/JVI.00278-12. [DOI] [PMC free article] [PubMed] [Google Scholar]
- 19.Shanker S, Choi JM, Sankaran B, Atmar RL, Estes MK, Prasad BV. 2011. Structural analysis of histo-blood group antigen binding specificity in a norovirus GII.4 epidemic variant: implications for epochal evolution. J Virol 85:8635–8645. doi: 10.1128/JVI.00848-11. [DOI] [PMC free article] [PubMed] [Google Scholar]
- 20.Prasad BV, Hardy ME, Dokland T, Bella J, Rossmann MG, Estes MK. 1999. X-ray crystallographic structure of the Norwalk virus capsid. Science 286:287–290. doi: 10.1126/science.286.5438.287. [DOI] [PubMed] [Google Scholar]
- 21.Hansman GS, Biertumpfel C, Georgiev I, McLellan JS, Chen L, Zhou T, Katayama K, Kwong PD. 2011. Crystal structures of GII.10 and GII.12 norovirus protruding domains in complex with histo-blood group antigens reveal details for a potential site of vulnerability. J Virol 85:6687–6701. doi: 10.1128/JVI.00246-11. [DOI] [PMC free article] [PubMed] [Google Scholar]
- 22.Kabsch W. 1993. Automatic processing of rotation diffraction data from crystals of initially unknown symmetry and cell constants. J Appl Crystallogr 26:795–800. doi: 10.1107/S0021889893005588. [DOI] [Google Scholar]
- 23.McCoy AJ, Grosse-Kunstleve RW, Adams PD, Winn MD, Storoni LC, Read RJ. 2007. Phaser crystallographic software. J Appl Crystallogr 40:658–674. doi: 10.1107/S0021889807021206. [DOI] [PMC free article] [PubMed] [Google Scholar]
- 24.Emsley P, Lohkamp B, Scott WG, Cowtan K. 2010. Features and development of Coot. Acta Crystallogr D Biol Crystallogr 66:486–501. doi: 10.1107/S0907444910007493. [DOI] [PMC free article] [PubMed] [Google Scholar]
- 25.Adams PD, Afonine PV, Bunkóczi G, Chen VB, Davis IW, Echols N, Headd JJ, Hung L-W, Kapral GJ, Grosse-Kunstleve RW, McCoy AJ, Moriarty NW, Oeffner R, Read RJ, Richardson DC, Richardson JS, Terwilliger TC, Zwart PH. 2010. PHENIX: a comprehensive Python-based system for macromolecular structure solution. Acta Crystallogr D Biol Crystallogr 66:213–221. doi: 10.1107/S0907444909052925. [DOI] [PMC free article] [PubMed] [Google Scholar]
- 26.Chen VB, Arendall WB 3rd, Headd JJ, Keedy DA, Immormino RM, Kapral GJ, Murray LW, Richardson JS, Richardson DC. 2010. MolProbity: all-atom structure validation for macromolecular crystallography. Acta Crystallogr D Biol Crystallogr 66:12–21. doi: 10.1107/S0907444909042073. [DOI] [PMC free article] [PubMed] [Google Scholar]
- 27.Morris AL, MacArthur MW, Hutchinson EG, Thornton JM. 1992. Stereochemical quality of protein structure coordinates. Proteins 12:345–364. doi: 10.1002/prot.340120407. [DOI] [PubMed] [Google Scholar]
- 28.Tan M, Hegde RS, Jiang X. 2004. The P domain of norovirus capsid protein forms dimer and binds to histo-blood group antigen receptors. J Virol 78:6233–6242. doi: 10.1128/JVI.78.12.6233-6242.2004. [DOI] [PMC free article] [PubMed] [Google Scholar]
- 29.Harrington PR, Vinje J, Moe CL, Baric RS. 2004. Norovirus capture with histo-blood group antigens reveals novel virus-ligand interactions. J Virol 78:3035–3045. doi: 10.1128/JVI.78.6.3035-3045.2004. [DOI] [PMC free article] [PubMed] [Google Scholar]
- 30.Tan M, Huang P, Meller J, Zhong W, Farkas T, Jiang X. 2003. Mutations within the P2 domain of norovirus capsid affect binding to human histo-blood group antigens: evidence for a binding pocket. J Virol 77:12562–12571. doi: 10.1128/JVI.77.23.12562-12571.2003. [DOI] [PMC free article] [PubMed] [Google Scholar]
- 31.Lindesmith L, Moe C, Marionneau S, Ruvoen N, Jiang X, Lindblad L, Stewart P, LePendu J, Baric R. 2003. Human susceptibility and resistance to Norwalk virus infection. Nat Med 9:548–553. doi: 10.1038/nm860. [DOI] [PubMed] [Google Scholar]
- 32.Allen DJ, Gray JJ, Gallimore CI, Xerry J, Iturriza-Gomara M. 2008. Analysis of amino acid variation in the P2 domain of the GII-4 norovirus VP1 protein reveals putative variant-specific epitopes. PLoS One 3:e1485. doi: 10.1371/journal.pone.0001485. [DOI] [PMC free article] [PubMed] [Google Scholar]
- 33.Hansman GS, Shahzad-Ul-Hussan S, McLellan JS, Chuang GY, Georgiev I, Shimoike T, Katayama K, Bewley CA, Kwong PD. 2012. Structural basis for norovirus inhibition and fucose mimicry by citrate. J Virol 86:284–292. doi: 10.1128/JVI.05909-11. [DOI] [PMC free article] [PubMed] [Google Scholar]
- 34.Han L, Kitova EN, Tan M, Jiang X, Pluvinage B, Boraston AB, Klassen JS. 1October2014. Affinities of human histo-blood group antigens for norovirus capsid protein complexes. Glycobiology doi: 10.1093/glycob/cwu100. [DOI] [PMC free article] [PubMed] [Google Scholar]
- 35.Caddy S, Breiman A, le Pendu J, Goodfellow I. 2014. Genogroup IV and VI canine noroviruses interact with histo-blood group antigens. J Virol 88:10377–10391. doi: 10.1128/JVI.01008-14. [DOI] [PMC free article] [PubMed] [Google Scholar]
- 36.Rademacher C, Krishna NR, Palcic M, Parra F, Peters T. 2008. NMR experiments reveal the molecular basis of receptor recognition by a calicivirus. J Am Chem Soc 130:3669–3675. doi: 10.1021/ja710854r. [DOI] [PubMed] [Google Scholar]