Abstract
Sensitivity and spatial resolution in Magnetic Particle Imaging are affected by magnetic properties of the nanoparticle tracers used during imaging. Here, we have carried out a comprehensive magnetic characterization of single-core iron oxide nanoparticles that were designed for MPI. We used ac susceptometry, fluxgate magnetorelaxometry, and magnetic particle spectroscopy to evaluate the tracer’s magnetic core size, hydrodynamic size, and magnetic anisotropy. Our results present a self-consistent set of magnetic and structural parameters for the tracers that is consistent with direct measurements of size using transmission electron microscopy and dynamic light scattering and that can be used to better understand their MPI performance.
I. Introduction
Both sensitivity and spatial resolution of Magnetic Particle Imaging (MPI) – a new modality for the fast imaging of the spatial distribution of magnetic markers[1]– are critically determined by the availability of optimal magnetic nanoparticle tracers. So far, most of the MPI experiments utilize Resovist® – a clinically approved contrast agent originally developed for magnetic resonance imaging (MRI). In addition, MPI performance, comparable to that of Resovist, was demonstrated with other tracers optimized for MRI such as FeraSpin R™ from nanoPET Pharma GmbH[2]. It is, however, known that only a small fraction of the nanoparticles of Resovist and FeraSpin R contributes to the MPI signal. In fact, by using optimum fractions of the original suspensions of these MRI contrast agents, the MPI performance can be enhanced by about a factor of 2 as presented in Ludwig et al. [3]and Löwa et al.[4].
Whereas both Resovist and FeraSpin R particles are multicore ones, consisting of elementary crystallites with sizes between 5 and 7 nm, it has been shown that single-core iron-oxide nanoparticles with typical core diameters of (20–25) nm exhibit a MPI performance superior to that of Resovist and FeraSpin R. Moreover, both sensitivity and spatial resolution in MPI for single-core nanoparticle tracers is strongly coupled to nanoparticle size, with monosized dispersions providing superior performance[5–8]. In addition, use of a single-core particle tracer in MPI is also simpler to interpret with appropriate magnetization and relaxation models.
In this paper, we present a comprehensive magnetic characterization of these single-core nanoparticles for use in MPI. We include a self-consistent set of measurements of the effective magnetic anisotropy, K, which influences the magnetic reversal. Such measurements enable accurate assessment and improvement of MPI tracers and the magnetization models used to interpret MPI imaging. A deeper understanding of tracer behavior in dynamic magnetic fields is also critical to the continued development and optimization of MPI scanner design and related image reconstruction algorithms.
II. Samples
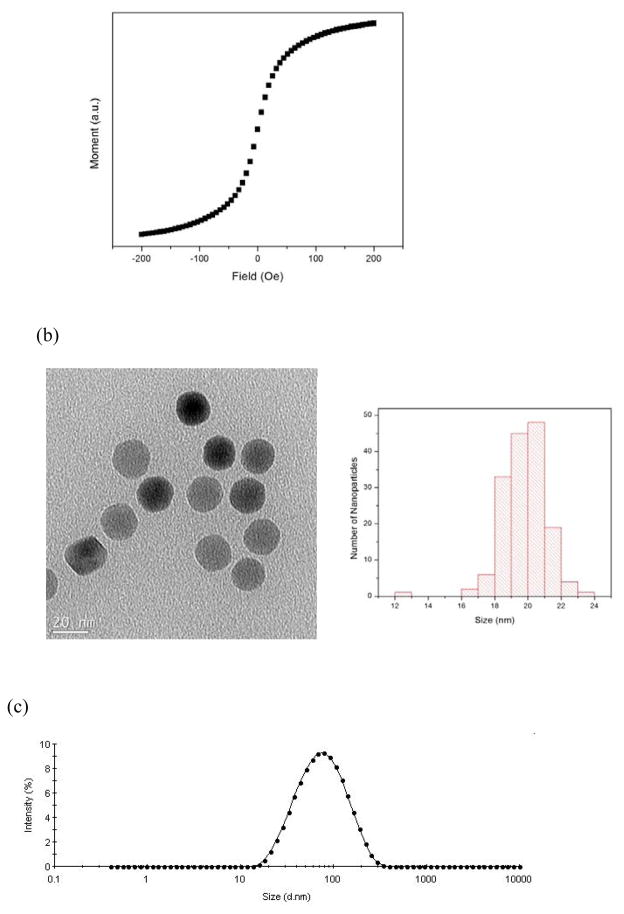
Oleic acid coated iron oxide nanoparticles (NPs) were synthesized by thermal decomposition of iron oleate in the presence of oleic acid, following a method reported earlier[9]. The hydrophobic NPs were then transferred to water using a co-polymer of poly(maleic anhydride-alt-1-octadecene) and polyethylene glycol (PMAO-PEG)[10]. The median core size of the NPs was calculated to be 20nm, with a standard deviation of 0.245, by fitting m(H) data to a log-normal distribution of particle sizes and assuming a Langevin response [11] (Fig. 1(a)). Magnetic size determined in this way matched with size measured by transmission electron microscope analysis (Fig. 1(b)). The hydrodynamic size of the polymer coated NPs in water was measured to be 62nm (harmonic mean of the intensity distribution) with a polydispersity index of 0.195, using dynamic light scattering (DLS) (Fig. 1(c)).
Fig. 1.
(a) The m(H) curve of the NPs after their phase transfer to water. (b) The TEM image and size distribution of the NPs. (c) the intensity-weighted hydrodynamic size distribution of the NPs.
III. Characterizations
III-1. AC susceptibility
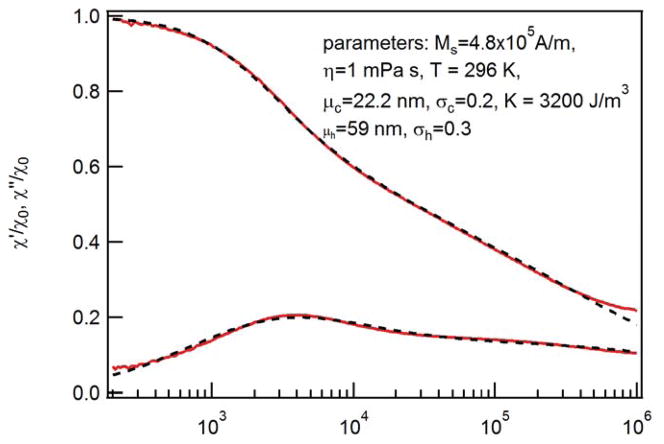
The complex ac susceptibility (ACS) measurement is a standard technique for the characterization of magnetic nanoparticles since it is rather simple and it covers a large range of relaxation times. ACS measurements for frequencies up to 10 MHz on suspensions of single-core magnetite particles which are similar to the ones studied here were recently presented[12]. In contrast to the model discussed below, the authors only consider a distribution of core diameters assuming a constant organic shell thickness. The ACS spectra discussed here were recorded with our 1 MHz ac susceptometer having a field amplitude of 95 μT/μ0 [13] and Fig. 2 shows the measured real and imaginary parts as a function of frequency. Clearly, the spectra cannot be modeled with a simple Debye model. To fit the measured spectra, we applied a generalization of the Debye model as proposed in Chung et al. [14]and Ludwig[15]. This model takes into account distributions of core f(dc) and hydrodynamic diameters f(dh) as well as Brownian τB and Néel time constants τN and it neglects particle-particle interactions. Within this model, real and imaginary parts of the ac susceptibility are given by
Fig. 2.
Measured ac susceptibility spectra. Spectra are normalized to the low-field value of the real part χ0. Dashed lines depict best fit with generalized Debye model (equations (1) and (2), respectively).
| (1) |
and
| (2) |
with
and
| (3) |
The Brownian and Néel time constants were modelled with the standard zero-field expressions, which are appropriate given the very small field amplitude, given by
| (4) |
and
| (5) |
with the viscosity η and assuming τ0 = 1 ns. For the distributions of core and hydrodynamic diameter, lognormal functions were assumed.
The dashed lines in Fig. 2 show the best fit with the described model assuming the bulk value of saturation magnetization, Ms = 4.8·105 A/m for magnetite and η = 1 mPa·s for the viscosity of water and T = 296 K. To restrict the number of free parameters in the model for fitting the measured spectra, we assumed for mean and standard deviation of the core size distribution values from TEM measurements (μc = 22.2 nm and σc = 0.2). The obtained mean hydrodynamic diameter μh = 59 nm is in good agreement with the findings from DLS measurements (62nm). The maximum of the imaginary part at 4 kHz is attributed to the Brownian relaxation of particles with τB < τN whereas the shoulder at frequencies around 100 kHz is caused by the Néel relaxation of particles with τB > τN.
III-2. Magnetorelaxometry
Magnetorelaxometry (MRX) is another established technique to characterize magnetic nanoparticles (MNP)[16]. In MRX, the MNP’s moments are aligned by a magnetizing field of a few mT magnitude, and then the decay of the net magnetic moment is recorded after abruptly switching off the field. The description of the magnetorelaxation signal of MNP samples with distributions of core f(dc) and hydrodynamic size f(dh) is usually performed with the moment superposition model (MSM) [17]which was originally proposed by Chantrell et al[18] and which assumes non-interacting nanoparticles. For MNP suspensions, the relaxation can principally take place via both the Brownian and the Néel mechanism in which the faster of the two dominates. In order to determine the core properties, the MNP are immobilized, by freeze-drying them in a mannite matrix, thus suppressing the Brownian rotation. In this case, the measured signal is given by
| (6) |
where C is a geometrical factor, L(dc) the Langevin function given by
with the magnetic moment , and τNH and τN are the Néel relaxation time constants in the magnetizing field and in zero field, respectively. For the Néel time constant is zero field, we used equation (5) and for the one in the magnetization field [19]
| (7) |
with the adjustable parameter F being of the order of 2.5.
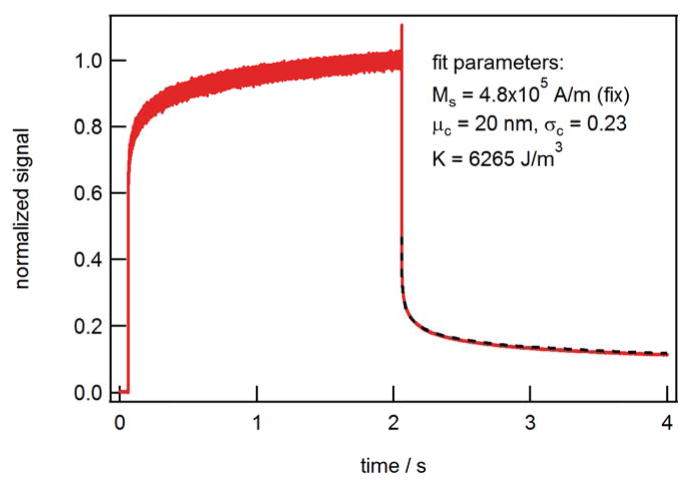
Fig. 3 depicts the complete magnetization-relaxation cycle measured on the immobilized sample using our fluxgate MRX setup[20]. The unaveraged measured signal was normalized to the value before the magnetizing field was switched off. The magnetizing field amounted to 2 mT, the length of the magnetization pulse was 2 s. The relaxation signal was fitted with the MSM (equation (5)) assuming a saturation magnetization Ms = 4.8·105 A/m (bulk value for magnetite) and T = 296 K. As can be seen the measured curve can be e very nicely modeled for a lognormal core-size distribution with a mean value μc = 20 nm, a standard deviation of ln(dc) σc= 0.23 and an anisotropy constant K = 6265 J/m3. It must be pointed out, however, that the determination of the core diameter is not unique since – stric ctly speaking - one senses rather a distribution of anisotropy energy barriers KVc. In addition, a lower value for the saturation magnetization Ms results in a correspondingly smaller K value.
Fig. 3.
Normalized magnetization-relaxation cycle measured on the immobilized sample. Measurement curve is unaveraged. Dashed line depicts fit of relaxation part with MSM.
III-3. Magnetic Particle Spectroscopy
Magnetic Particle Spectroscopy (MPS) is the most direct technique to investigate the suitability of magnetic nanoparticles as tracers for MPI. The MPS setup utilized here is similar to an ac susceptometer, consisting of a cylindrical excitation coil and a gradiometric detection coil. In contrast to an ac susceptometer, the excitation field amplitude is much larger driving the MNP moments periodically into saturation. Consequently, due to the nonlinear magnetization curve of the MNP, the detection signal contains higher harmonics in addition to the excitation frequency component. The spectrometer utilized in this work operates at an excitation field amplitude of 20 mT at frequencies which can be adjusted between 600 Hz and 10 kHz. Details of the spectrometer can be found in[21].
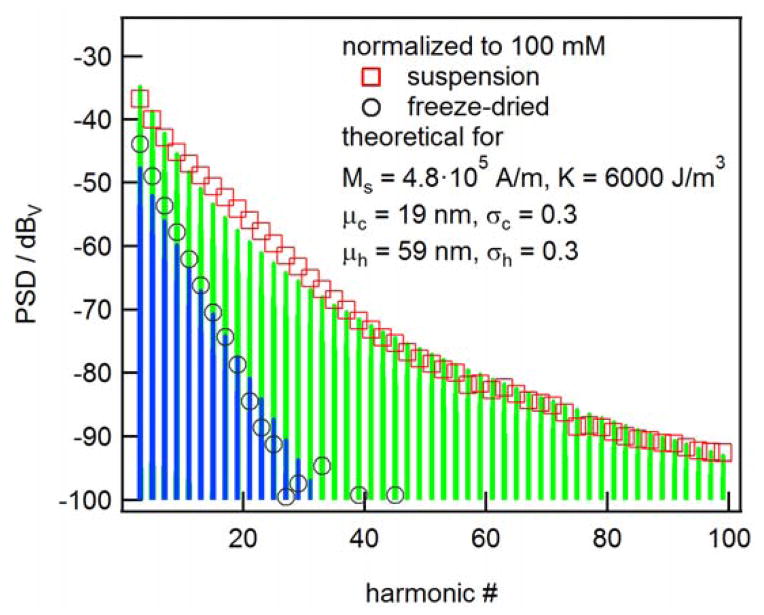
The MPS spectra measured at 10 kHz on a suspension and a freeze-dried reference sample are depicted in Fig. 4. Obviously, there is a difference in the harmonics spectra at 10 kHz indicating that Brownian relaxation affects the suspended particles. Brownian rotation could align the particle anisotropy axes and thus affect the response even if Néel rotation is dominant. Or a part of the nanoparticles in the suspension could follow the sinusoidal excitation field via the Brownian mechanism.
Fig. 4.
MPS spectra measured on suspended and immobilized nanoparticles for excitation frequency of 10 kHz and amplitude of 20 mT.
To simulate the spectra, the model proposed by Ferguson et al. [22]was adapted. In extension to the model described in[22], where a fixed hydrodynamic layer thickness was assumed, we included here a distribution of hydrodynamic diameters f(dh) to more accurately model the Brownian relaxation processes. Consequently, equation (8) in [22] modifies to
| (8) |
Here L(ξ) is the Langevin function and and τ is given by equation (3). For the immobilized reference sample τ = τN and the integration has to be carried out only over the core diameter dc. For the time constants τB and τN, equations (4) and (5) were taken. In Fig. 4, along with the measured magnitudes of the odd harmonics, the spectra calculated for the parameters listed in the inset are shown. Note that only the mean values μc and μh were taken as free parameters and – since the absolute values of the magnitudes are not known – just the relative decays of the harmonics spectra were fitted. The measured spectra can be modelled reasonably well with a set of core and hydrodynamic size distribution parameters which are consistent with the findings from ACS and MRX measurements.
IV. Discussions
The detailed and complementary magnetic measurements on the single-core magnetic nanoparticles provide a self-consistent set of structural parameters which are also in good agreement with the findings from transmission electron microscopy (TEM), static magnetization measurements and dynamic light scattering (DLS). Also, it was found that the MPS spectra measured on suspended and immobilized nanoparticles show significant differences at 10 kHz excitation. This indicates that the inclusion of the dynamics, especially the investigation of the influence of the excitation frequency on the MPS spectra is an important point for a better understanding of the MPS response of single-core magnetic tracers with narrow size distributions.
A crucial point is the theoretical description of the MPS/MPI spectra, which is proportional to the Fourier transform of m(t). In order to simulate the MPS spectra, a combination of the Langevin function with the Debye model was applied. This model is a good first approximation of m(t) and has the advantage that it is easily solved analytically. For the time constants, we used, however, the zero-field expressions that are obviously not applicable at the chosen ac field amplitudes of 20 mT. An expression for the Brownian time constant in a larger ac magnetic field was derived by Yoshida and Enpuku [23] solving the Fokker-Planck equation; however, as mentioned above, to solve for m(t) using the Néel process in a strong field numerical methods are typically required to evaluate the internal energy of the magnetic moment in response to the driving field[7, 24, 25]. To get a physical understanding of the impact of Néel and Brownian reversal during MPS, one can insert the field-dependent expression for the Brownian time constant and, as a first approximation, equation (7) for the field-dependent Néel time constant into equation (8). One finds that there should be no difference in the MPS spectra of mobile and immobilized particles at 10 kHz for the set of nanoparticle parameters determined from ac susceptibility and MRX measurements, i.e., the Néel mechanism is the faster one for all particles. This was in fact shown experimentally in previous MPS studies at 25 kHz for other MNP[7]. Consequently, the used model (equation (8)) is only a rough approach to simulate MPS spectra; for a more precise calculation of complex MPS spectra better models including appropriate expressions for the magnetic-field dependence of the Néel time constant are needed.
As mentioned previously, it is important to determine the magnetic and structural properties of nanoparticles used for MPI. Here, we used three different methods to measure the magnetic energy barrier KV (or KeffV). The results were consistent, with Keff averaging to 5155 J/m3. We note that this self-consistent value of anisotropy is significantly lower than expected for magnetite nanoparticles, where bulk magnetite has a K1 of 11,000 J/m3, and nanoparticles often feature larger K values.
Table 1.
Nanoparticle characterization
| Method | μC [nm] | σC | μH [nm] | σH | Ms [A/m] | K [J/m3] |
|---|---|---|---|---|---|---|
| ACMS | 22.2* | 0.2* | 59 | 0.3 | 4.8·105* | 3200 |
| MRX | 20 | 0.23 | n/a | n/a | 4.8·105* | 6265 |
| MPS | 19 | 0.3* | 59 | 0.3* | 4.8·105* | 6000* |
indicates fixed parameter
Acknowledgments
Work at TU Braunschweig was financially supported by the German BMWi under contract number KF3061201UW2 and at the University of Washington by NIH grants 1R01EB013689-01/NIBIB and 1R41EB013520-01.
Footnotes
Publisher's Disclaimer: This is a PDF file of an unedited manuscript that has been accepted for publication. As a service to our customers we are providing this early version of the manuscript. The manuscript will undergo copyediting, typesetting, and review of the resulting proof before it is published in its final citable form. Please note that during the production process errors may be discovered which could affect the content, and all legal disclaimers that apply to the journal pertain.
References
- 1.Gleich B, Weizenecker J. Tomographic imaging using the nonlinear response of magnetic particles. Nature. 2005;435:1214–1217. doi: 10.1038/nature03808. [DOI] [PubMed] [Google Scholar]
- 2.Gehrke N, Briel A, Ludwig F, Remmer H, Wawrzik T, Wellert S. New Perspectives for MPI: A Toolbox for Tracer Research. International Workshop on Magnetic Particle Imaging, Springer Proceedings in Physics; Germany. 2012. pp. 99–103. [Google Scholar]
- 3.Ludwig F, Wawrzik T, Yoshida T, Gehrke N, Briel A, Eberbeck D, Schilling M. Optimization of Magnetic Nanoparticles for Magnetic Particle Imaging. IEEE Transactions on Magnetics. 2012;48:3780–3783. [Google Scholar]
- 4.Löwa N, Eberbeck D, Steinhoff U, Wiekhorst F, Trahms L. Potential of Improving MPI Performance by Magnetic Separation. International Workshop of Magnetic Particle Imaging, Springer Proceedings in Physics; Germany. 2012. pp. 73–78. [Google Scholar]
- 5.Arami H, Ferguson RM, Khandhar AP, Krishnan KM. Size-dependent ferrohydrodynamic relaxometry of magnetic particle imaging tracers in different environments. Medical Physics. 2013;40 doi: 10.1118/1.4810962. [DOI] [PMC free article] [PubMed] [Google Scholar]
- 6.Ferguson RM, Khandhar AP, Krishnan KM. Tracer design for magnetic particle imaging. Journal of Applied Physics. 2012;111:07B318. doi: 10.1063/1.3676053. [DOI] [PMC free article] [PubMed] [Google Scholar]
- 7.Ferguson RM, Khandhar A, Arami H, Hua L, Hovorka O, Krishnan KM. Tailoring the magnetic and pharmacokinetic properties of iron oxide MPI tracers. Biomedical Engineering (Biomedizinische Technik) 2013:1–15. doi: 10.1515/bmt-2012-0058. [DOI] [PMC free article] [PubMed] [Google Scholar]
- 8.Ferguson RM, Khandhar AP, Arami H, Saritas EU, Croft LR, Goodwill PW, Halkola A, Rahmer J, Conolley SM, Krishnan KM. Magnetic Particle Imaging with Safe. Tailored Iron Oxide Nanoparticle Tracers, IEEE Transaction on Medical Imaging. 2013 doi: 10.1109/TMI.2014.2375065. Submitted. [DOI] [PMC free article] [PubMed] [Google Scholar]
- 9.Khandhar AP, Ferguson RM, Simon JA, Krishnan KM. Tailored magnetic nanoparticles for optimizing magnetic fluid hyperthermia. Journal of Biomedical Materials Research Part A. 2012;100A:728–737. doi: 10.1002/jbm.a.34011. [DOI] [PMC free article] [PubMed] [Google Scholar]
- 10.Khandhar AP, Ferguson RM, Simon JA, Krishnan KM. Enhancing cancer therapeutics using size-optimized magnetic fluid hyperthermia. Journal of Applied Physics. 2012;111:07B306. doi: 10.1063/1.3671427. [DOI] [PMC free article] [PubMed] [Google Scholar]
- 11.Chantrell R, Popplewell J, Charles S. Measurements of particle size distribution parameters in ferrofluids. IEEE Transactions on Magnetics. 1978;14:975–977. [Google Scholar]
- 12.Ferguson RM, Khandhar AP, Jonasson C, Blomgren J, Johansson C, Krishnan KM. Size-dependent relaxation properties of monodisperse magnetite nanoparticles measured over seven decades of frequency by AC Susceptometry. IEEE Transactions on Magnetics. 2013;49:3441–3444. doi: 10.1109/TMAG.2013.2239621. [DOI] [PMC free article] [PubMed] [Google Scholar]
- 13.Ludwig F, Guillaume A, Schilling M, Frickel N, Schmidt AM. Determination of core and hydrodynamic size distributions of CoFe2O4 nanoparticle suspensions using ac susceptibility measurements. Journal of Applied Physics. 2010;108 [Google Scholar]
- 14.Chung SH, Hoffmann A, Guslienko K, Bader SD, Liu C, Kay B, Makowski L, Chen L. Biological sensing with magnetic nanoparticles using Brownian relaxation (invited) Journal of Applied Physics. 2005;97 [Google Scholar]
- 15.Ludwig F. Characterization of magnetic core-shell nanoparticle suspensions using ac susceptibility for frequencies up to 1 MHz. AIP Conf Proc. 2010;1311:249–254. [Google Scholar]
- 16.Ludwig F, Heim E, Eberbeck D, Schwarz K, Trahms L, Schilling M. Comparison and Calibration of Fluxgate and SQUID Magnetorelaxometry Techniques for the Characterization of Magnetic Core-Shell Nanoparticles. Ieee Transactions on Magnetics. 2009;45:4857–4860. [Google Scholar]
- 17.Eberbeck D, Wiekhorst F, Steinhoff U, Trahms L. Aggregation behaviour of magnetic nanoparticle suspensions investigated by magnetorelaxometry. Journal of Physics-Condensed Matter. 2006;18:S2829–S2846. [Google Scholar]
- 18.Chantrell RW, Hoon SR, Tanner BK. Time-dependent Magnetization in Fine-particle Ferromagnetic Systems. Journal of Magnetism and Magnetic Materials. 1983;38:133–141. [Google Scholar]
- 19.Ludwig F, Heim E, Schilling M. Characterization of superparamagnetic nanoparticles by analyzing the magnetization and relaxation dynamics using fluxgate magnetometers. Journal of Applied Physics. 2007;101 [Google Scholar]
- 20.Ludwig F, Mauselein S, Heim E, Schilling M. Magnetorelaxometry of magnetic nanoparticles in magnetically unshielded environment utilizing a differential fluxgate arrangement. Review of Scientific Instruments. 2005;76 [Google Scholar]
- 21.Wawrzik T, Schilling M, Ludwig F. Perspectives of magnetic particle spectroscopy for magnetic nanoparticle characterization. International Workshop on Magnetic Particle Imaging, Springer Proceedings in Physics; Germany. 2012. pp. 41–46. [Google Scholar]
- 22.Ferguson RM, Minard KR, Khandhar AP, Krishnan KM. Optimizing magnetite nanoparticles for mass sensitivity in magnetic particle imaging. Medical Physics. 2011;38:1619–1626. doi: 10.1118/1.3554646. [DOI] [PMC free article] [PubMed] [Google Scholar]
- 23.Yoshida T, Enpuku K. Simulation and Quantitative Clarification of AC Susceptibility of Magnetic Fluid in Nonlinear Brownian Relaxation Region. Japanese Journal of Applied Physics. 2009;48 [Google Scholar]
- 24.Carrey J, Mehdaoui B, Respaud M. Simple models for dynamic hysteresis loop calculations of magnetic single-domain nanoparticles: Application to magnetic hyperthermia optimization. Journal of Applied Physics. 2011;109:083921. [Google Scholar]
- 25.Weizenecker J, Gleich B, Rahmer J, Borgert J. Micro-magnetic simulation study on the magnetic particle imaging performance of anisotropic mono-domain particles. Physics in Medicine and Biology. 2012;57:7317–7327. doi: 10.1088/0031-9155/57/22/7317. [DOI] [PubMed] [Google Scholar]


