Abstract
Mobile elements constitute greater than 45% of the human genome as a result of repeated insertion events during human genome evolution. Although most of mobile elements are fixed within the human population, some elements (including ALU, long interspersed elements (LINE) 1 (L1), and SVA) are still actively duplicating and may result in life-threatening human diseases such as cancer, motivating the need for accurate mobile-element insertion (MEI) detection tools. We developed a software package, TANGRAM, for MEI detection in next-generation sequencing data, currently serving as the primary MEI detection tool in the 1000 Genomes Project. TANGRAM takes advantage of valuable mapping information provided by our own MOSAIK mapper, and until recently required MOSAIK mappings as its input. In this study, we report a new feature that enables TANGRAM to be used on alignments generated by any mainstream short-read mapper, making it accessible for many genomic users. To demonstrate its utility for cancer genome analysis, we have applied TANGRAM to the TCGA (The Cancer Genome Atlas) mutation calling benchmark 4 dataset. TANGRAM is fast, accurate, easy to use, and open source on https://github.com/jiantao/Tangram.
Keywords: mobile-element insertion, structural variation, ALU
Republication Notice
An editorial error resulted in this article appearing in the wrong supplementary issue, here: Lee et al. Toolbox for Mobile-Element Insertion Detection on Cancer Genomes. Cancer Informatics 2014:13(S4) 45–52 doi: 10.4137/CIN.S13979. The article has now been republished here in the correct issue. The full text remains available in both issues for readers’ convenience. For citation purposes, please use the details of this republished version: Lee et al. Toolbox for Mobile-Element Insertion Detection on Cancer Genomes. Cancer Informatics 2015:14(S1) 37–44 doi: 10.4137/CIN.S24657.
Introduction
Mobile elements, or transposable elements, can be categorized as either class I (retrotransposons, RNA-mediated “copy and paste” mechanisms) or class II (transposons, DNA-mediated “cut and paste” mechanisms), and they proliferate in the human genome by integrating new copies through RNA intermediates in human evolutionary history.1,2 As a result, nearly half of the human genome is derived from mobile elements.3,4 Although most of mobile elements are inactive and fixed within the human population, some younger elements (including ALU, long interspersed elements (LINE) 1 (L1), and SVA) are still actively duplicating and may result in human life-threatening diseases eg, cancer.5–8 Characterizing mobile-element insertions (MEIs) is therefore an important task when tracking down the causes of such diseases.
In the past, detecting MEIs was labor-intensive and time consuming, and it was impossible to detect MEI on a genome scale. Next-generation sequencing technologies have revolutionized variant detection, including new approaches to MEI discovery, making it possible to cost effectively sequence individuals or larger cohorts, and comprehensively detect MEIs in the resulting data. Previously, we developed an early MEI detector program, SPANNER, and deployed it on the 1000 Genomes Project9,10 Pilot dataset compiling the most comprehensive catalog of MEI events in the human genome to date.11 Although effective, SPANNER was computationally expensive and not easily portable, precluding its use by scientists wishing to study MEIs in larger datasets.
Recently, we developed the TANGRAM software (https://github.com/jiantao/Tangram) to overcome some of these limitations. TANGRAM is fast, accurate, and easy to use, and it is currently employed in the 1000 Genomes Project Phase-III dataset, which consists of a collection of whole-genome sequencing data from over 2500 samples across 26 populations. PCR validation experiments by the 1000 Genomes Project Structural Variation Group (data not shown) indicates an FDR of 5.96%, a rate far better than which is much better than was achieved with RetroSeq12 (17.61%) and VariationHunter,13 (26.86%). However, a major limitation of TANGRAM is that is was originally designed to work only with the short-read mapper MOSAIK.14 Here, we enabled TANGRAM to work with other popular short-read mappers. As somatic MEIs may play a role in cancer genome evolutions, we demonstrate the utility of the TANGRAM program for cancer genomes, using the TCGA15 Mutation Calling Benchmark 4 dataset.
Method
For the theoretical completeness, we review the main methodology of TANGRAM in the first subsection. Then, we introduce a new feature and the filtering strategy in the second and third subsections. The proposed feature enables TANGRAM to handle alignments mapped by other short-read mappers rather than MOSAIK.
TANGRAM algorithm overview
TANGRAM detects MEIs on paired-end sequencing reads that consist of two mates from both ends of DNA segments (Fig. 1A). The distance, insert length, between two mates of a read is determined. According to alignments of two mates of reads, we categorize reads into three groups if they are sequenced from MEI regions. Figure 1B–D shows the characters of these three groups. Notice that reads are sequenced from a given sample and mapped against the reference genome.
Figure 1.
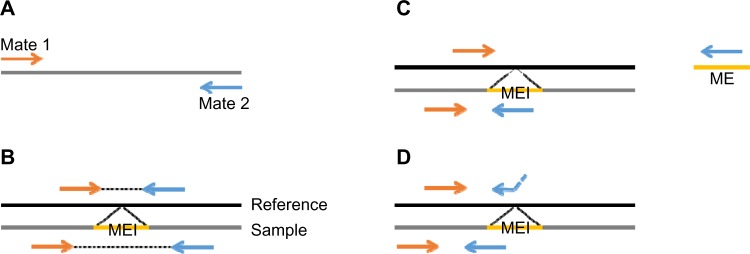
The example of paired-end reads and their alignments in MEI regions. (A) A paired-end read consists of two mates from both ends of a DNA segment. The distance between two mates is determined. (B) An MEI is inserted between two mates, and because the MEI is not present in the reference genome, the distance between the two mates is shorter when mapping the mates to the reference genome. (C) The orange-colored mate is well mapped to the reference genome while the other mate is highly similar to a mobile-element sequence. (D) The blue-colored mate crosses an MEI breakpoint and thus alignment of it can be divided into two parts. The first partial alignment is still in the reference genome and the second partial alignment is in the mobile-element sequence.
The first group is the collection of alignments of mates showing short insert length. As shown in Figure 1B, an MEI is inserted between two mates of a read, and because the MEI is not present in the reference genome, the distance between the two mates is shorter when mapping the mates to the reference genome. Therefore, calculating the distribution of distances between two mates helps the tool to roughly locate MEI regions. The second group is that one mate is uniquely mapped to the reference genome while the other mate is mapped to a mobile-element sequence obtained from RepBase16 (the sequences are listed in Table 1), as shown in Figure 1C. This information is provided by MOSAIK. MOSAIK checks each mate against the mobile-element sequences when mapping it, and once the similarity is found between a mate and any mobile-element sequences, MOSAIK marks this mate with additional tags in outputted files. TANGRAM then is able to acquire this information by parsing MOSAIK output files. The length of mobile-element sequences (about 100,000 basepairs) is far shorter than the human reference genome, and thus the cost of checking similarities between mates and mobile-element sequences is tiny. The third group is mates crossing breakpoints of MEIs. In Figure 1D, the blue-colored mate crosses an MEI breakpoint and thus alignment of it can be divided into two parts. The first partial alignment is still in the reference genome and the second partial alignment is in the mobile-element sequence, which is split-read (SR) alignment. By adopting the SR approach, TANGRAM achieves single-nucleotide breakpoint resolution, which means that the exact breakpoints of MEIs are able to be detected. Combining signals provided by those groups of alignments, TANGRAM gains high sensitivity and lowers FDR.
Table 1.
The mobile-element sequences used in the study. The list is abbreviated by merging highly similar sequences.
| ALU.ALUY (RepBase14.02) |
| ALU.ALUSP (RepBase14.02) |
| ALU.ALUYB8 (RepBase14.02) |
| ALU.ALUYD2 (RepBase14.02) |
| L1.L1 (RepBase14.02) |
| L1.L1HS (RepBase14.02) |
| L1.L1PA10 (RepBase14.02) |
| L1.L1PA11 (RepBase14.02) |
| L1.L1PA12 (RepBase14.02) |
| L1.L1PA13 (RepBase14.02) |
| L1.L1PA14 (RepBase14.02) |
| L1.L1PA15 (RepBase14.02) |
| L1.L1PA16 (RepBase14.02) |
| L1.L1PA17_5 (RepBase14.02) |
| L1.L1PA2 (RepBase14.02) |
| L1.L1PA3 (RepBase14.02) |
| L1.L1PA4 (RepBase14.02) |
| L1.L1PA5 (RepBase14.02) |
| L1.L1PA6 (RepBase14.02) |
| L1.L1PA7 (RepBase14.02) |
| L1.L1PA8 (RepBase14.02) |
| SVA.SVA (RepBase14.02) |
| POLYA |
| HERVK GA(Lee and Bieniasz, PLoS Pathogens, 2007) |
TANGRAM applicability to other mappers
TANGRAM relies on MOSAIK to check mates mapped to mobile-element sequences. Although high-quality result of TANGRAM is consequently acquired, it precludes studies on other short-read mappers’ alignments. Moreover, re-alignment may be expensive. We are thus motivated to eliminate this barrier to make TANGRAM more general.
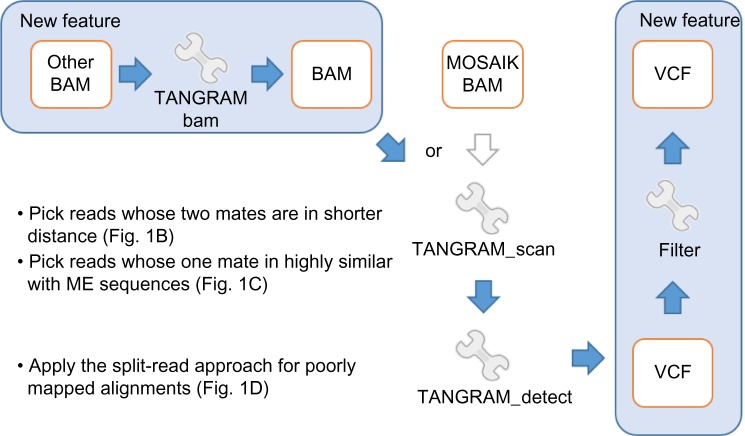
This new function of TANGRAM seeks problematic reads that are one mate is aligned well while the other one may be unmapped, mapped to other chromosomes, mapped with low-quality value, or most of bases clipped. These poorly mapped mates are picked and aligned against the mobile-element sequences (Table 1). The re-alignment is performed by utilizing an SIMD (single instruction multiple data) Smith–Waterman (SW) algorithm,17 which produces the optimal pairwise alignment between two sequences and is about several tens fold faster compared with conventional SW implements. Like MOSAIK’s behavior, if the similarity is found between mates and any mobile-element sequences, then alignments of mates are marked by additional tags in outputted files. This function simulates MOSAIK and provides the information of the second group of alignments, which is illustrated in Figure 1C. Consequently, TANGRAM is able to handle alignments generated by other short-read mappers. The complete pipeline is shown in Figure 2. It can be seen that if a MOSAIK BAM file is given, the pipeline processes this BAM file by TANGRAM_scan directly. However, if the given BAM file is generated by other short-read mappers, TANGRAM_bam needs to patch the information and then generates a BAM file that will be processed by TANGRAM_scan.
Figure 2.
The complete pipeline used in this study.
Notes: The blue-colored arrows indicate the algorithm flow and the blue-shaded blocks show the new features proposed in this study.
We describe more details of TANGRAM_bam, which is the new feature that we propose for BAMs generated by other aligners. TANGRAM_bam can be used for the whole-genome or each chromosome analysis. For whole-genome analysis, TANGRAM_bam processes every alignment in BAM files and each poorly alignment will be applied SIMD SW against the mobile-element sequences. Once the similarity is found between an alignment and the mobile-element sequences, a flag of the alignment will be marked. Then, we search the memory pool for looking for the other mate of the alignment. Note that there are two alignments of two mates of a paired-end read. If the memory pool searching succeeds, TANGRAM_bam removes the finding from the memory pool and reports both alignments of a paired-end read in outputted BAM file. The flags indicating the similarities between the mobile-element sequences are also reported in BAM file. If the memory pool searching fails, which means that TANGRAM_bam has not processed its mate, the current alignment will be kept in the memory pool.
For the analysis of a chromosome, TANGRAM_bam processes alignments that themselves are in the specified chromosome and their mates are not (a paired-end read consists of two mates). These alignments not in the specified chromosome are applied SIMD SW against the mobile-element sequences to check the similarity between the mobile-element sequences and kept in the memory pool. Then, TANGRAM_bam processes each alignment in the specified chromosome and searches its mate in the memory pool. If two mates of a paired-end read are both in the specified chromosome, then TANGRAM_bam treats them as the whole-genome analysis. It can be seen that handling chromosome separately is more memory efficient. This is the function how TANGRAM patches information provided by MOSAIK if alignments are not done by MOSAIK.
Filtering strategy
TANGRAM_detect reports any possible MEIs based on the evidence provided by alignments. However, some MEIs may be false positive caused by artificial alignments. It is more often to see them in deeper coverage datasets. Therefore, the number of detected MEIs may be affected by the coverage of alignments because deeper coverage often provides more evidential alignments. Of course, they may be noise leading to false-positive MEIs. To avoid reporting false-positive MEIs, we design a filter to remove low-quality calls. All reported MEIs should have SR evidential alignments from either side of insertions. As SR alignments are sensitive to insertions, MEIs having SR alignments from both sides should be high-quality calls. The exact inserted bases are thus able to be obtained by using this filter.
Results
The pipeline is performed on TCGA mutation calling benchmark 4 dataset (https://cghub.ucsc.edu/datasets/benchmark_download.html). The purpose of the benchmark exercise is comparative evaluation of somatic mutation calls on single-nucleotide variants (SNVs) and structural variants (SVs) under a variety of conditions designed to simulate the effects of tumor purity and subclonal expansions. We utilize the benchmark to evaluate MEI detection of TANGRAM. TANGRAM is applied on the released alignments directly, which are mapped by BWA.18 Although three types of MEIs are reported by TAMGRAM, ALUs, L1s, and SVAs, we discuss results on ALUs only in the following sections, because we have the most confidence in ALU detection. Next-generation sequencing data are capable to accurately detect ALU insertions because the length of ALUs is up to 300 bp. In this length spectrum, while one mate of a paired-end read is in an ALU insertion, the other mate is still located in the reference genome that is a confident anchor to locate the ALU insertion region in the reference genome. Moreover, the distribution of distances between two alignments of a paired-end read (Fig. 1B) provides better sensitivity of ALU detection if the current technology uses several hundred basepairs between two mates.
High coverage normal vs. tumor cell lines
The first exercise consists of two comparisons. Each of them consists of normal samples derived from blood (HCC1143_BL and HCC1954_BL) and tumor samples derived from grade 3 breast ductal carcinomas (HCC1143_T and HCC1954_T). The coverage of HCC1143_BL, HCC1954_BL, HCC1143_T, and HCC1954_T are 60×, 71×, 50×, and 58×, respectively. We detect ALUs on each individually and then check the intersection on each comparison, as shown in Figure 3.
Figure 3.

The comparisons of the ALU insertions between normal and tumor cell lines. The coverages of HCC1143_BL (normal), HCC1954_BL (normal), HCC1143_T (tumor), and HCC1954_T (tumor) are 60×, 71×, 50×, and 58×, respectively. Note that the number of detected ALU insertions may be affected by the coverage. In normal samples, we call 153 and 256 ALU insertions in HCC1143_BL and HCC1954_BL, and 44.45 and 33.98% share with the tumor samples. In all, 52 and 71 ALU insertions are detected in the tumor samples uniquely.
Both normal samples (HCC1143_BL and HCC1954_BL) have more ALU insertions, and it could be caused by the coverage of normal samples higher than tumor samples. In normal samples, we call 153 and 256 ALU insertions on HCC1143_BL and HCC1954_BL, and 44.45 and 33.98% share with the tumor samples (HCC1143_T and HCC1954_T), which means that the same ALUs are also found in the tumor samples in 50 basepairs. In all, 52 and 71 ALU insertions are detected uniquely in the tumor samples.
Tumor/normal mixtures vs. normal and tumor cell lines
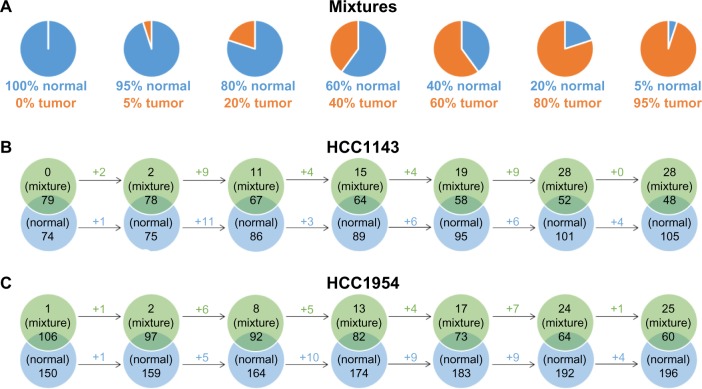
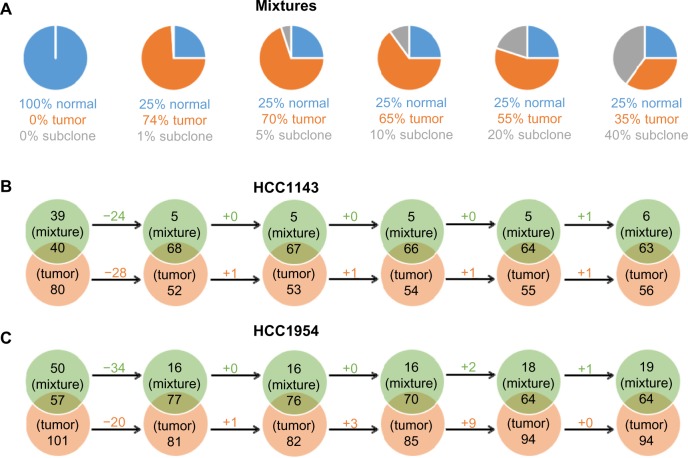
To evaluate the effect of sample contamination, the benchmark simulates varying levels of normal contamination in tumor samples. Seven simulations are derived from normal and tumor samples for HCC1143 and HCC1954 separately, as illustrated in Figure 4A. The 100% normal is a subset of reads in normal cell line (HCC1143_BL or HCC1954_BL) with the coverage 30×. The original coverages of HCC1143_BL or HCC1954_BL are 60× and 71×. Then, tumor/normal mixtures consist of different combinations of reads from normal 30× and tumor cell line (HCC1143_T or HCC1954_T) to simulate different levels of normal contamination in tumor samples. In Figure 4A, blue and orange represent the contribution of reads derived from normal 30× and tumor cell line, respectively. We then call ALUs on those seven mixtures to understand the effect of the tool on different levels of contamination.
Figure 4.
The comparisons of tumor/normal mixtures and normal cell lines (HCC1143_BL and HCC1954_BL). (A) The 100% normal is a subset of reads in normal cell line (HCC1143_BL or HCC1954_BL) with the coverage 30×. Tumor/normal mixtures consist of different combinations of reads from normal 30× and tumor cell line (HCC1143_T or HCC1954_T). (B) and (C) The comparisons of ALUs insertions on mixtures and normal cell lines. The falling rate of ALUs in the intersections is milder than the falling rate of normal reads in mixtures, which means that TANGRAM is indeed affected by the contamination but not severely.
The results are shown in Figure 4B and C. Each ALU callset detected on a tumor/normal mixture is compared with the one on HCC1143_BL (normal) or HCC1954_BL (normal). As normal 30× is the subset of HCC1143_BL or HCC1954_BL, ideally there should be no unique ALU in the callset on normal 30×. However, we detect one unique ALU on normal 30× of HCC1954, which is actually found on HCC1954_BL as well but it is filtered out because of its low quality. In Figure 4B and C, from the left-hand to the right-hand sides, as the percentages of normal reads decrease, replaced by tumor reads, the intersections between mixtures and HCC1143_BL or HCC1954_BL decrease because reads in mixtures for those intersection ALUs are substituted by tumor reads. Moreover, the unique ALUs of HCC1143_BL or HCC1954_BL therefore increase. It is notable that the falling rate of ALUs in the intersections is milder than the falling rate of normal reads, which means that TANGRAM is indeed affected by the contamination but not severely.
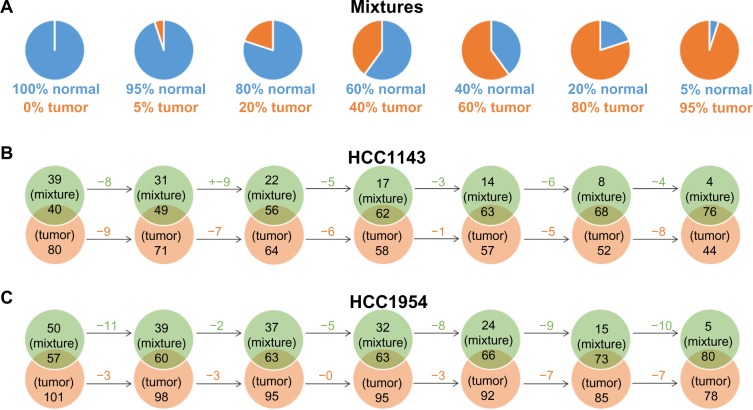
We also compare the detected ALUs on mixtures to the ones on HCC1143_T (tumor) or HCC1954_T (tumor). We expect to see the larger intersections of ALUs between mixtures and HCC1143_T or HCC1954_T as more tumor reads are added in mixtures (from the left-hand to the right-hand sides in Fig. 5B and C); meanwhile, the number of unique ALUs on HCC1143_T or HCC1954_T decreases when more tumor reads are added in mixtures.
Figure 5.
The comparisons of tumor/normal mixtures and tumor cell lines (HCC1143_T and HCC1954_T). (A) The 100% normal is a subset of reads in normal cell line (HCC1143_BL or HCC1954_BL) with the coverage 30×. Tumor/normal mixtures consist of different combinations of reads from normal 30× and tumor cell line (HCC1143_T or HCC1954_T). (B) and (C) The comparisons of ALUs insertions on mixtures and tumor cell lines. The larger intersection ALUs between mixtures and HCC1143_T or HCC1954_T are obtained as more tumor reads are added in mixtures.
Tumor/normal/subclone mixtures vs. normal and tumor cell lines
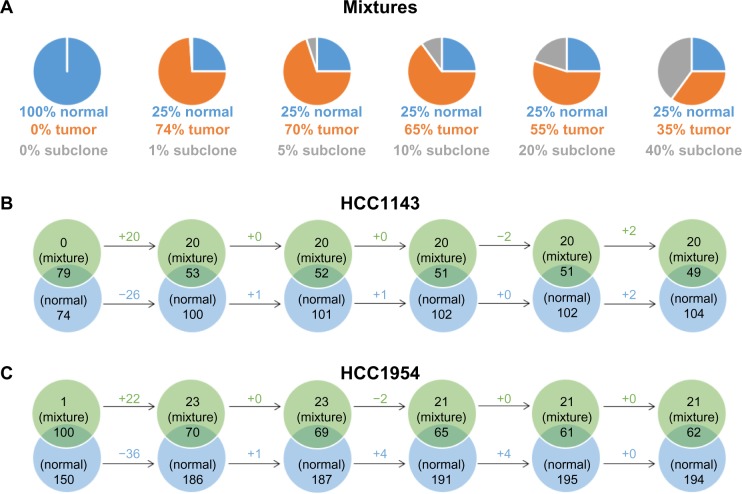
The third dataset provided in the benchmark is tumor/normal/subclone mixture. In the dataset, ∼500 novel SNVs and ∼200 novel SVs are spiked into each subclone using a simulator, https://github.com/adamewing/bamsurgeon. Subclonal mutations are added as heterozygous in the subclone, combining with normal and tumor reads to create a subclone spike-in mixture. The percentages of reads from normal, tumor, and subclonal mutations are given in Figure 6A.
Figure 6.
The comparisons of tumor/normal/subclone mixtures and normal cell lines (HCC1143_BL and HCC1954_BL). (A) In all, ∼500 novel SNVs and ∼200 novel SVs are spiked into each subclone, combining with normal and tumor reads to create a subclone spike-in mixture. (B) and (C) The comparisons of ALUs insertions on mixtures and normal cell lines. We infer that ALUs are not included in subclonal mutations because we do not see more ALUs as more subclonal mutations spiked in (from the left-hand to the right-hand sides).
The manuscript of the benchmark does not specify types of subclonal mutations. However, in the result, we infer that ALUs are not included in subclonal mutations because we do not see more ALUs as more subclonal mutations spiked in. In Figure 6B and C, from the left-hand to the right-hand sides, the numbers of unique ALUs on mixtures are not likely to change. Therefore, we do not think that ALUs are included in subclonal mutations. The consistency of intersection ALUs and unique ALUs on HCC1143_BL and HCC1954_BL is because the percentage of normal reads in mixtures is not changed. The comparison between mixtures and tumors (HCC1143_T and HCC1954_T) is given in Figure 7. As tumor reads are replaced by subclone reads in mixtures, the unique ALUs of tumor samples increase slightly.
Figure 7.
The comparisons of tumor/normal/subclone mixtures and tumor cell lines (HCC1143_T and HCC1954_T). (A) In all, ∼500 novel SNVs and ∼200 novel SVs are spiked into each subclone, combining with normal and tumor reads to create a subclone spike-in mixture. (B) and (C) The comparisons of ALUs insertions on mixtures and tumor cell lines. As fewer tumor reads are in mixtures, the intersection ALUs between mixtures and tumor cell lines decrease while the unique ALUs of tumor samples increase slightly.
Discussion
There are two more cases that we have not considered in TANGRAM. With continuing advances in sequencing technologies, the average read length of sequenced reads continues to increase. We therefore believe that these two cases will become common and useful signals in MEI detection on next-generation sequencing data.
The first one is that one mate crosses an MEI breakpoint while the other mate is mapped into an ME sequence. For example in Figure 1C, the orange-colored mate crosses the breakpoint and the blue-colored mate is entirely in the ME. To take those alignments into account, we need to recognize mates crossing breakpoints as anchors to locate MEIs. To achieve this goal, we check alignments having lots of clipped bases and those clipped bases are exactly in the ME sequences. We did not take those alignments as anchors because the quality of them is not good when reads are short. However, we do see them in 250 bp alignments. The second one is that a mate may cover entire MEIs and three partial alignments should be obtained, alignment to the reference genome followed by alignment to ME sequences followed by alignment to the reference genome again. We are working on providing those features in the near future.
Conclusion
Mobile elements are abundant in the human genome and some MEI events are associated with cancer. To fully understand MEIs in the genome of an individual, we implemented TANGRAM and applied it to cancer genomes, TCGA mutation calling benchmark 4 dataset. The purpose of the benchmark exercise is comparative evaluation of MEI calls under a variety of conditions designed to simulate the effects of tumor purity and subclonal expansions. The results show that TANGRAM is indeed affected by the contamination but not severely. As we do not think MEIs included as subclonal mutations, we cannot conclude from the experiments of subclonal expansions. Currently, TANGRAM serves to alignments mapped by any short-read mapper and is available on https://github.com/jiantao/Tangram.
Footnotes
Author Contributions
Conceived and designed the experiments: WL, JW, GM. Analyzed the data: WL. Wrote the first draft of the manuscript: WL. Contributed to the writing of the manuscript: WL. Agree with manuscript results and conclusions: WL. Jointly developed the structure and arguments for the paper: WL, GM. Made critical revisions and approved final version: WL, GM. Software development: JW, WL. All authors reviewed and approved of the final manuscript.
ACADEMIC EDITOR: JT Efird, Editor in Chief
FUNDING: W-PL reports grants (R01 HG004719 and U01 HG006513) from the National Institutes of Health. The authors confirm that the funder had no influence over the study design, content of the article, or selection of this journal.
COMPETING INTERESTS: Authors disclose no potential conflicts of interest.
This paper was subject to independent, expert peer review by a minimum of two blind peer reviewers. All editorial decisions were made by the independent academic editor. All authors have provided signed confirmation of their compliance with ethical and legal obligations including (but not limited to) use of any copyrighted material, compliance with ICMJE authorship and competing interests disclosure guidelines and, where applicable, compliance with legal and ethical guidelines on human and animal research participants. Provenance: the authors were invited to submit this paper.
REFERENCES
- 1.Deininger PL, Batzer MA, Hutchison CA, Edgell MH. Master genes in mammalian repetitive DNA amplification. Trends Genet. 1992;8(9):307–11. doi: 10.1016/0168-9525(92)90262-3. [DOI] [PubMed] [Google Scholar]
- 2.Cordaux R, Hedges DJ, Batzer MA. Retrotransposition of Alu elements: how many sources? Trends Genet. 2004;20(10):464–7. doi: 10.1016/j.tig.2004.07.012. [DOI] [PubMed] [Google Scholar]
- 3.Xing J, Witherspoon DJ, Jorde LB. Mobile element biology: new possibilities with high-throughput sequencing. Trends Genet. 2013;29(5):280–9. doi: 10.1016/j.tig.2012.12.002. [DOI] [PMC free article] [PubMed] [Google Scholar]
- 4.Batzer MA, Deininger PL. Alu repeats and human genomic diversity. Nat Rev Genet. 2002;3(5):370–9. doi: 10.1038/nrg798. [DOI] [PubMed] [Google Scholar]
- 5.Economou-Pachnis A, Tsichlis PN. Insertion of an Alu SINE in the human homologue of the Mlvi-2 locus. Nucleic Acids Res. 1985;13(23):8379–7. doi: 10.1093/nar/13.23.8379. [DOI] [PMC free article] [PubMed] [Google Scholar]
- 6.Nyström-Lahti M, Kristo P, Nicolaides NC, et al. Founding mutations and Alu-mediated recombination in hereditary colon cancer. Nat Med. 1995;1(11):1203–6. doi: 10.1038/nm1195-1203. [DOI] [PubMed] [Google Scholar]
- 7.Lee E, Iskow R, Yang L, et al. Landscape of somatic retrotransposition in human cancers. Science. 2012;337(6097):967–71. doi: 10.1126/science.1222077. [DOI] [PMC free article] [PubMed] [Google Scholar]
- 8.Sargurupremraj M, Wjst M. Transposable elements and their potential role in complex lung disorder. Respir Res. 2013;14:99. doi: 10.1186/1465-9921-14-99. [DOI] [PMC free article] [PubMed] [Google Scholar]
- 9.The 1000 Genomes Project Consortium A map of human genome variation from population-scale sequencing. Nature. 2010;467(7319):1061–73. doi: 10.1038/nature09534. [DOI] [PMC free article] [PubMed] [Google Scholar]
- 10.The 1000 Genomes Project Consortium An integrated map of genetic variation from 1,092 human genomes. Nature. 2012;491(7422):56–65. doi: 10.1038/nature11632. [DOI] [PMC free article] [PubMed] [Google Scholar]
- 11.Stewart C, Kural D, Strömberg MP, et al. A comprehensive map of mobile element insertion polymorphisms in humans. PLoS Genet. 2011;7(8):1. doi: 10.1371/journal.pgen.1002236. [DOI] [PMC free article] [PubMed] [Google Scholar]
- 12.Keane TM, Wong K, Adams DJ. RetroSeq: transposable element discovery from next-generation sequencing data. Bioinformatics. 2013;29(3):389–90. doi: 10.1093/bioinformatics/bts697. [DOI] [PMC free article] [PubMed] [Google Scholar]
- 13.Hormozdiari F, Hajirasouliha I, Dao P, et al. Next-generation VariationHunter: combinatorial algorithms for transposon insertion discovery. Bioinformatics. 2010;26(12):i350–7. doi: 10.1093/bioinformatics/btq216. [DOI] [PMC free article] [PubMed] [Google Scholar]
- 14.Lee W-P, Stromberg MP, Ward A, Stewart C, Garrison EP, Marth GT. MOSAIK: a hash-based algorithm for accurate next-generation sequencing short-read mapping. PLoS One. 2014;9(3):e90581. doi: 10.1371/journal.pone.0090581. [DOI] [PMC free article] [PubMed] [Google Scholar]
- 15.Cancer Genome Atlas Research Network Comprehensive genomic characterization defines human glioblastoma genes and core pathways. Nature. 2008;455(7216):1061–8. doi: 10.1038/nature07385. [DOI] [PMC free article] [PubMed] [Google Scholar]
- 16.Kohany O, Gentles AJ, Hankus L, Jurka J. Annotation, submission and screening of repetitive elements in Repbase: RepbaseSubmitter and Censor. BMC Bioinformatics. 2006;7(1):474. doi: 10.1186/1471-2105-7-474. [DOI] [PMC free article] [PubMed] [Google Scholar]
- 17.Zhao M, Lee W-P, Garrison EP, Marth GT. SSW Library: an SIMD Smith-Waterman C/C++ library for use in genomic applications. PLoS One. 2013;8(12):e82138. doi: 10.1371/journal.pone.0082138. [DOI] [PMC free article] [PubMed] [Google Scholar]
- 18.Li H, Durbin R. Fast and accurate short read alignment with Burrows-Wheeler transform. Bioinformatics. 2009;25(14):1754–60. doi: 10.1093/bioinformatics/btp324. [DOI] [PMC free article] [PubMed] [Google Scholar]


