

Abstract
Objective
To characterize biological and technical factors which influence cerebrospinal fluid (CSF) Alzheimer's disease (AD) biomarker levels, including the presence of apolipoprotein E (APOE) ε4 allele, AD diagnosis, Aβ-binding proteins, sample processing, and preanalytical handling.
Methods
CSF was collected from 140 subjects with normal cognition, mild cognitive impairment, AD, and non-AD dementia. CSF levels of beta-amyloid 1–42 (Aβ42), total Tau (t-Tau), and Tau phosphorylated at threonine 181 (p-Tau181) were analyzed following the standard and modified protocols. CSF levels of apoJ, apoE, albumin, and α-synuclein were measured in a subgroup (n = 69), and their effects on measured AD biomarker levels were also determined in vitro using human CSF samples.
Results
CSF Aβ42 levels measured using the AD Neuro-imaging Initiative (ADNI) protocol (which we call suspended Aβ42 or susAβ) were lower than total measurable CSF Aβ42 in all groups, and on average represents 57% of the latter. Logistic regression analysis showed this proportion (% susAβ) to be directly correlated with CSF Aβ42 and apoJ levels, but inversely correlated with CSF t-Tau levels. Finally, we showed in vitro that increasing apoE and apoJ levels directly increased % susAβ.
Conclusion
CSF susAβ levels are influenced by biological and technical factors, and may represent a marker of Aβ susceptible to lipoprotein-mediated clearance. Clinical trials should include total measurable Aβ42 and susAβ to better inform outcomes.
Introduction
Recent guidelines for Alzheimer's disease diagnosis (AD) called for increased use of AD biomarkers during presymptomatic and symptomatic phases.1–3 Cerebrospinal fluid (CSF) levels of β-amyloid 1–42 (Aβ42), total tau (T-tau), and tau phosphorylated at threonine 181 (p-tau181) represent such biomarkers, and altered levels of these biomarkers are highly associated with future conversion to dementia due to AD pathology.4–6 Studies using ante-mortem CSF samples from subjects followed longitudinally to autopsy showed that CSF Aβ42 is sensitive for AD,7,8 CSF t-Tau is specific for AD, and the ratio of CSF t-Tau to Aβ42 (t-Tau/Aβ42) appears to strike a balance between sensitivity and specificity. Despite ongoing international standardization efforts,9,10 variability in measured biomarker levels persists even after accounting for reagent-related factors. It remains also unclear why subtle interoperator differences can result in significant measurement imprecision. During a two-site standardization process, we discovered that CSF Aβ42 measured using the Alzheimer's Disease Neuro-imaging Initiative (ADNI) protocol captures only a fraction of the total measurable CSF Aβ42, and this apparent Aβ42 is further influenced by technical factors and other CSF proteins implicated in AD.11–13 We then identified values equivalent to published ADNI thresholds for diagnosis based on processing techniques, and experimentally determined how Ab-binding proteins directly influenced the relative measured Aβ42 levels.
Methods
Participants
Consecutive patients and control subjects were recruited and longitudinally followed in the Emory Cognitive Neurology Clinic or the Emory Alzheimer's Disease Research Center (ADRC). The study was approved by the Emory University Institutional Review Board, and informed consent was obtained from all patients or their authorized representatives. Participants (n = 140) included community-dwelling healthy volunteers with normal cognition and cognitively impaired patients evaluated at subspecialty clinics dedicated to the evaluation of neurodegenerative disorders including mild cognitive impairment (MCI),14 AD,15,16 frontotemporal dementia (FTD),17 dementia with Lewy bodies (DLB),18 as well as potentially reversible causes such as normal pressure hydrocephalus (Data S1). All subjects underwent standardized neuropsychological analysis, and memory and executive functions were analyzed using Z-scores. A memory Z-score was derived by averaging the Z-scores of Consortium to Establish a Registry for Alzheimer's Disease (CERAD) word list learning and delayed word list recall.19,20 An executive Z-score was derived by averaging the Z-scores of Trail Making Part B, letter-guided fluency, and reverse digit span. APOE genotyping was performed on all but four participants in this study.
Procedures
Samples were collected from subjects according to strict protocols. At collection, participants were ≥21 years of age and in good general health, having no other psychiatric or major medical diagnoses that could contribute significantly to cognitive impairment or dementia other than the primary neurodegenerative disorder. CSF samples were collected between 8 am and 2 pm without overnight fasting and immediately aliquoted before freezing, although otherwise we used the ADNI biofluid protocols.
Four different protocols were evaluated at baseline for CSF AD biomarker measurements, including three protocols using never-thawed samples and one protocol using never-frozen samples (Fig.1A):
ADNI: Aliquots were allowed to thaw at room temperature for 30 min before each sample was vortexed for 15 sec until all samples in a given analytical run were vortexed. Immediately before loading into a 96-well plate, each aliquot was re-vortexed for 2 sec.
Vortex: Processed the same way as ADNI samples, except each aliquot was vortexed vigorously for 15 sec immediately before loading into 96-well plates.
Centrifuge: Based on the difference in measured AD biomarkers between the ADNI and Vortex protocols (Fig.1A), we hypothesized that some AD-related peptides become undetectable through the ADNI protocol by settlement or aggregation, and this process can be reproduced by centrifuging CSF samples. Following thawing (30 min) and vortexing (15 sec), CSF samples were centrifuged (21,130 × g for 15 min) in a tabletop centrifuge. The top 200 μL of CSF was saved for AD biomarker analysis. Immediately before loading onto 96-well plates, each aliquot was vigorously re-vortexed (15 sec).
Warm: To determine whether the difference in AD biomarker levels between the ADNI and Vortex protocols can result from ex vivo freezing of CSF, never-frozen CSF aliquots were transferred into a 37°C water bath immediately after lumbar puncture and centrifuged as above. The top 200 μL of CSF was saved for AD biomarker analysis, and each sample was vortexed vigorously (15 sec) prior to assay plate loading.
Figure 1.

Measured CSF Aβ42 levels are influenced by preanalytical processing and disease status. (A) Four distinct preanalytical protocols lead to different measured Aβ42 levels. All values are represented as percent of biomarker levels measured per total protocol (±standard deviation) to account for interindividual differences in biomarker levels. “ADNI” is the standard protocol involving no centrifugation and limited vortexing immediately prior to plate loading. “Vortex” represents total measurable CSF Aβ42 with vigorous vortexing for 15 sec prior to assay plate loading. “Centrifuge” represents the fraction of CSF Aβ42 detectable after “Total” samples were centrifuged for 15 min and the top 200 μL was analyzed. “Warm” represents a variation of the centrifuge protocol, except CSF aliquots are kept at 37°C immediately after lumbar puncture and processed for biomarker analysis within 2 h after lumbar puncture. *P < 0.001 compared to Total Aβ42 levels by Mann–Whitney U-test. (B) Comparison of AD biomarker levels (derived from ADNI/centrifuge protocols) as percentages of total levels according to diagnosis (NC, normal cognition; MCI, mild cognitive impairment; AD, Alzheimer's disease; OD, other non-AD dementia). Boxplots show minimum, first quartile, median, third quartile, and maximum values as well as outliers (small circles). **P < 0.019 by Mann–Whitney U-test. CSF, cerebrospinal fluid; ADNI, Alzheimer's disease neuro-imaging Initiative.
CSF levels of AD biomarkers (Aβ42, total tau, and p-tau181) were measured using the multiplex xMAP Luminex platform (Luminex Corp, Austin, TX) with AlzBio3 kits (Innogenetics, Ghent, Belgium). To characterize the differences between the four protocols, CSF from 15 subjects (three aliquots per subject) were immediately frozen and kept at −80°C until further analysis. All three aliquots were analyzed in duplicates after processing (ADNI, vortex, and centrifuge) on consecutive assay plates using the same kit lot. Samples from the same subject, regardless of manipulation, were analyzed next to each other to minimize intra- or interplate variability. For the “Warm” protocol, one CSF aliquot from each subject was kept at 37°C immediately after collection without freezing, and analyzed that afternoon in conjunction with an adjacent aliquot that was frozen earlier that morning and processed according to the vortex protocol. Thus, each subject in the “Warm” protocol was tested in a separate assay plate using the same kit lot, and a percentage was calculated based on the vortex and warm results from that day.
Because ADNI and Centrifuge protocols gave rise to similar AD biomarker levels, we collectively referred to the measured Aβ42 via ADNI and centrifuge protocols as suspended Aβ42 (susAβ). For the larger cohort (n = 140), CSF biomarkers from vortex and centrifuge protocols within the same subject were analyzed in duplicates on the same plate in adjacent wells, with different plates using reagents from the same kit lot.
Replication of distinct CSF Aβ42 pools
Duplicate aliquots of CSF from 20 Emory subjects were sent to University of Pennsylvania on dry ice overnight, and CSF was processed according to Emory protocol to derive suspended and total measurable CSF Aβ42 levels. CSF % susAβ (calculated by dividing susAβ by total measurable Aβ42) was independently determined and then compared with values from Emory. To replicate level differences between susAβ and total measurable Aβ42, CSF samples were further analyzed by western blotting using a modified bicine/bistris/tris/sulphate sodium dodecyl sulfate polyacrylamide gel electrophoresis (SDS-PAGE) protocol (Data S1).21
Other CSF proteins that influence % susAβ
Aβ42 is known to interact with other proteins including apoJ,22 apolipoprotein E (apoE),23,24 and α-synuclein.25–27 To determine whether susAβ levels are influenced by these interacting proteins, we measured their levels in 69 subjects chosen from the larger cohort (Data S1). These subjects were randomly selected and were similar to the unselected subjects in terms of age, gender, disease duration, and CSF AD biomarker levels (data not shown). Levels of Aβ-interacting proteins as well as total CSF AD biomarkers were entered into a multivariate linear regression model to determine the strongest factors predicting susAβ levels and % susAβ.
Furthermore, we analyzed whether increasing levels of Aβ42-interacting proteins would alter % susAβ. Because we found apoJ to strongly correlate with % susAβ, we first determined the time-dependent effect of increasing apoJ levels. Five CSF aliquots were selected from each of five patients with low baseline % susAβ (median 34%, range 32–49%), and the time-dependent effect of apoJ on % susAβ was determined (Data S1). We additionally tested the effects of increasing apoJ, apoE (Millipore, Billerica, MA; apoE includes a combination of isoforms), albumin (Jackson ImmunoResearch Laboratories, West Grove, PA), and α-synuclein (rPeptide, Bogart, GA) on % susAβ after 4 hr of incubation at 37°C in 12 subjects (mean % susAβ of 58.9%, SD 20.8%). Each protein was increased by its level difference between the top and bottom quartiles of % susAβ. Treatment-dependent % susAβ was calculated for each time point, and then normalized to the baseline buffer-treated % susAβ.
Statistical analysis
Statistical analysis was performed in IBM-SPSS 20 (Chicago, IL). For baseline comparison, chi-squared test was used to analyze categorical variables, and analysis of variance (ANOVA) was used to compare continuous variables. ANOVA was used to determine whether subjects from the four diagnostic groups differed in % susAβ, and Pearson correlational analysis was used to determine the association between % susAβ and memory and executive dysfunctions (Z-scores). Linear regression model was then used to analyze the relationship between susAβ levels (or % susAβ) and other factors (including age, gender, presence of APOE4 allele, total measurable Aβ42 levels, t-Tau, p-Tau181, apoE, and apoJ). Mixed linear analysis was used to determine the effect of apoJ addition to the time-dependent % susAβ over 72 h. Because % susAβ reaches an asymptote, time (h) was log transformed for the purpose of calculating the slope before used as a fixed variable as well as a random variable to determine the effect of apoJ addition.
Results
CSF susAβ represents half of total measurable CSF Aβ42
We first measured CSF AD biomarker levels in three CSF aliquots from the same CSF draw that were processed according to the ADNI, vortex, and centrifuge protocols. Total measurable CSF Aβ42 levels were significantly higher than those measured using the ADNI protocol (Fig.1A), which led us to test manipulations which can potentially replicate (centrifuge) this difference. In keeping with our hypothesis, Aβ42 levels were indistinguishable between the ADNI and centrifuge protocols. Because ADNI samples were never centrifuged, we considered the CSF Aβ42 levels from these two protocol to reflect the pool of Aβ42 that remains suspended (susAβ) in solution after table-top incubation (at room temperature) or centrifugation (Fig.2). Using the entire cohort of subjects (n = 140, Table1), susAβ levels, on average, represented 57.0% of total Aβ42 levels (SD = 16.6%, P < 0.001), and correlated moderately with total measurable Aβ42 levels (R = 0.818, P < 0.001, Fig.3). Subjects with clinical AD had lower % susAβ than subjects with normal cognition, MCI, or non-AD dementia (P < 0.017 by Mann–Whitney U-test, Fig.1B). This association persisted (F = 9.235, P = 0.003) even when adjusting for age, gender, and total Aβ42. When subjects with normal cognition, MCI, and AD were analyzed, % susAβ is inversely correlated with memory Z-scores (P = 0.002) and executive Z-scores (P = 0.005). Subtracting susAβ level from total measurable Aβ42 level generated a value that did not differ across categories. Paired T-tests also showed suspended t-Tau and p-Tau181 levels to be lower than total measurable t-Tau and p-Tau181 levels (P < 0.001 for both), but the difference in levels (15.3 ± 16.5% for t-Tau, 12.4 ± 20.9% for p-Tau181) is much smaller than that seen for Aβ42 and there was no difference across clinical categories. Thus, we hereafter focused on susAβ and factors which influence this measure.
Figure 2.
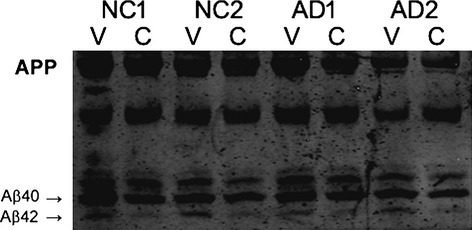
Western blot showing cerebrospinal fluid (CSF) Aβ42 peptides generated through vortex (V) and centrifuge (C) protocols. Parallel CSF samples from two subjects with Alzheimer's disease (AD) and two subjects with normal cognition (NC) were treated by each protocol and then analyzed on urea-containing SDS gel to separate Aβ40 and Aβ42. Each CSF sample from the vortex protocol had higher Aβ42 levels than the corresponding sample from the centrifuge protocol.
Table 1.
Baseline demographic and biomarker features of the Emory cohort
| Normal cognition (n = 30) | MCI (n = 36) | AD (n = 36) | Other dementia (FTD, LBD, NPH; n = 38) | P | |
|---|---|---|---|---|---|
| Age at CSF, year (SD) | 66.9 (20.2) | 67.6 (8.1) | 64.7 (8.8) | 66.7 (7.8) | 0.760 |
| Male gender (%) | 12 (40%) | 25 (69%) | 16 (44%) | 25 (66%) | 0.027 |
| Disease duration, year (SD) | NA | 2.6 (2.1) | 3.7 (1.9) | 3.5 (2.4) | 0.063 |
| Presence of APOE ε4 allele (%) | 12 (40%) | 20 (55%) | 20 (56%) | 13 (34%) | 0.124 |
| CSF biomarkers | |||||
| Total measurable Aβ42 | 325.5 (89.2) | 254.3 (114.9) | 207.6 (77.4) | 286.4 (96.5) | <0.001** |
| Suspended Aβ42 | 197.1 (86.5) | 156.2 (92.1) | 105.6 (44.4) | 177.8 (86.2) | <0.001** |
| Total t-Tau | 54.2 (24.9) | 83.6 (44.1) | 120.0 (72.1) | 71.1 (37.6) | <0.001* |
| Suspended t-Tau | 45.7 (27.2) | 72.3 (38.9) | 102.8 (65.8) | 63.5 (32.6) | <0.001** |
| Total p-Tau181 | 28.8 (16.2) | 42.4 (20.5) | 62.9 (39.3) | 27.2 (13.5) | <0.001* |
| Suspended p-Tau181 | 25.5 (15.4) | 38.7 (19.3) | 55.3 (37.6) | 26.9 (12.7) | <0.001* |
| Biomarker ratio | |||||
| t-Tau/total measurable Aβ42 | 0.180 (0.096) | 0.412 (0.365) | 0.628 (0.359) | 0.288 (0.220) | <0.001** |
| t-Tau/susAβ | 0.250 (0.145) | 0.641 (0.516) | 1.066 (0.593) | 0.462 (0.369) | <0.001* |
| # with multi-analyte profiling (%) | 14 (47%) | 20 (56%) | 20 (56%) | 15 (39%) | 0.123 |
P values shown are from ANOVA at the group level: *Subjects with AD and MCI differ from subjects with normal cognition or other dementia by ANOVA and post-hoc analysis; **Subjects with AD differ from non-AD subjects by ANOVA and post-hoc analysis (AD, Alzheimer's disease; MCI, mild cognitive impairment; FTD, frontotemporal dementia; LBD, Lewy body disease; NPH, normal pressure hydrocephalus). SusAβ levels were different from total measurable Aβ42 when cases were analyzed according to diagnostic categories (P = 0.004 for normal cognition, P = 0.004 for MCI, P < 0.001 for AD, P = 0.002 for other dementia).
Figure 3.
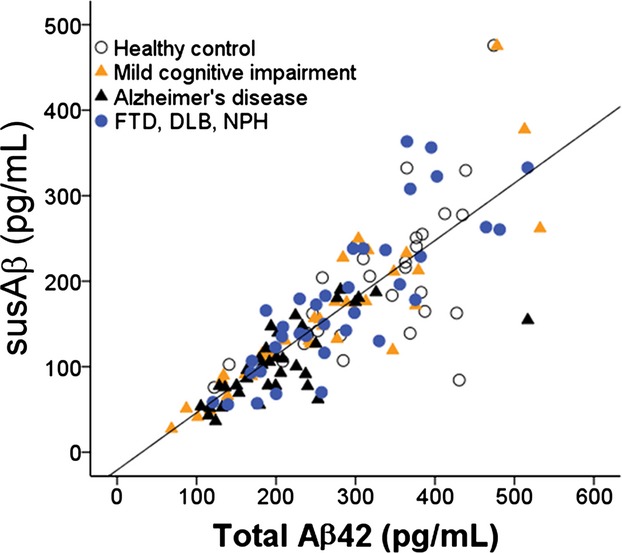
Correlation between CSF total Aβ42 and susAβ (n = 140). Open circles: subjects with normal cognition; yellow triangle: MCI; black triangle: AD; blue circles: non-AD dementia. CSF, cerebrospinal fluid; MCI, mild cognitive impairment; AD, Alzheimer's disease.
Reproducibility of suspended and total CSF AD biomarkers
To replicate our findings, never-thawed CSF aliquots from the same CSF draw obtained from 20 subjects (see Methods) were shipped to Penn for AD biomarker analysis. Suspended and total measurable CSF Aβ42 values levels correlated strongly between Emory and Penn (R = 0.846 and 0.774), as well as % susAβ (R = 0.841).
SusAβ versus total Aβ42 in the calculation of t-Tau/Aβ42 ratio
As susAβ levels represent approximately half of total Aβ42 levels, the choice of using susAβ or total measurable Aβ42 level in AD diagnosis can significantly impact the performance of universal cut-off values. We thus examined the corresponding values using total measurable Aβ42 and t-Tau/Aβ42 based on previously published values using the ADNI protocol.28 Notably, the susAβ of 192 pg/mL corresponds to total Aβ42 of 310 pg/mL, with subjects having concordant Aβ42 status (normal vs. decreased) in 121/140 cases (86.4%). On the other hand, t-Tau/susAβ ratio of 0.39 corresponds to total t-Tau/Aβ42 ratio of 0.28, with a high concordance rate between the two ratio markers (136/140 cases, or 97.1%).
Effect of a single freeze–thaw cycle on CSF % susAβ
Most biomarker protocols involve immediate freezing at −80°C until further analysis. As protein solubility can be influenced by temperature, we first tested if freeze–thawing would alter % susAβ. Compared to % susAβ values after a single freeze–thaw cycle, keeping the CSF samples at 37°C for up to 2 h between lumbar puncture and analysis resulted in much higher % susAβ (mean 82.7%, SD 14.5%, P = 0.028 by Mann–Whitney U-test, Fig.1A). As care is taken such that CSF samples are not exposed to CO2, the standard freezing step involved in long-term storage is likely sufficient to reduce CSF % susAβ.
Relationship between susAβ and other CSF protein levels
Other than temperature, % susAβ can be influenced by proteins which bind the relatively hydrophobic peptide. To determine which candidate CSF proteins influence % susAβ, we first determined whether susAβ levels were influenced by levels of other proteins implicated in AD (apoE, apoJ, α-synuclein, and total protein) in a smaller cohort (n = 69). The four diagnostic groups did not differ in levels of apoE (P = 0.919), apoJ (P = 0.724), α-synuclein (P = 0.629), and total protein (P = 0.833). Linear multivariate regression analysis showed that while total measurable CSF Aβ42 levels were only correlated with MCI or AD diagnosis, susAβ levels were also influenced by levels of apoJ and t-Tau (Table2). Similarly, % susAβ was most associated with apoJ (F = 26.5, P < 0.001) and t-Tau (F = 16.0, P < 0.001) levels, even when age, gender, diagnosis, disease duration, and CSF biomarker (Aβ42, p-Tau181, apoE, α-synuclein, and total protein) levels were entered into the model.
Table 2.
Biological factors which influence CSF susAβ levels
| Factors | B (95% confidence interval) | P |
|---|---|---|
| Total Aβ42 (pg/mL) | 0.625 (0.546, 0.705) | <0.001 |
| apoJ (pg/mL) | 1.34 × 10⁻⁶ (0.82 × 10⁻⁶, 1.86 × 10⁻⁶) | <0.001 |
| t-Tau (pg/mL) | −0.155 (−0.306, −0.005) | 0.043 |
| Constant | −76.55 (−10931, −43.79) | <0.001 |
In this model, CSF susAβ levels were entered as the dependent variable, while age, gender, disease duration, presence of APOE4 allele, and biomarker levels (including total Aβ42, total t-Tau, total p-Tau181, apoE, apoJ, albumin, and α-synuclein) were entered in a stepwise fashion. The final model had a R2 of 0.841 in predicting CSF susAβ levels. CSF, cerebrospinal fluid.
We next determined if increased apoJ levels accelerated the return of in vitro susAβ to in vivo levels, or increased the overall % susAβ42. We selected subjects with low baseline % susAβ (median 34%, range 32–49%) to avoid the ceiling effect. Incubating CSF samples at 37°C after freeze–thawing gradually increased % susAβ over 72 h. When purified apoJ was added at baseline, % susAβ increased asymptotically over the same period, but to a higher final level (Fig.4A). Addition of purified apoE and albumin also increased the CSF % susAβ after 4 h (P = 0.029, and P < 0.001, Fig.4B), but addition of purified α-synuclein did not.
Figure 4.
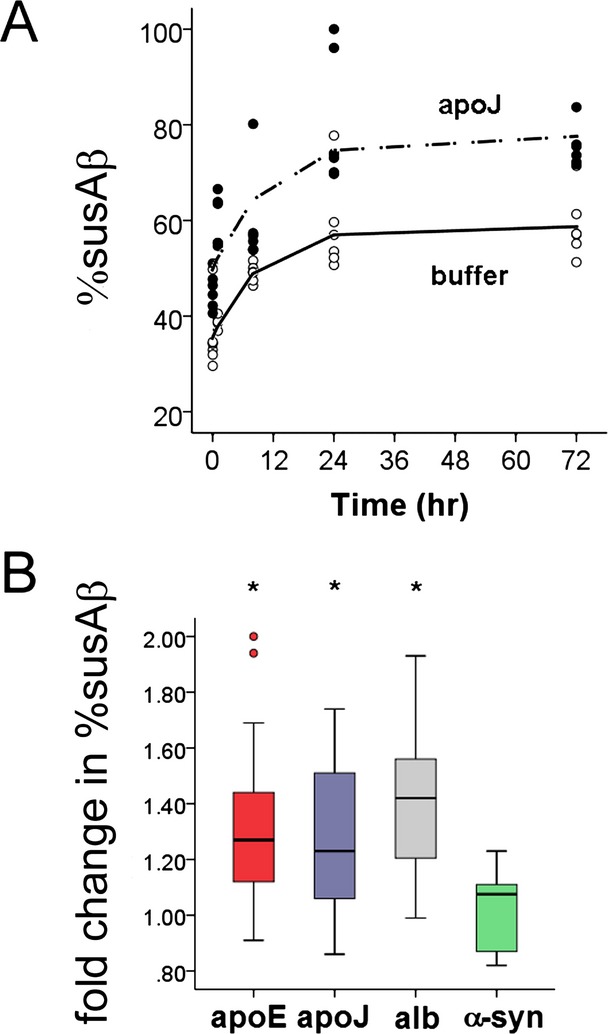
Factors which influence the cerebrospinal fluid (CSF) % susAβ. (A) Incubation of CSF at 37°C gradually increases the in vitro CSF % susAβ until it reaches a plateau at 24–72 h, and incubation of CSF at 37°C with additional apoJ increases the asymptotic plateau in a parallel time-dependent fashion. Mixed linear analysis showed that apoJ addition increased the plateau of % susAβ (P = 0.003) but did not alter the rate by which % susAβ ratio reached the plateau (P = 0.426). (B) Fold changes from baseline % susAβ after addition of Aβ42-interacting proteins. Exogenous apoE, apoJ, and albumin (alb), but not α-synuclein (α-syn), increases the in vitro CSF % susAβ after 4 h of incubation at 37°C. ApoJ levels were increased from 46.6–62.6 μg/mL, apoE levels were increased from 3.12–13.5 μg/mL, total protein levels were increased from 401–1207 μg/mL by addition of albumin, and α-synuclein levels were increased from 0.65 to 1.05 ng/mL. *P < 0.03 compared to buffer-treated samples.
Discussion
CSF biomarkers related to fundamental AD pathology hold great promise in the early and accurate prediction of underlying AD neuropathology, and there is ongoing effort to standardize operating procedures between laboratories to establish universally applicable models of AD diagnosis.10 Here, we report critical in vivo and ex vivo factors associated with a 1.5- to 2-fold difference in measured Aβ42 levels. We observe in a large cohort that the difference between total measurable and susAβ is most strongly associated with CSF apoJ and t-Tau levels, and % susAβ can be manipulated by increasing levels of apoJ and apoE. As CSF % susAβ is influenced by AD-related and AD-unrelated factors, we propose that apparent susAβ is a much more complex measure than total measurable CSF Aβ42 and does not directly represent the total Aβ42 abundance.
Reproducible measurements of CSF AD biomarkers, especially Aβ42, have been a major challenge in their translation to clinical use.10 As we report here, seemingly minute differences in standard operating procedures can result in large differences in the measured biomarker levels. Since CSF AD biomarkers are already susceptible to preanalytical factors such as diurnal variation29 and collection tube material,30 it was not surprising that preanalytical protocol variations following lumbar puncture can result in approximately twofold difference in Aβ42 levels. The biggest alterations in Aβ42 levels may have come from the standard freeze–thawing cycle universally applied to biomarker studies. Because clinical trials targeting Aβ clearance or production measure susAβ levels31,32 to determine whether there is global Aβ reduction and have unknown effects on Aβ-binding proteins, we propose that total measurable Aβ42 levels better reflect total Aβ42 “load” than susAβ.
SusAβ levels were previously associated with cerebral amyloid deposition, hippocampal atrophy, and longitudinal cognitive decline, and the strong correlation between suspended and total Aβ42 suggests that total Aβ42 would have the same predictive power. At the same time, the reduction in CSF Aβ42 level is further accentuated by AD diagnosis and increased CSF t-Tau levels, which may make CSF susAβ42 a more clinically useful diagnostic marker despite its “non-physiologic” nature. Because % susAβ is associated with increasing levels of Aβ-binding proteins, susAβ may represent the pool of protein-bound peptides available for lipoprotein-mediated clearance. The association between increasing apoE, apoJ, and albumin levels with higher % susAβ at 37°C is in keeping with the observation of higher susAβ without freeze–thawing than with freezing, and suggests that Aβ42 may lose its physiologic interaction with its binding proteins after freezing and may be more prone to aggregation.33 With the duration of vortex representing the major difference between ADNI and Vortex protocols, this binding likely is promoted by prolonged vigorous vortexing. Vigorous vortexing prior to plate loading likely promotes this protein–protein interaction, and the interaction is likely saturable as nonphysiologic levels of apoE and apoJ could not bring % susAβ to 100%. If apoE-directed therapy34,35 is used in AD with or without Aβ-directed therapies, the most robust biomarker profile would then consist of susAβ, total measurable Ab, as well as t-Tau, apoE, and apoJ rather than any single biomarkers alone.
This study has a number of limitations. Very few of the 140 subjects had autopsy confirmation or amyloid imaging, which makes it challenging for us to derive autopsy-correlated biomarker cut-off values beyond those which correspond to previously reported values.28 We did not determine the influence of exact timing of day on % susAβ. We only measured a subset of abundant Aβ42 interacting proteins, and other CSF proteins may alter % susAβ ratios in parallel to or in conjunction with apoJ and apoE. We did not provide direct evidence that exogenous apoE or apoJ directly bound to CSF Aβ42 to enhance its solubility, even though apolipoproteins are known to interact with Aβ and may prevent its aggregation22,33,36,37 We also did not use gamma-secretase inhibitors to account for de novo production of Aβ42 peptides, but gamma-secretase activity has not been reported in CSF and presenilin 1 and 2 fragments detected in CSF are felt to represent nonspecific aggregation rather than gamma-secretase complexes.38 We propose that alterations in CSF % susAβ are due to technical and biological factors, and susAβ42 levels, t-Tau/susAβ42 ratio, as well as their impact on other biological correlates of AD should be interpreted with care because these in vitro measures reflect amyloid protein's total abundance as well as its dynamic interactions with other AD-associated proteins and AD itself.
Acknowledgments
This study has been supported by the Viretta Brady Discovery Fund, Emory University Center for Neurodegenerative Diseases, and AG 016976 at Emory University, and by the ADNI grant R01 AG10124. The study sponsors have no role in the study design; collection, analysis, and interpretation of data; writing the report; and the decision to submit the report for publication.
Conflict of Interest
L. M. S. is a consultant to Innogenetics. Dr. Hu has a patent DIAGNOSTIC TESTING IN DEMENTIA AND METHODS RELATED THERETO issued, and a patent null pending. Dr. Shaw reports non-financial support from FNIH Alzheimer's Biomarker Team, personal fees from Innogenetics, outside the submitted work; In addition, Dr. Shaw has a patent CSF Alzheimer's Biomarkers pending, and a patent Amyloid diagnostic imaging with royalties paid to Amyvid. Dr. Trojanowski reports non-financial support from FNIH Alzheimer's Biomarker Team, outside the submitted work. Dr. Trojanowski has a patent CSF Alzheimer's Biomarkers pending, and a patent Amyloid diagnostic imaging with royalties paid to Avid.
Supporting Information
Data S1. Supplementary material.
References
- Sperling RA, Aisen PS, Beckett LA, et al. Toward defining the preclinical stages of Alzheimer's disease: recommen-dations from the National Institute on Aging-Alzheimer's Association workgroups on diagnostic guidelines for Alzheimer's disease. Alzheimers Dement. 2011;7:280–292. doi: 10.1016/j.jalz.2011.03.003. [DOI] [PMC free article] [PubMed] [Google Scholar]
- Albert MS, DeKosky ST, Dickson D, et al. The diagnosis of mild cognitive impairment due to Alzheimer's disease: recommendations from the National Institute on Aging and Alzheimer's Association Workgroup. Alzheimers Dement. 2011;7:270–279. doi: 10.1016/j.jalz.2011.03.008. [DOI] [PMC free article] [PubMed] [Google Scholar]
- McKhann GM, Knopman DS, Chertkow H, et al. The diagnosis of dementia due to Alzheimer's disease: recommendations from the National Institute on Aging-Alzheimer's Association workgroups on diagnostic guidelines for Alzheimer's disease. Alzheimers Dement. 2011;7:263–269. doi: 10.1016/j.jalz.2011.03.005. [DOI] [PMC free article] [PubMed] [Google Scholar]
- Vemuri P, Whitwell JL, Kantarci K, et al. Antemortem MRI based STructural Abnormality iNDex (STAND)-scores correlate with postmortem Braak neurofibrillary tangle stage. Neuroimage. 2008;42:559–567. doi: 10.1016/j.neuroimage.2008.05.012. [DOI] [PMC free article] [PubMed] [Google Scholar]
- Vanderstichele H, De Meyer G, Andreasen N, et al. Amino-truncated beta-amyloid42 peptides in cerebrospinal fluid and prediction of progression of mild cognitive impairment. Clin Chem. 2005;51:1650–1660. doi: 10.1373/clinchem.2005.051201. [DOI] [PubMed] [Google Scholar]
- Shaw LM, Vanderstichele H, Knapik-Czajka M, et al. Qualification of the analytical and clinical performance of CSF biomarker analyses in ADNI. Acta Neuropathol. 2011;121:597–609. doi: 10.1007/s00401-011-0808-0. [DOI] [PMC free article] [PubMed] [Google Scholar]
- Peskind ER, Li G, Shofer J, et al. Age and apolipoprotein E*4 allele effects on cerebrospinal fluid beta-amyloid 42 in adults with normal cognition. Arch Neurol. 2006;63:936–939. doi: 10.1001/archneur.63.7.936. [DOI] [PubMed] [Google Scholar]
- Vos SJ, Xiong C, Visser PJ, et al. Preclinical Alzheimer's disease and its outcome: a longitudinal cohort study. Lancet Neurol. 2013;12:957–965. doi: 10.1016/S1474-4422(13)70194-7. [DOI] [PMC free article] [PubMed] [Google Scholar]
- Mattsson N, Andreasson U, Carrillo MC, et al. Proficiency testing programs for Alzheimer's disease cerebrospinal fluid biomarkers. Biomark Med. 2012;6:401–407. doi: 10.2217/bmm.12.41. [DOI] [PubMed] [Google Scholar]
- Mattsson N, Andreasson U, Persson S, et al. CSF biomarker variability in the Alzheimer's association quality control program. Alzheimers Dement. 2013;9:251–261. doi: 10.1016/j.jalz.2013.01.010. [DOI] [PMC free article] [PubMed] [Google Scholar]
- Braak H, Braak E. Neuropathological stageing of Alzheimer-related changes. Acta Neuropathol. 1991;82:239–259. doi: 10.1007/BF00308809. [DOI] [PubMed] [Google Scholar]
- Matsubara E, Soto C, Governale S, et al. Apolipoprotein J and Alzheimer's amyloid beta solubility. Biochem J. 1996;316(Pt 2):671–679. doi: 10.1042/bj3160671. [DOI] [PMC free article] [PubMed] [Google Scholar]
- Holtzman DM. In vivo effects of ApoE and clusterin on amyloid-beta metabolism and neuropathology. J Mol Neurosci. 2004;23:247–254. doi: 10.1385/JMN:23:3:247. [DOI] [PubMed] [Google Scholar]
- Petersen RC, Smith GE, Waring SC, et al. Mild cognitive impairment: clinical characterization and outcome. Arch Neurol. 1999;56:303–308. doi: 10.1001/archneur.56.3.303. [DOI] [PubMed] [Google Scholar]
- McKhann G, Drachman D, Folstein M, et al. Clinical diagnosis of Alzheimer's disease: report of the NINCDS-ADRDA Work Group under the auspices of Department of Health and Human Services Task Force on Alzheimer's Disease. Neurology. 1984;34:939–944. doi: 10.1212/wnl.34.7.939. [DOI] [PubMed] [Google Scholar]
- Dubois B, Feldman HH, Jacova C, et al. Research criteria for the diagnosis of Alzheimer's disease: revising the NINCDS-ADRDA criteria. Lancet Neurol. 2007;6:734–746. doi: 10.1016/S1474-4422(07)70178-3. [DOI] [PubMed] [Google Scholar]
- McKhann GM, Albert MS, Grossman M, et al. Clinical and pathological diagnosis of frontotemporal dementia: report of the Work Group on Frontotemporal Dementia and Pick's Disease. Arch Neurol. 2001;58:1803–1809. doi: 10.1001/archneur.58.11.1803. [DOI] [PubMed] [Google Scholar]
- McKeith IG, Dickson DW, Lowe J, et al. Diagnosis and management of dementia with Lewy bodies: third report of the DLB Consortium. Neurology. 2005;65:1863–1872. doi: 10.1212/01.wnl.0000187889.17253.b1. [DOI] [PubMed] [Google Scholar]
- Morris JC, Heyman A, Mohs RC, et al. The Consortium to Establish a Registry for Alzheimer's Disease (CERAD). Part I. Clinical and neuropsychological assessment of Alzheimer's disease. Neurology. 1989;39:1159–1165. doi: 10.1212/wnl.39.9.1159. [DOI] [PubMed] [Google Scholar]
- Randolph C, Tierney MC, Mohr E, Chase TN. The Repeatable Battery for the Assessment of Neuropsychological Status (RBANS): preliminary clinical validity. J Clin Exp Neuropsychol. 1998;20:310–319. doi: 10.1076/jcen.20.3.310.823. [DOI] [PubMed] [Google Scholar]
- Wiltfang J, Esselmann H, Bibl M, et al. Highly conserved and disease-specific patterns of carboxyterminally truncated Abeta peptides 1-37/38/39 in addition to 1-40/42 in Alzheimer's disease and in patients with chronic neuroinflammation. J Neurochem. 2002;81:481–496. doi: 10.1046/j.1471-4159.2002.00818.x. [DOI] [PubMed] [Google Scholar]
- Matsubara E, Frangione B, Ghiso J. Characterization of apolipoprotein J-Alzheimer's A beta interaction. J Biol Chem. 1995;270:7563–7567. doi: 10.1074/jbc.270.13.7563. [DOI] [PubMed] [Google Scholar]
- Kuszczyk MA, Sanchez S, Pankiewicz J, et al. Blocking the interaction between apolipoprotein E and Abeta reduces intraneuronal accumulation of Abeta and inhibits synaptic degeneration. Am J Pathol. 2013;182:1750–1768. doi: 10.1016/j.ajpath.2013.01.034. [DOI] [PMC free article] [PubMed] [Google Scholar]
- Zerbinatti CV, Wahrle SE, Kim H, et al. Apolipoprotein E and low density lipoprotein receptor-related protein facilitate intraneuronal Abeta42 accumulation in amyloid model mice. J Biol Chem. 2006;281:36180–36186. doi: 10.1074/jbc.M604436200. [DOI] [PubMed] [Google Scholar]
- Tsigelny IF, Crews L, Desplats P, et al. Mechanisms of hybrid oligomer formation in the pathogenesis of combined Alzheimer's and Parkinson's diseases. PLoS One. 2008;3:e3135. doi: 10.1371/journal.pone.0003135. [DOI] [PMC free article] [PubMed] [Google Scholar] [Retracted]
- Pletnikova O, West N, Lee MK, et al. Abeta deposition is associated with enhanced cortical alpha-synuclein lesions in Lewy body diseases. Neurobiol Aging. 2005;26:1183–1192. doi: 10.1016/j.neurobiolaging.2004.10.006. [DOI] [PubMed] [Google Scholar]
- Masliah E, Rockenstein E, Veinbergs I, et al. beta-Amyloid peptides enhance alpha-synuclein accumulation and neuronal deficits in a transgenic mouse model linking Alzheimer's disease and Parkinson's disease. Proc Natl Acad Sci USA. 2001;98:12245–12250. doi: 10.1073/pnas.211412398. [DOI] [PMC free article] [PubMed] [Google Scholar]
- Shaw LM, Vanderstichele H, Knapik-Czajka M, et al. Cerebrospinal fluid biomarker signature in Alzheimer's disease neuroimaging initiative subjects. Ann Neurol. 2009;65:403–413. doi: 10.1002/ana.21610. [DOI] [PMC free article] [PubMed] [Google Scholar]
- Bateman RJ, Wen G, Morris JC, Holtzman DM. Fluctuations of CSF amyloid-beta levels: implications for a diagnostic and therapeutic biomarker. Neurology. 2007;68:666–669. doi: 10.1212/01.wnl.0000256043.50901.e3. [DOI] [PubMed] [Google Scholar]
- Bjerke M, Portelius E, Minthon L, et al. Confounding factors influencing amyloid Beta concentration in cerebrospinal fluid. Int J Alzheimers Dis. 2010 doi: 10.4061/2010/986310. ; doi: 10.4061/2010/986310. [DOI] [PMC free article] [PubMed] [Google Scholar]
- Blennow K, Zetterberg H, Rinne JO, et al. Effect of immunotherapy with bapineuzumab on cerebrospinal fluid biomarker levels in patients with mild to moderate Alzheimer disease. Arch Neurol. 2012;69:1002–1010. doi: 10.1001/archneurol.2012.90. [DOI] [PubMed] [Google Scholar]
- Farlow M, Arnold SE, van Dyck CH, et al. Safety and biomarker effects of solanezumab in patients with Alzheimer's disease. Alzheimers Dement. 2012;8:261–271. doi: 10.1016/j.jalz.2011.09.224. [DOI] [PubMed] [Google Scholar]
- Garai K, Verghese PB, Baban B, et al. The binding of apoE to oligomers and fibrils of amyloid-beta alters the kinetics of amyloid aggregation. Biochemistry. 2014;53:6323–6331. doi: 10.1021/bi5008172. [DOI] [PMC free article] [PubMed] [Google Scholar]
- Cramer PE, Cirrito JR, Wesson DW, et al. ApoE-directed therapeutics rapidly clear beta-amyloid and reverse deficits in AD mouse models. Science. 2012;335:1503–1506. doi: 10.1126/science.1217697. [DOI] [PMC free article] [PubMed] [Google Scholar]
- Liao F, Hori Y, Hudry E, et al. Anti-ApoE antibody given after plaque onset decreases Abeta accumulation and improves brain function in a mouse model of Abeta amyloidosis. J Neurosci. 2014;34:7281–7292. doi: 10.1523/JNEUROSCI.0646-14.2014. [DOI] [PMC free article] [PubMed] [Google Scholar]
- Ma J, Yee A, Brewer HB, Jr, et al. Amyloid-associated proteins alpha 1-antichymotrypsin and apolipoprotein E promote assembly of Alzheimer beta-protein into filaments. Nature. 1994;372:92–94. doi: 10.1038/372092a0. [DOI] [PubMed] [Google Scholar]
- Sanan DA, Weisgraber KH, Russell SJ, et al. Apolipoprotein E associates with beta amyloid peptide of Alzheimer's disease to form novel monofibrils. Isoform apoE4 associates more efficiently than apoE3. J Clin Invest. 1994;94:860–869. doi: 10.1172/JCI117407. [DOI] [PMC free article] [PubMed] [Google Scholar]
- Garcia-Ayllon MS, Campanari ML, Brinkmalm G, et al. CSF presenilin-1 complexs are increased in Alzheimer's disease. Acta Neuropathol Commun. 2013;1:46. doi: 10.1186/2051-5960-1-46. [DOI] [PMC free article] [PubMed] [Google Scholar]
Associated Data
This section collects any data citations, data availability statements, or supplementary materials included in this article.
Supplementary Materials
Data S1. Supplementary material.