

Abstract
Zinc metalloproteinases meprin α and meprin β are implicated in a variety of diseases, such as fibrosis, inflammation and neurodegeneration, however, there are no selective small molecule inhibitors that would allow to study their role in these processes. To address this lack of molecular tools we have developed high throughput screening (HTS) assays to enable discovery of inhibitors of both meprin α and meprin β and screened a collection of well characterized pharmaceutical agents (LOPAC, n = 1,280 compounds). Two compounds (PPNDS, NF449) confirmed their activity and selectivity for meprin β. Kinetic studies revealed competitive (PPNDS) and mixed competitive/non-competitive (NF449) inhibition mechanisms suggesting that binding occurs in meprin β active site. Both PPNDS and NF449 exhibited low nanomolar IC50 and Ki values making them the most potent and selective inhibitors of meprin β reported to the date. These results demonstrate the ability of meprin α and β assays to identify selective compounds and discard artifacts of primary screening.
Keywords: Meprin, zinc metalloproteinase, HTS, inhibitors, Actinonin, PPNDS, NF449, suramin
INTRODUCTION
Meprin α and meprin β belong to the astacin subfamily of metzincin superfamily of metalloproteinases 1. Their unique quaternary structure sets them apart from the rest of metzincin superfamily. Meprin α and meprin β are oligomers comprised of disulfide-linked α and β subunits that in case of meprin α can form complexes with molecular weight up to 6 million Da 2–5.
Meprins have been shown to be able to cleave a variety of biologically relevant substrates, such as cytokines and chemokines 6 and extracellular matrix proteins, 7–10 and implicated in pathophysiological processes (i.e. cancer, inflammation, Alzheimer’s disease) 11,12. However, to enable the studies of biological importance of these meprin-mediated proteolytic events, molecular tools such as selective small molecule inhibitors of meprin α and meprin β are required. Such selective inhibitors can also potentially validate meprins as feasible therapeutic targets.
Although meprin α and meprin β have several common substrates 11 and a similar cleavage specificity with a strong preference for aspartate and glutamate residues in P1′ position 11,13, subtle differences allow for the generation of specific inhibitors. Most of broad spectrum metalloproteinase inhibitors tested against meprin α and meprin β exhibit good selectivity between these two metalloproteinases. Despite the significant differences in inhibition profile between meprin α and meprin β there are no reports of molecules that would selectively inhibit meprin α or β and spare the rest of metalloproteinases. For example, actinonin, a naturally occurring hydroxamate-containing antibiotic, inhibits meprin α 100-fold more potently than meprin β (Ki = 20 nM versus 2,000 nM for meprin α and β, respectively) 7. However, it also inhibits a long list of various zinc metalloproteinases with nanomolar potencies (14 and unpublished observation in Minond laboratory). The main challenge for discovery and development of selective meprin inhibitors is to gain selectivity towards other zinc metalloenzymes such as MMPs or ADAMs. This suggests that in order to discover such selective molecules, the screening effort might be necessary.
In the present study, we have developed HTS assays to enable discovery of inhibitors of both meprin α and meprin β and screened a collection of well characterized pharmaceutical agents (LOPAC, n = 1,280 compounds). Both developed HTS assays confirmed readiness for larger scale screening effort.
MATERIALS AND METHODS
Reagents
Actinonin was from Sigma-Aldrich (cat#: A6671). PPNDS and NF449 were from Tocris Solid bottom (cat##:1309 and 1391, respectively), black 384 low volume plates were from Nunc (cat#: 264705).
Substrate synthesis
Meprin α and meprin β substrates ((MCA)-YVADAPK-(K-ε-DNP) and (MCA)-EDEDED-(K-ε-DNP), respectively) were synthesized according to FMOC solid phase methodology on a peptide synthesizer. All peptides were synthesized as C-terminal amides to prevent diketopiperazine formation 15. Cleavage and side-chain de-protection of peptide-resins was for at least 2 h using thioanisole-water-TFA (5:5:90). The substrates were purified and characterized by preparative RP HPLC, and characterized by MALDI-TOF MS and analytical RP HPLC.
Meprins expression protocol
Recombinant human meprin α and meprin β were expressed using the Bac-to-Bac expression system (Gibco Life Technologies, Paisley, UK) as described before 16,17. Media and supplements were obtained from Gibco Life Technologies. Recombinant Baculoviruses were amplified in adherently growing Spodoptera frugiperda (Sf)9 insect cells at 27°C in Grace’s insect medium supplemented with 10% fetal bovine serum, 50 units/ml penicillin and 50 μg/ml streptomycin. Protein expression was performed in 500 ml suspension cultures of BTI-TN-5B1-4 insect cells growing in Express Five SFM supplemented with 4 mM glutamine, 50 units/ml penicillin and 50 μg/ml streptomycin in Fernbach-flasks using a Multitron orbital shaker (INFORS AG, Bottmingen, Switzerland). Cells were infected at a density of 2×10⁶ cells/ml with an amplified viral stock at a MOI of ~10. Protein expression was stopped after 72 h, and recombinant meprins were further purified from the media by ammonium sulfate precipitation (60% saturation) and affinity chromatography (Streptactin for Strep-tagged meprin α and Ni-NTA for His-tagged meprin β). Meprins were activated by trypsin, which was removed afterwards by affinity chromatography using a column containing immobilized chicken ovomucoid, a trypsin inhibitor.
Enzyme Kinetics
Substrates and enzymes stock solutions were prepared at various concentrations in HTS assay buffer (50 mM Hepes, 0.01% Brij-35, pH 7.5). Assays were conducted by incubating a range of substrate concentrations (0.5–25 μM) with 10 nM meprin α and 1 nM meprin β concentrations at 25 °C. Fluorescence was measured on a multimode microplate reader Synergy H4 (Biotek Instruments, Winooski, VT) using λexcitation = 324 nm and λemission = 393 nm. Rates of hydrolysis were obtained from plots of fluorescence versus time, using data points from only the linear portion of the hydrolysis curve. The slope from these plots was divided by the fluorescence change corresponding to complete hydrolysis and then multiplied by the substrate concentration to obtain rates of hydrolysis in units of μM/s. Kinetic parameters were calculated by non-linear regression analysis using the GraphPad Prism 6.02 suite of programs.
Pilot screen of LOPAC collection
Both assays followed the same general protocol. 5 μL of 2x enzyme solution (2.6 nM and 0.15 nM for meprin α and meprin β, respectively) in assay buffer (50 mM Hepes, 0.01% Brij-35, pH 7.5) were added to solid bottom black 384 low volume plates (Greiner # 784076). Next, 75 nL of test compounds or pharmacological controls (actinonin) were added to corresponding wells using 384 pin tool device (V&P Scientific, San Diego). After 30 min incubation at RT the reactions were started by addition of 5 μL of 2x solutions of substrates (20 μM). Reactions were incubated at RT for 1 hour, after which the fluorescence was read using multimode microplate reader (Envsion, Perkin Elmer) at λexcitation = 324 nm and λemission = 393 nm. Compounds were screened at 18 μM nominal final concentration.
Three parameters were calculated on a per-plate basis: (a) the signal-to-background ratio (S/B); (b) the coefficient for variation [CV; CV = (standard deviation/mean) × 100)] for all compound test wells; and (c) the Z′-factor 18. Nominally active compounds from pilot screen were determined using Ave + 3SD rule 19.
Dose response experiments were conducted using 3-fold dilution series of inhibitor in quadruplicates. For each compound concentration, % inhibition was calculated and IC50 values were determined by fitting the data with a 4-parameter dose response – inhibition nonlinear regression equation using Graphpad Prism 6.02 software.
Inhibition Kinetics
Substrates, inhibitors, and enzymes stock solutions were prepared at various concentrations in HTS assay buffer (50 mM Hepes, 0.01% Brij-35, pH 7.5). Determinations of inhibition constants and modalities were conducted by incubating the range of substrate concentrations (0.5–25 μM) with 10 nM meprin α and 1 nM meprin β concentrations at 25 °C in the presence of varying concentrations of inhibitors. Fluorescence was measured as described above. Rates of hydrolysis were obtained from plots of fluorescence versus time, using data points from only the linear portion of the hydrolysis curve.
All kinetic parameters were calculated using GraphPad Prism version 6.02 (GraphPad Software, Inc., La Jolla, CA). Ki and Ki′ values were determined by non-linear regression (hyperbolic equation) analysis using the mixed inhibition model which allows for simultaneous determination of mechanism of inhibition. Mechanism of inhibition was determined using the “alpha” parameter derived from a mixed-model inhibition by GraphPad Prism. The mechanism of inhibition was additionally confirmed by Lineweaver-Burke plots.
RESULTS AND DISCUSSSION
Assay Development and optimization
For the development of meprin α assay (MCA)-YVADAPK-(K-ε-DNP) sequence was used, and for Meprin β (MCA)-EDEDED-(K-ε-DNP) (MCA - fluorophore (7-methoxycoumarin-4-yl)acetyl was used (Fig. 1). The sequences of both substrates were previously described by us 11,13.
Figure 1. Principle of Meprin α HTS assay.
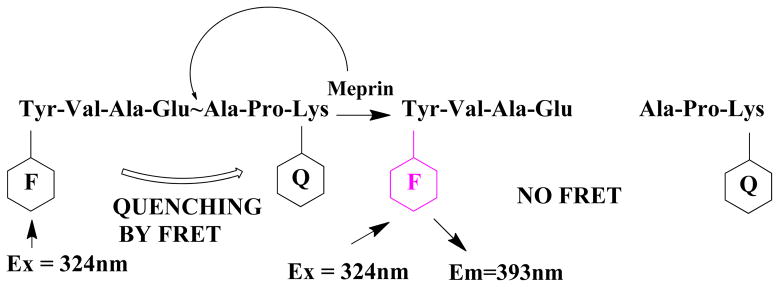
F = MCA fluorophore, Q = DNP quencher. When intact, MCA emission at 393 nm is quenched by DNP via fluorescence resonance energy transfer. Upon cleavage of the scissile bond by Meprin protease, the distance between fluorophore and quencher increases resulting in fluorescence increase.
Preliminary experiments suggested that meprin α can be used at low nanomolar concentration range (~1–5 nM), whereas meprin β exhibited significantly greater activity towards its substrate which necessitated sub-nanomolar levels of enzyme (data not shown). To determine the linear range of the reactions hydrolyzed by either enzyme, several enzyme concentrations were tested using fixed substrate concentration (10 μM final concentration for each substrate). Meprin α was tested at 1.3, 1.9, 2.5, and 3.0 nM final assay concentrations, whereas meprin β concentrations were 0.075, 0.1, 0.15, and 0.2 nM. Additionally, both enzymes were utilized at 50 nM to ensure the 100% substrate turnover to enable the estimate of % substrate conversion in the linear range of reaction.
The reaction in presence of 1.9 and 1.3 nM of meprin α exhibited better R2 values than using 3.0 and 2.5 nM meprin α (Fig. 2A, R2 = 0.98 and 0.97 versus 0.95 and 0.96, respectively). After 60 min of reaction time, 3 nM meprin α hydrolyzed 52% of substrate, 2.5 nM hydrolyzed 49% of substrate, 1.9 nM hydrolyzed 42% of substrate, and 1.3 nM hydrolyzed 33% of substrate suggesting that reaction occurs in controlled manner (Fig. 2C). The reaction catalyzed by 0.2 nM and 0.15 nM of meprin β exhibited R2 values of 0.86 and 0.96, whereas R2 value for either 0.1 nM or 0.075 nM reactions was 0.98 (Fig. 2B). However, more than 50% of substrate was hydrolyzed by all four meprin β concentrations at 45 min time point (Fig. 2D). Based on these results, it was decided to use 0.075 nM meprin β for 30 min for further assay development.
Figure 2. Meprin α and β linearity and substrate conversion study.

Assays were monitored each 15 minutes to assess linearity and substrate % conversion. (A) Meprin α assay linearity study. R2 values: 3.0 nM = 0.95, 2.5 nM = 0.96, 1.9 nM = 0.98, 1.3 nM = 0.97; (B) Meprin β assay linearity study. R2 values: 0.2 nM = 0.86, 0.15 nM = 0.96, 0.1 nM = 0.98, 0.075 nM = 0.98; (C) Meprin α substrate conversion study; (D) Meprin β substrate conversion study.
The antibiotic and broad range hydroxamate-based inhibitor of metalloproteases actinonin (see structure in Fig. 3) has been shown to be an effective inhibitor of both meprin α and meprin β7, therefore, it was tested for suitability as a pharmacological assay control. Assays were performed using same meprin α and meprin β concentrations as above. IC50 values were calculated at 15, 30, 45 and 60 min of reaction time. Potency of actinonin was not dependent on the concentration of either enzyme. IC50 values for inhibition of meprin α and meprin β also showed little correlation with the time of reaction (Fig 3A–H). IC50 values were between 1.5 and 3 nM for meprin α reaction and 3–5 μM for meprin β reaction. This suggests that the assays are robust and at least moderately tolerant of changes, which ensures reproducible assay performance at least over the period of an HTS campaign. IC50 values were also concordant to those previously published 7.
Figure 3. Effects of reaction time and enzyme concentration on meprin α and meprin β HTS assay pharmacology.

(A) Meprin α assay; (B) Meprin β assay. Structure of pharmacological assay control (actinonin) is shown.
Assay Z′ and S/B parameters were also assessed to ascertain the effect of enzyme concentrations and time of reaction. In the case of meprin α, Z′ was acceptable (≥ 0.5) 5 for all enzyme concentrations tested starting at 45 min of reaction time (Fig. 4B) and signal to basal ratio (S/B) was > 2.0 at 45 min suggesting good separation between signal high and low controls. Meprin β reaction exhibited excellent Z′ values at 30 min of reaction for all enzyme concentrations with S/B values > 3.0. Based on these results, it was decided to use 0.075 nM meprin β for 30 min and 1.3 nM meprin α for 60 min reaction time for further assay development.
Figure 4. Effects of reaction time and enzyme concentration on QC parameters for meprin α and meprin β HTS assay.

(A) Meprin α assay Signal-to-Basal; (B) Meprin α assay Z′; (C) Meprin β assay Signal-to-Basal; (D) Meprin β assay Z′.
Most of HTS compound collections are stored in DMSO solutions 20, therefore, both assays were tested with 0.1% and 1.0% DMSO final concentration to assess its effect on assay performance and activity of the enzymes. As developed, the final DMSO concentration is 0.75% in both assays. As can be seen from Table 1, both assays exhibited similar QC parameters at 0.1% and 1.0% DMSO in assay buffer suggesting that DMSO has little or no effect on assays. Pharmacology of the control inhibitor (actinonin) also appeared unaffected by DMSO concentration in either meprin α (IC50 = 2.5 ± 0.1 nM vs. 1.5 ± 0.07 nM, for 1.0% and 0.1% DMSO, respectively) or meprin β (IC50 = 4.5 ± 0.1 μM vs. 5.2 ± 0.1 μM, for 1.0% and 0.1% DMSO, respectively) (data not shown).
Table 1.
Effect of DMSO concentration on assays’ QC parameters.
| ASSAY | PLATE %CV | PLATE S/B | PLATE Z | PLATE Z′ | ||||
|---|---|---|---|---|---|---|---|---|
| 1% DMSO | 0.1% DMSO | 1% DMSO | 0.1% DMSO | 1% DMSO | 0.1% DMSO | 1% DMSO | 0.1% DMSO | |
| Meprin α | 5.1 | 6.1 | 2.4 | 2.4 | 0.776 | 0.600 | 0.611 | 0.649 |
| Meprin β | 3.6 | 4.1 | 2.3 | 2.8 | 0.779 | 0.727 | 0.695 | 0.777 |
Both assays were tested on at least three different days using at least five plates each test day over several months. Both assays exhibited reproducible and acceptable QC parameters suggesting that the assays are robust (Table 2). IC50 values of pharmacological assay control (actinonin) were monitored each time the assays were run. As can be seen from Fig. 5, actinonin dose response curves obtained in the timespan of three months are virtually superimposable. IC50 values were 4.1 ± 0.5 nM, 4.4 ± 0.2 nM, and 4.8 ± 0.2 nM for meprin α and 4.8 ± 0.2 μM, 7.7 ± 0.8 μM, and 6.2 ± 0.7 μM for meprin β suggesting that assays maintain accuracy over an extended period of time.. These results suggested that both meprin α and meprin β HTS assays behave reproducibly and can be utilized for pilot screen of various compound libraries in 384 well plate format.
Table 2.
Summary of assays’ reproducibility study.
| ASSAY | PLATE %CV n = 15 |
PLATE S/B n = 15 |
PLATE Z n = 15 |
PLATE Z′ n = 15 |
|---|---|---|---|---|
| Meprin α | 4.4 ± 0.8 | 4.1 ± 0.9 | 0.7 ± 0.13 | 0.8 ± 0.1 |
| Meprin β | 4.9 ± 1.3 | 4.9 ± 1.3 | 0.7 ± 0.1 | 0.8 ± 0.1 |
All units are Mean ± SD.
Figure 5. Dose response reproducibility study using pharmacological control for (A) meprin α and (B) meprin β inhibition assays.

Experiments were conducted using 3-fold dilution series of inhibitor in quadruplicate. For each compound concentration, inhibition % was calculated and fitted with a four parameter equation describing a sigmoidal dose-response curve with adjustable baseline using GraphPad Prism® version 6.0 suite of programs. The IC50 values were generated from fitted curves by solving for X-intercept at the 50% inhibition level of Y-intercept.
Pilot screen of LOPAC collection
In order to estimate the assays’ readiness for HTS, a pilot screen against LOPAC, n = 1,280 compounds was conducted. The assays were recapitulated in 384 well plate format using laboratory automation equipment (384 pin tool, Flying Reagent Dispenser™).
Both assays followed the above mentioned respective protocols. The final concentration of LOPAC compounds in both assays was 18 μM. All assays QC parameters and IC50 values of the pharmacological control actinonin were reproducible with those of assays performed during the development stage. A total of four plates were used to screen either assay. Both assay exhibited low scatter and the controls embedded on each assay plate exhibited good plate-to-plate reproducibility (Fig. 6).
Figure 6. Results of meprin α and meprin β LOPAC pilot screen.

Meprin α and Meprin β LOPAC screen. n = 4 plates, 1,280 compounds were screened at 18 μM concentration.
In order to determine nominally active compounds, four values were calculated: (1) the average percent inhibition of all high controls tested plus three times their standard deviation, (2) the average percent inhibition of all low controls tested minus three times their standard deviation, (3) the average percent inhibition of all the compounds tested between (1) and (2), and (4) three times their standard deviation 19. The sum of these two values, (3) and (4) was used as a cutoff parameter, that is, any compound that exhibited greater percentage inhibition than the cutoff parameter was declared nominally active. Calculated hit cutoff value was 25% inhibition for each assay.
Using this approach we found 14 compounds nominally active against meprin α and 17 compounds active against meprin β (Fig. 7), which corresponded to a hit rate of 1.09% and 1.33% for meprin α and meprin β, respectively. 8 compounds exhibited activity greater than 50% inhibition, out of which 4 compounds were selective for meprin α and 4 compounds were selective for meprin β (Fig. 7, red circles). One of the meprin α selective compounds identified in the screen was actinonin which, fortuitously, was present in the LOPAC collection (Fig. 7). Other known metalloprotease inhibitors present in the LOPAC (clodronic acid, epibestatin HCl, 2,2′-bipyridyl, 1,10-phenanthroline monohydrate) were inactive against either enzyme. Due to availability issues for meprin α selective hits we were able to perform dose response experiments on only meprin β selective compounds.
Figure 7. Correlation of the results of the meprin α and meprin β LOPAC pilot screens.

Selective hits are shown as red dots. Meprin α selective hits: 1 - Actinonin, 2 – cis-Azetidine-2,4-dicarboxylic acid, 3 – N-Acetylprocainamide hydrochloride, 4 – Acetohexamide. Meprin β selective hits: 1 - NF449, 2 – PPNDS, 3 – Carboplatin, 4 – Cisplatin.
4 meprin β selective hits were NF449 (4,4′,4″,4‴-[Carbonyl-bis[imino-5,1,3-benzenetriyl bis-(carbonyl-imino)]]tetrakis(benzene-1,3-disulfonic acid), PPNDS (Pyridoxal-5′-phosphate-6-(2′-naphthylazo-6′-nitro-4′,8′-disulfonate) tetrasodium), carboplatin, and cisplatin. NF449, carboplatin, and cisplatin exhibited negative inhibition values suggesting that they either increase the rate of meprin β-catalyzed reaction or directly increase fluorescence of fluorophore (Mca) via formation of complex with higher quantum yield. NF449 did not exhibit the same effect in the dose response experiment (Fig. 8A) suggesting that in primary screen it was a result of environmental interference (dust, meniscus shape). Cisplatin exhibited dose dependent negative inhibition suggesting that it indeed increases the rate of hydrolysis by meprin β (data not shown). Since we are interested only in the inhibitors of meprin β, we did not pursue this further.
Figure 8. Characterization of meprin β selective hits from LOPAC screen.

(A) NF449 dose response study; (B) PPNDS dose response study; (C) NF449 Lineweaver-Burke plot. Note the lines of best fit to intersect above the X-axis suggesting mixed competitive/non-competitive inhibition modality. (D) PPNDS Lineweaver-Burke plot. Note the lines of best fit to intersect on the Y-axis suggesting pure competitive inhibition modality. (E) Structure of NF449; (F) Structure of PPNDS.
Cisplatin has been shown to cause zinc deficiency in cancer patients due to displacing zinc from zinc-binding sites of albumin21. This suggested that carboplatin and cisplatin could potentially act by displacing zinc of meprin β active site and potentially inhibit other zinc-dependent metalloproteases. Indeed, the testing of cisplatin against panel of zinc metalloproteases confirmed its broad spectrum activity (Table 3); therefore, cisplatin and carboplatin were not pursued further.
Table 3.
Summary of selectivity testing of Meprin β hits cisplatin, PPNDS, and NF449.
| Compound | Meprin α | Meprin β | MMP-1 | MMP-2 | MMP-8 | MMP-9 | MMP-13 | MMP-14 | ADAM10 | ADAM17 |
|---|---|---|---|---|---|---|---|---|---|---|
| Cisplatin | >100 | 95±5 | 5.1±0.5 | 5.1±0.6 | NT | 13.9±2.1 | >100 | NT | 4.2±0.2 | 5.1±0.4 |
| PPNDS | 67±4.5 | 0.08±0.005 | NT | 31±2 | 1.0±0.1 | 40±2.5 | 69±4.3 | 73±7 | 19±1.1 | 91±7.1 |
| NF449 | >100 | 0.07±0.005 | NT | 6.0±0.5 | 1.0±0.1 | 8.6±0.7 | 40±3 | 18±1.5 | 1.2±0.1 | 4.6±0.3 |
All units are IC50, μM. n = 3 Mean ± SD.
Two other meprin β selective hits, PPNDS and NF449, were quite selective in testing against zinc metalloproteases (Table 3). PPNDS exhibited 0.08±0.005 μM IC50 value for inhibition of meprin β, while meprin α was inhibited with IC50 of 67±4.5 μM, almost a 1000-fold difference. Next most potent inhibition was against MMP-8 (IC50 = 1.0±0.1 μM), an approximately 12-fold selectivity ratio. NF449 exhibited similar to PPNDS inhibition profile with more than a 1000-fold potency differential for meprin α and approximately 12-fold potency differential for MMP-8. Additionally, it inhibited ADAM10 more potently than PPNDS (IC50 = 1.2±0.1 μM).
PPNDS and NF449 are the most potent inhibitors of meprin β reported to date and the first inhibitors with nanomolar potencies. Until discovery of PPNDS and NF449, actinonin was the most potent reported inhibitor of meprin β with Ki value = 2.0 ± 0.23 μM 7. Interestingly, despite being a zinc-dependent metalloprotease, meprin β shows little sensitivity towards zinc-binding broad spectrum inhibitors of metalloproteases such as batimastat (Ki = 18 ± 2.2 μM) or galardin (Ki = 8.9 ± 0.71 μM)7 which inhibit MMPs and ADAMs with low nanomolar IC50 values.
The presence of sulfonate moieties is a common feature of PPNDS and NF449 (Fig. 8E and F). Zinc can form salts with sulfonic acid (e.g. zinc sulfonate was used to treat acne in 1970s) which suggests that PPNDS and NF449 act via zinc-binding which would prevent binding of substrate to an active site. Indeed, inhibition kinetics study using substrate (MCA)-EDEDED-(K-ε-DNP) utilized for HTS assay confirmed that both PPNDS and NF449 are mostly competitive inhibitors of meprin β. Non-linear regression analysis suggested pure competitive inhibition mechanism for PPNDS (α = Ki/Ki′ = 36 ± 27), and competitive mechanism with elements of non-competitive inhibition for NF449 (α = Ki/Ki′ = 3.6 ± 4.3). Additional evaluation of inhibition mechanisms by model comparison routine of GraphPad Prism software indicated that these are indeed preferred inhibition models. Examination of the kinetic data by linearized Lineweaver-Burke graphic approach confirmed the pure competitive inhibition modality for PPNDS (Fig. 8D) and mixed inhibition for NF449 (Fig. 8C). Ki values were 8.0 ± 2.4 nM for PPNDS and 22 ± 9.6 nM for NF449.
Ki values were 10-fold lower than IC50 values for PPNDS (8.0 ± 2.4 nM versus 80 ± 5 nM for Ki and IC50, respectively) and 3-fold lower for NF449 (22 ± 9.6 nM versus 70 ± 5 nM for Ki and IC50, respectively). HTS assay utilized 10 μM substrate whereas KM value for hydrolysis of (MCA)-EDEDED-(K-ε-DNP) substrate by meprin β is approximately 10-fold lower (0.7 ± 0.1 nM). Since PPNDS is a pure competitive inhibitor, its IC50 value in HTS assay is affected more significantly by the concentration of the substrate than NF449 which is a mixed inhibitor 22. Despite activity against several related zinc metalloproteases, PPNDS and NF449 inhibit meprin β with more than 10-fold selectivity as compared to the next most potently inhibited metalloprotease which will enable researchers to use PPNDS and NF449 in biological studies.
One of the advantages of screening a collection of well-characterized compounds (i.e., LOPAC) is the availability of background information on biological activity of the compounds contained in the library. Interestingly, both PPNDS and NF449 are antagonists of P2X1 purinergic receptor with well-developed SAR and known synthetic pathways 23. NF449 was derived from suramin that was used as anti-trypanosomal 24 and anti-helminthic 25 (Fig. 9). NF449 and several other analogs of suramin were synthesized in order to obtain Gsα-selective G protein antagonists 26 and inhibitors of HIV-1 and -2 reverse transcriptase (RT) 27; therefore, the synthetic pathways have already been developed which will simplify future medicinal chemistry efforts. It will be interesting to assess the effects of sulfonic acid residues on potency and selectivity of NF449 analogs towards meprin β. Additionally, the fact that PPNDS has significantly lower molecular weight than NF449 (694 g/mol versus 1401 g/mol for PPNDS and NF449, respectively), but comparable potency and selectivity for meprin β (Table 3) suggests that size of NF449 analogs can be decreased without losing its properties. Future studies can also deduce the minimal structure necessary for selective inhibition of meprin β.
Figure 9. Structure comparison of meprin β selective compounds NF449 and PPNDS to their respective precursors, suramin and PPADS.

Common scaffold in NF449 and suramin structures are shown in red. Common scaffold in PPNDS and PPADS structures are shown in blue. Common scaffold in PPNDS and suramin structures are shown in boxes.
PPNDS (pyridoxal-5′-phosphate-6-2′-naphthylazo-6′-nitro-4′,8′-disulfonate) was derived from PPADS (pyridoxal-5′-phosphate-6-phenylazo-2′,4′-disulfonate) to achieve greater potency and selectivity for P2X1 receptor 28. Interestingly, PPNDS possesses structural features of both PPDAS and suramin (Fig. 9).
In conclusion, we developed novel, simple, cost-effective and robust HTS assays for the discovery of meprin α and meprin β inhibitors which were used to conduct a pilot screen against a collection of well-characterized compounds (LOPAC, n = 1,280 compounds). As a result of the screen, several selective compounds for either enzyme were identified and two available compounds confirmed their activity and selectivity in dose response experiment. QC parameters of both assays (Z′, S/B, IC50 value of pharmacological control) remained stable throughout the development and screen suggesting assays’ readiness for large scale screening effort. Additionally, 2 compounds from the LOPAC collection are first meprin β selective hits with nanomolar potency and affinity. Future efforts will be focused on SAR and medicinal chemistry studies to ascertain the minimal structural requirements for the selective inhibition of meprin β. These optimized compounds will enable future structural and biological studies of meprin β. These results demonstrate the ability of meprin α and β assays to identify selective compounds and discard artifacts of primary screening.
Acknowledgments
Acknowledgements and Funding Sources
This work was supported by the James and Esther King Bio-medical Research Program (2KN05 to DM), the National Institutes of Health (DA033985 to DM, CA098799 to GBF, U54MH084512 to FM, LS, PSH and TPS), the Multiple Sclerosis National Research Institute (to GBF), and the State of Florida, Executive Office of the Governor’s Office of Tourism, Trade, and Economic Development. This work was also supported by the Deutsche Forschungsgemeinschaft (DFG) grant SFB877 “Proteolysis as a Regulatory Event in Pathophysiology” (project A9) and grant BE 4086/2-1 (both to C.B.-P.). We thank Pierre Baillargeon and Lina DeLuca (Lead Identification, Scripps Florida) for compound management.
Abbreviations
- LOPAC
library of pharmaceutically active compounds
- HTS
high throughput screening
- IBMX
3-isobutyl-1-methylxanthine
- MMP
matrix metalloprotease
- ADAM
a disintegrin and metalloprotease
- MOI
multiplicity of infection
Footnotes
Notes
The authors declare no competing financial interests.
References
- 1.Sterchi EE, Stocker W, Bond JS. Mol Aspects Med. 2008;29:309–328. doi: 10.1016/j.mam.2008.08.002. [DOI] [PMC free article] [PubMed] [Google Scholar]
- 2.Marchand P, Tang J, Bond JS. J Biol Chem. 1994;269:15388–15393. [PubMed] [Google Scholar]
- 3.Bertenshaw GP, Norcum MT, Bond JS. J Biol Chem. 2003;278:2522–2532. doi: 10.1074/jbc.M208808200. [DOI] [PubMed] [Google Scholar]
- 4.Becker C, Kruse MN, Slotty KA, Kohler D, Harris JR, Rosmann S, Sterchi EE, Stocker W. Biol Chem. 2003;384:825–831. doi: 10.1515/BC.2003.092. [DOI] [PubMed] [Google Scholar]
- 5.Arolas JL, Broder C, Jefferson T, Guevara T, Sterchi EE, Bode W, Stocker W, Becker-Pauly C, Gomis-Ruth FX. Proc Natl Acad Sci U S A. 2012;109:16131–16136. doi: 10.1073/pnas.1211076109. [DOI] [PMC free article] [PubMed] [Google Scholar]
- 6.Herzog C, Kaushal GP, Haun RS. Cytokine. 2005;31:394–403. doi: 10.1016/j.cyto.2005.06.012. [DOI] [PubMed] [Google Scholar]
- 7.Kruse MN, Becker C, Lottaz D, Kohler D, Yiallouros I, Krell HW, Sterchi EE, Stocker W. Biochem J. 2004;378:383–389. doi: 10.1042/BJ20031163. [DOI] [PMC free article] [PubMed] [Google Scholar]
- 8.Kronenberg D, Bruns BC, Moali C, Vadon-Le Goff S, Sterchi EE, Traupe H, Bohm M, Hulmes DJ, Stocker W, Becker-Pauly C. J Invest Dermatol. 2010;130:2727–2735. doi: 10.1038/jid.2010.202. [DOI] [PubMed] [Google Scholar]
- 9.Kohler D, Kruse M, Stocker W, Sterchi EE. FEBS Lett. 2000;465:2–7. doi: 10.1016/s0014-5793(99)01712-3. [DOI] [PubMed] [Google Scholar]
- 10.Broder C, Arnold P, Vadon-Le Goff S, Konerding MA, Bahr K, Muller S, Overall CM, Bond JS, Koudelka T, Tholey A, Hulmes DJ, Moali C, Becker-Pauly C. Proc Natl Acad Sci U S A. 2013;110:14219–14224. doi: 10.1073/pnas.1305464110. [DOI] [PMC free article] [PubMed] [Google Scholar]
- 11.Broder C, Becker-Pauly C. Biochem J. 2013;450:253–264. doi: 10.1042/BJ20121751. [DOI] [PMC free article] [PubMed] [Google Scholar]
- 12.Bien J, Jefferson T, Causevic M, Jumpertz T, Munter L, Multhaup G, Weggen S, Becker-Pauly C, Pietrzik CU. J Biol Chem. 2012;287:33304–33313. doi: 10.1074/jbc.M112.395608. [DOI] [PMC free article] [PubMed] [Google Scholar]
- 13.Becker-Pauly C, Barre O, Schilling O, Auf dem Keller U, Ohler A, Broder C, Schutte A, Kappelhoff R, Stocker W, Overall CM. Mol Cell Proteomics. 2011;10:M111 009233. doi: 10.1074/mcp.M111.009233. [DOI] [PMC free article] [PubMed] [Google Scholar]
- 14.Hachisu M, Hiranuma T, Murata S, Aoyagi T, Umezawa H. Life Sci. 1987;41:235–240. doi: 10.1016/0024-3205(87)90498-x. [DOI] [PubMed] [Google Scholar]
- 15.Fields GB, Lauer-Fields JL, Liu R-q, Barany G. In: Synthetic Peptides: A User’s Guide. Grant GA, editor. W.H. Freeman & Co; New York: 2001. pp. 93–219. [Google Scholar]
- 16.de Jong GI, Buwalda B, Schuurman T, Luiten PG. Brain Res. 1992;596:345–348. doi: 10.1016/0006-8993(92)91570-5. [DOI] [PubMed] [Google Scholar]
- 17.Becker-Pauly C, Howel M, Walker T, Vlad A, Aufenvenne K, Oji V, Lottaz D, Sterchi EE, Debela M, Magdolen V, Traupe H, Stocker W. J Invest Dermatol. 2007;127:1115–1125. doi: 10.1038/sj.jid.5700675. [DOI] [PubMed] [Google Scholar]
- 18.Zhang JH, Chung TD, Oldenburg KR. J Biomol Screen. 1999;4:67–73. doi: 10.1177/108705719900400206. [DOI] [PubMed] [Google Scholar]
- 19.Hodder P, Cassaday J, Peltier R, Berry K, Inglese J, Feuston B, Culberson C, Bleicher L, Cosford ND, Bayly C, Suto C, Varney M, Strulovici B. Anal Biochem. 2003;313:246–254. doi: 10.1016/s0003-2697(02)00608-5. [DOI] [PubMed] [Google Scholar]
- 20.Janzen WP, Popa-Burke IG. J Biomol Screen. 2009;14:444–451. doi: 10.1177/1087057109335262. [DOI] [PubMed] [Google Scholar]
- 21.Hu W, Luo Q, Wu K, Li X, Wang F, Chen Y, Ma X, Wang J, Liu J, Xiong S, Sadler PJ. Chemical Communications. 2011;47:6006–6008. doi: 10.1039/c1cc11627d. [DOI] [PubMed] [Google Scholar]
- 22.Copeland R. Evaluation of enzyme inhibitors in drug discovery. John Wiley and Sons; 2005. [PubMed] [Google Scholar]
- 23.Lambrecht G, Braun K, Damer M, Ganso M, Hildebrandt C, Ullmann H, Kassack MU, Nickel P. Curr Pharm Des. 2002;8:2371–2399. doi: 10.2174/1381612023392973. [DOI] [PubMed] [Google Scholar]
- 24.Darsaud A, Chevrier C, Bourdon L, Dumas M, Buguet A, Bouteille B. Trop Med Int Health. 2004;9:83–91. doi: 10.1046/j.1365-3156.2003.01154.x. [DOI] [PubMed] [Google Scholar]
- 25.Anderson J, Fuglsang H. Br J Ophthalmol. 1978;62:450–457. doi: 10.1136/bjo.62.7.450. [DOI] [PMC free article] [PubMed] [Google Scholar]
- 26.Hohenegger M, Waldhoer M, Beindl W, Boing B, Kreimeyer A, Nickel P, Nanoff C, Freissmuth M. Proc Natl Acad Sci U S A. 1998;95:346–351. doi: 10.1073/pnas.95.1.346. [DOI] [PMC free article] [PubMed] [Google Scholar]
- 27.Tan GT, Wickramasinghe A, Verma S, Singh R, Hughes SH, Pezzuto JM, Baba M, Mohan P. J Med Chem. 1992;35:4846–4853. doi: 10.1021/jm00104a010. [DOI] [PubMed] [Google Scholar]
- 28.Lambrecht G, Rettinger J, Baumert HG, Czeche S, Damer S, Ganso M, Hildebrandt C, Niebel B, Spatz-Kumbel G, Schmalzing G, Mutschler E. Eur J Pharmacol. 2000;387:R19–21. doi: 10.1016/s0014-2999(99)00834-1. [DOI] [PubMed] [Google Scholar]