

Abstract
BACKGROUND
Accurate localization and visualization of subdural electrodes implanted for intracranial electroencephalography in cases of medically refractory epilepsy remains a challenging clinical problem.
OBJECTIVE
We introduce a technique for creating accurate 3-dimensional (3D) brain models with electrode overlays, ideal for resective surgical planning.
METHODS
Our procedure uses postimplantation magnetic resonance imaging (MRI) and computed tomographic (CT) imaging to create 3D models of compression-affected brain combined with intensity-thresholded CT-derived electrode models using freely available software. Footprints, or “shadows,” beneath electrodes are also described for better visualization of sulcus-straddling electrodes. Electrode models were compared with intraoperative photography for validation.
RESULTS
Realistic representations of intracranial electrode positions on patient-specific postimplantation MRI brain renderings were reliably created and proved accurate when compared with photographs. Electrodes placed interhemispherically were also visible with our rendering technique. Electrode shadows were useful in locating electrodes that straddle sulci.
CONCLUSION
We present an accurate method for visualizing subdural electrodes on brain compression effected 3D models that serves as an ideal platform for surgical planning.
Keywords: Electrodes, Electrocorticography, Electroencephalography, Epilepsy, Intracranial electroencephalography, Subdural, 3-dimensional
Epileptic patients with medically intractable localization-related seizure disorders often require implantation of subdural electrodes for the purpose of seizure localization1–4 and mapping of eloquent cortex5,6 as part of their surgical evaluation. Once the electrode locations where seizures arise are identified, neurosurgical planning to define the boundaries of the required surgical resection can pose a challenging problem if the cortical locations of the subdural electrodes are not clearly determined. Accurate knowledge of electrode positions assumes greater significance when the epileptogenic zones border eloquent cortices such as language, motor, or visual areas. Several techniques have been used to visualize electrode placement in vivo, including artifact localization,7,8 3-dimensional reconstruction and x-ray-derived location projection,9,10 automated template magnetic resonance imaging (MRI) transformation and projection,11 x-ray coregistration,9,10,12 curvilinear reformation,13 computed tomography (CT)/MRI coregistration14–16 computer-aided stereotactic model creation,17 as well as digital 2D photography coregistered to 3-dimensional (3D) reconstructed MRI.18,19 More recently, intraoperative fluoroscopy has been used for strip electrode placement.20 These methods are useful to a degree in the visualization of electrode locations, but each lack accuracy and/or resolution in imaging detail because of interpolation and projection limitations.
Some of the more recently published procedures rely on 2-dimensional (2D) photographic and x-ray9,10 information regarding electrode position. This requires the estimation of complicated 3D brain geometry with 2D pictorial information and limits localization to those electrodes exposed. Strip electrodes placed via burr holes are not visible with these techniques.
Closure of the craniotomy causes brain distortion and cortical compression,21,22 and can physically shift electrodes from their initial position. This brain compression has been depicted in previous studies7,10,23 and affects the cortex at the critical period of patient monitoring. In all previously published techniques, preimplantation MRI has been used to create cortical rendering models.10,12,14,19,24 This is done because MRI images gathered postimplantation are subject to magnetic field susceptibility artifacts caused by the metal electrodes at the surface of the brain. Thus, 3D rendering of electrode-affected images has been limited. Consequently, brain shift and compression caused by electrode grids and craniotomy defects has never been satisfactorily addressed in imaging models.
The method described here provides a measurement of electrode positions overlaid on 3D renderings of patient-specific, post-implantation cortical surface reconstructions. This method relies on a combination of postimplantation CT and MR imaging and provides 3D representations of each patient’s uniquely compressed cortical surface anatomy with intracranial electroencephalography (iEEG) electrodes overlaid. Midline cortical surface views are also realizable. In addition, we describe a method for creating illustrative electrode “shadows” that identify cortical patches beneath each electrode and help locate sulcal-straddling electrodes that may potentially pick up iEEG signals from 2 adjacent gyri.
METHODS
Six adult patients (S1 to S6) (2 male, 4 female; mean age, 32 years) with medically intractable epilepsy undergoing surgical implantation of subdural electrodes for epileptic zone localization were enrolled in this study. Our institutional review board approved this Health Insurance Portability and Accountability Act-compliant study. All patients gave informed written consent.
Electrode Implantation
Implanted platinum-iridium alloy electrode discs (4-mm diameter) were arranged in a grid (8 × 8), partial grid (8 × 2), strip (4 × 1 or 6 × 1), and/or a combination of each (Ad-Tech Medical, Racine, Wisconsin). In some cases (as shown in Figure 1E), grids were trimmed of unnecessary electrodes at the discretion of our neurosurgeon (W.M.). Burr hole (trephine) craniotomy implantations were performed for some strip electrode implantations. The subdural grids were sewn to the dura to prevent movement during inpatient seizure monitoring with continuous video-iEEG recording.
FIGURE 1.
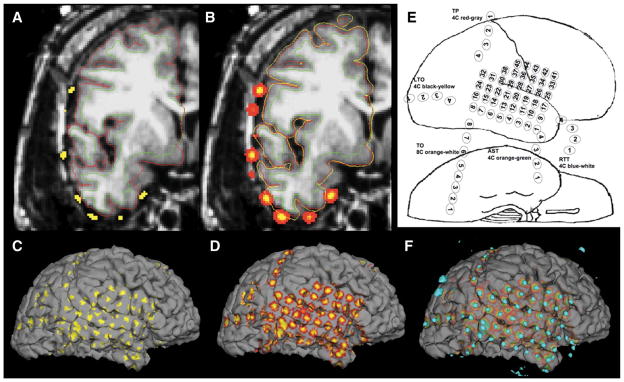
Illustration of the creation and implementation of electrode shadows on patient S1. A, electrodes from binarized CT data are shown in yellow. Thin red outline indicates the pial brain surface, and the thin green outline indicates the white matter/gray matter boundary. B, illustration of the benefit of volumetrically smoothing electrodes before projection. The partially inflated pial brain surface is shown with a yellow line that intersects with all electrodes. C, electrode shadows cast onto the pial surface without electrode smoothing. D, smoothed CT electrode projected as surface shadows cast upon the pial brain surface. E, electrode placement cartoon indicating electrode names and numbers in patient S1. F, combination of 3D representation of binarized electrodes (teal) from A and electrode shadows from C for final visualization with 3Dslicer.
Medical Imaging
Patients underwent 2 separate imaging studies for epilepsy (resective) surgery planning after the placement of subdural electrodes. Structural 3D T1-weighted spoiled gradient echo (SPGR) MR images were gathered using a 1.5-T MR unit (GE Healthcare, Waukesha, Wisconsin) with commercially available hardware and software, voxel size, 1.25 × 1.25 × 1.3 mm; repetition time, 8.74 ms; echo time, 1.66 ms; field of view, 256 × 256 mm; and flip angle, 15°. A postimplant high-resolution CT (GE Healthcare, Waukesha, Wisconsin) scan was also acquired with commercially available multidetector hardware, helical scan with voxel size of 0.5 × 0.5 × 0.625 mm, tube voltage of 140 kV, 250-mm field of view, current (310, 325, 325, 300, 250, and 250 mA, respectively, S1 to S6), and gantry angle (7, 14, 13.5, 0, 27.5, and 5.5°, respectively, S1 to S6). The postimplant MR imaging was used to create a 3D reconstruction of the brain affected by compression, whereas the CT data were used for electrode localization by way of rigid coregistration to the postimplant MR data. In each patient’s case, both CT and MR images were gathered within 12 hours of electrode implantation surgery.
MRI Processing
MRI data were processed using Freesurfer (www.surfer.nmr.mgh.-harvard.edu) to produce patient-specific 3D cortical surface models.25–27 Because of craniotomy and electrode defects that caused imaging artifacts, in 2 cases, manual edits were performed to correct errors in automated skull-stripping results generated by Freesurfer. The automated skull-stripping tool BET (FMRIB software library, http://www.fmrib.ox.ac.uk/fsl) was also used in lieu of manual editing on 2 other patients, because poor skull stripping affected processing time.
CT Image Processing
Postimplantation, CT data were gantry angle corrected using a shear correction term in the transformation matrix and resampled using trilinear interpolation to 1-mm isotropic Freesurfer MRI space. Data were then coregistered to postimplant MRI data15,16 using the mutual information algorithm in FLIRT (FMRIB software library, http://www.fmrib.ox.ac.uk/fsl). A board-certified radiologist (S.R.) visually verified the coregistration of all data. The CT data were then thresholded and binarized to limit the image information to the electrodes only.17 The threshold value was chosen manually to eliminate streak (beam hardening) artifact from the electrodes,7 as shown in Figure 1A (yellow dots overlaid on MRI).
Electrode Shadow Creation
The creation of brain surface-based electrode shadows began by 3D smoothing of binarized CT electrode maps with a 2-mm-radius Gaussian filter, as shown by example in Figures 1A and 1B. Pial brain surfaces derived from Freesurfer were then partially inflated in a stepwise manner, looking for intersections with the CT electrodes. Any intersections with the inflated pial surfaces (Figure 1B, yellow line) by CT electrodes (Figure 1B, yellow and red clusters) were recorded. Maximal intersected values were then “painted” onto the brain surface (Figure 1D).
3D Model Creation and Display
Freesurfer-generated pial surfaces bearing electrode shadows were loaded into 3Dslicer (http://www.slicer.org) for viewing. Then, 3D tessellations were rendered around thresholded CT electrodes for simultaneous visualization of the brain surface generated from routine clinical MR imaging with iEEG electrodes generated from routine clinical CT imaging. This resulted in 3D brain surface models with “orbiting” electrodes overlaid on the cortex (Figures 1F, 2, 3A, 3C, 3E, 4, and 5E).
FIGURE 2.
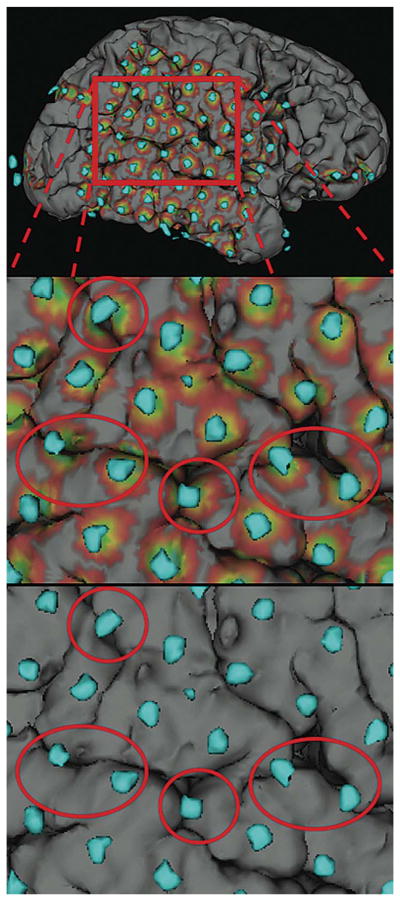
Illustration of the use of electrode shadows in determining sulcal-straddling electrodes. Top, cortical electrode model of patient S5. Middle, zoomed in view of electrodes with shadows, suspected sulcal-straddling electrodes circled in red. Bottom, same view without shadows.
FIGURE 3.

Three-dimensional electrode representations in 3 patients (without electrode shadows) cast on the brain surface in patient S1 (A), patient S2 (C), and patient S3 (E). Corresponding digital intraoperative photographs of brain anatomy before electrode explantation and resection of epileptic zones are shown in B, D, and F, respectively. Yellow lines indicate major sulcal patterns for identification and comparison of electrode positions. Red lines indicate the edges of dural flaps that cover some electrodes in the digital photographs. Two asterisks (**) in A and B indicate the temporal-occipital electrode strip shown in Figure 2E for patient S3. Three asterisks (***) indicate a suction instrument holding down the grid for photography in A and B, a single asterisk (*) indicates a metal marker in the grid provided by the vendor, rather than a spurious electrode.
FIGURE 4.

Final cortical surface electrode models for all 6 patients (S1 to S6) illustrating grid and strip electrode locations and their corresponding projected shadows. Patient S4 illustrates the ability to visualize medial electrodes between hemispheres, as a partial grid of electrodes is shown placed over corpus collosal defect. Orbiting electrodes from the right hemisphere are visible in patient S4’s model. In the reconstruction of patient S3, electrode shadows were unable to be generated. Larger grounding electrodes attached to the skull are visible in patients S1 (posterior), S2 (lateral), S3 (lateral), S5 (posterior), and S6 (dorsal). Brain compression caused by the grid is clearly visible in the lower panels of S1, S2, and S3.
FIGURE 5.

Comparison of 3D representations of the same cortex (patient S6). A, 3D volume rendering of the right hemisphere produced by skull stripping and 3D rendering with the Analyze software package, compared with D produced with Freesurfer software (ventral surface below). B and E show projections of electrodes onto the corresponding brain surfaces. Gyral and sulcal patterns are clearly visible in D and E, but are distorted in A and B by metallic electrode susceptibility artifacts. C and F show the corresponding cortical reconstructions of the unimplanted left hemisphere.
Qualitative Comparison With Intraoperative Photography
Digital photographs of visible electrodes were taken for research purposes at the time of epileptic zone resection on 3 patients (S1 to S3) for qualitative visual comparison with 3D models (Figures 3B, 3D, and 3F). The photographs were obtained with a consumer-grade, commercially available 7-megapixel digital camera (Sony Inc., New York, New York), and were cropped and converted to grayscale using Photoshop software (Adobe Inc., San Jose, California). To alleviate concerns of possible electrode shift before epileptic zone resection and to avoid excessive lengthening of the surgical procedure for research purposes, electrodes were carefully and minimally exposed for photography, as evident in portions of Figure 3.
Comparison With Skull-Stripped, 3D Volume Rendering by Analyze Software
As a final test of the new approach, the 3D models were compared with what can be obtained using the commercial Analyze software package.28 The clinical postimplant 3D T1w SPGR dataset was loaded into the Analyze workspace and converted to cubic voxels (isotropic, 1 to 1.5 mm). The semiautomated skull-stripping tool in the SISCOM module was performed. Any residual skull, extra-axial fluid, or grid metal artifact was manually edited as needed.
The clinical postimplant CT dataset was gantry angle-corrected, loaded into the Analyze workspace, and converted to cubic voxels (isotropic, 0.5 mm). The isotropic CT dataset was manually thresholded, leaving only metallic contacts from intracranial electrode grids and/or strips.
The original isotropic CT dataset (match) was then aligned to the original isotropic SPGR dataset (base) with the semiautomated 3D Voxel Registration function (normalized mutual information algorithm). The resulting transformation matrix was then applied to the thresholded CT dataset to coregister the electrodes to the skull-stripped SPGR dataset. The coregistered CT and MRI datasets were then fused, and displayed with 3D volume rendering (volume-compositing algorithm).
RESULTS
Surface Reconstruction and Model Creation
Freesurfer accurately reproduced cortical surfaces from routine clinical brain MR imaging in the presence of electrode artifacts, leaving major sulcal and gyral patterns intact in a rendering ideally suited for interactive, computer-guided surgical planning (Figures 4 and 5D). Comparison with actual anatomy as photographed in the operating room also confirmed that identifiable sulcal and gyral landmarks were accurately rendered by the software (Figure 3). For each patient, the Freesurfer cortical reconstruction took approximately 24 hours, or 12 hours per hemisphere on a 2.6-GHz Intel Core 2 Duo MacBook Pro (Apple Inc., Cupertino, California).
The combination of Freesurfer-derived surfaces and 3Dslicer’s rendering and viewing capabilities provided a real-time, operator-guided rotational viewing of the combined 3D model of the brain surface rendering and orbiting electrodes and simultaneous traditional 2D coronal, sagittal, and axial views.
Assessment of Sulcal-Straddling Electrodes
As shown in Figure 2, the electrode shadows were used in the visual identification of electrodes centered on a sulcus. Smoothing of the electrode map before projection proved essential, because the use of unsmoothed electrodes (Figure 1C) led to partial and unpredictable grid electrode coverage of the brain surface.
Comparison of 3D Model With Photographs
As portrayed in Figure 3, the 3D model of the brain surface accurately depicted the location of the electrodes when compared qualitatively with intraoperative photographs taken at the time of epileptic zone resection in the first 3 patients (S1 to S3). Figure 3A shows electrodes 12 to 15 clearly lying in the same gyral locations in the anatomic correlate on the right. Electrode 54 in Figure 3C and electrode 30 in Figure 3E were both determined to be straddling a sulcus, which proved to be the case when photographed (Figures 3D and 3F, respectively). There remained a significant portion of electrodes (especially those in strips) that were never directly observable, and therefore not photographable in the operating room, so no comparison could be made. Visualization of these “hidden” electrodes was achieved (Figure 4) with our approach, which allowed clinicians to see the location of strips beyond the edge of the craniotomy defect in the skull.
Comparison of Surface Creation Software
Major landmarks such as the Sylvian fissure and the central sulcus are visible with both 3D rendering techniques applied to MRIs with grids placed. Smaller anatomic features, such as the supramarginal and angular gyrus, are distorted on the Analyze-rendered surface, although visible with the Freesurfer-rendered surface. Both, to some extent, exhibit surface-based distortions caused by the electrode artifacts, but sulcal definition is much more intact on the Freesurfer surface (Figure 5). Strip electrodes located beneath the temporal lobe are visible with the Freesurfer-derived surfaces, but not with the Analyze rendering because of the inclusion of the cerebellum. The 3D rendering in Analyze was markedly faster than Freesurfer, though it required increased manual editing time. On the order of a few minutes rather than hours.
DISCUSSION
We provide a novel 3D image-processing technique for visualizing subdural electrodes on accurate compression-affected brain models based on imaging gathered postimplantation. This new method serves as an ideal platform for surgical planning, allowing simultaneous visualization of the postimplant 2D MRI with CT overlay, and a realistic 3D model of the combined modalities. We also provide a method for determining corresponding electrode “shadows” of the nearest cortex that are presumably sampled with iEEG. Our method relies on the acquisition of routine clinical postimplantation MRI and CT images, and open-source software for cortical brain surface reconstruction, image coregistration, and visualization.
The advantages of our rendering scheme are numerous. The electrode positions on the cortex are determined with reference to the postimplantation state of the brain surface, which accommodates significant amounts of cortical flattening and distortion due to craniotomy defects. Cortical displacement can be a serious issue, as shown in previously published reports10,22,23 such as Figure 5 in Dalal et al.10 Techniques have typically relied on electrode visualization on a preimplantation brain MRI scan that is unaffected by cortical shift or metallic electrode artifact.9,10,12,14,19,24 Until now, these cortical displacement effects on electrode position have been impossible to measure accurately in 3D models, and consequently have been ignored. Our current technique gives researchers and clinicians the ability to measure electrode positions in the same postimplantation state in which patients are monitored with iEEG.
Freesurfer proved to be superlative in brain surface reconstruction in comparison with Analyze software because of the methods it uses in brain model creation. Freesurfer begins at the white matter/gray matter boundary, and following intensity gradients outward, creates the pial surface. This method preserves the underlying brain architecture, while reducing the dependency on metallic artifact-laden cortical surfaces for architectural definition. Freesurfer processes each cerebral hemisphere separately, allowing one to visualize medial surfaces (ie, Figure 4, patient S4, top). This view is unobtainable with other automated 3D volume-rendering methods (such as those used in Analyze) that use virtual ray tracing to simulate reflected light from the whole brain surface in vivo. The benefits are readily apparent in a comparison of the Freesurfer renderings with those obtainable with the skull-stripped, volume renderings available in Analyze. Figure 5A shows a complete loss of sulcal definition and a lack of anatomic landmarks for electrode localization, whereas Figure 5D shows the same patient with intact sulcal definition, gyral patterns, and anatomic specificity generated with the algorithms in Freesurfer. Even though the rendering time of Freesurfer is substantially longer than Analyze, the resulting surface rendering has vastly improved architecture when reconstructing brain images corrupted by electrode susceptibility artifacts.
More research needs to be done to further elucidate the amount of cortical surface actually sampled by the electrodes by using more sophisticated algorithms.29–31 In this study we do not assume that the electrode shadows indicate the origins of the iEEG signals for all electrodes at all times. This complex source-modeling problem may, however, now be addressable with our method of postimplantation MRI reconstruction and electrode projection.
Projecting electrode shadows to the brain surface provides an illustrative tool for locating electrodes straddling a sulcus well before neurosurgeons are faced with them in the operating room at the time of epileptic zone resection. Based on proximity alone, these electrodes potentially record iEEG signals from the 2 different gyri and the underlying sulcus, potentially confounding seizure onset localization and interpretation. Without the shadows, this type of electrode can be identified, but in the 5 cases presented here, it proved less obvious in visual assessments.
Another major advantage to our method is that our technique places physically measured CT electrode positions onto the 3D model, removing the need for manual determination of electrode positions, such as those described in other methods.18,19 Human error is removed from electrode placement measures. This is possible because the electrodes lie outside of postimplantation MRI 3D surface renderings, as opposed to methods that use pregrid MRI scans that result in electrodes lying beneath the brain surface owing to compression effects.
There are disadvantages and limitations to the current algorithm, including the added radiation and cost of a post-implantation CT scan over a plain x-ray (although CT may often be included in routine postcraniotomy care). Others have used plain x-ray images to similar effect. Although less expensive and of lower radiation dose, the projection of x-ray data onto the brain surface requires a vertex point for back projection10 and manually defined landmarks.12 This method ultimately lacks the 3D information required for visualizing foreshortened electrode strips oriented along the x-ray path rather than perpendicular to the x-ray beam, and lacks information for medially located electrodes, both of which are visualized readily with our technique.
Postimplantation MRI also adds cost, but it is necessary to visualize the cortical displacement and flattening that affect electrode position relative to the brain surface. The MRI was gathered within 12 hours of surgery in all patients included in this analysis. However, because the costs of these additional MRI scans is not negligible, our group has more recently resorted to collecting the additional MRI the day before resective surgery with the addition of fiducial scalp markers for use in both intraoperative surgical navigation (Stealth Station, Medtronic Corp, Minneapolis, Minnesota) and 3D electrode position modeling. We noticed no adverse processing effects from waiting additional time to acquire the MRI (data on such patients not shown). We also more recently collected the CT data without a gantry angle (similar to patient S4) to reduce interpolation errors.
The cortical surfaces produced by Freesurfer can be mildly degraded by the metallic susceptibility artifacts in the MR images. However, the Freesurfer cortical models are far superior to those produced using 3D volume rendering of gray matter boundaries revealed by skull stripping alone (Figure 5). Freesurfer can sometimes require manual edits to skull stripping to prevent surface imperfections typically caused by metallic susceptibility artifacts or complex extraparenchymal fluid collections. This is the only potential manual step in our algorithm, and can typically be remedied by use of the automated BET tool (FMRIB tool library). It should be noted that the time of Freesurfer processing is greatly affected by poor skull stripping, because more topological corrections need to be applied in the final surface creation. In 2 cases (S2 and S3) time was limited between grid placement and follow-up surgery. The BET tool was used to improve skull stripping, reducing defects Freesurfer would later have to correct, and the processing was limited to only the hemisphere bearing electrodes. This reduced processing time to approximately 8 to 10 hours.
Qualitative validation of the 3D models was done using photographic representations of the reopened craniotomy field because photographic registration is currently one of the standard means of electrode localization.10,18,19 One major concern was that the 3D surface model of the brain might resemble cortex upon inspection on a computer screen, but not fully represent the actual cortical anatomy upon inspection of the operative field, owing to mislabeling of cortex in the Freesurfer model caused by electrode susceptibility or other defects. The yellow lines placed on both the 3D models and the photos in Figure 3 show the qualitative accuracy of the 3D reconstruction in depicting the underlying anatomy at surgery.
Special care was taken to ensure that the electrodes stayed in the same position on the surface of the cortex during surgical reopening, but this validation method has significant disadvantages because the electrodes were photographed in the decompressed state. This allowed for a qualitative comparison of electrode placement along the cortical surface between our 3D model and the photographic images. We therefore examined and compared the electrode’s relative position in comparison with cortical anatomy, paying close attention to sulcal-straddling electrodes, whose position could potentially confound interpretation of recorded iEEG signals. Photographic comparison also verified qualitatively that the electrodes had not moved relative to the cortical surface during the different stages of seizure monitoring and craniotomy reopening.
The main strength of our 3D modeling technique is that electrodes are visualized in the compressed state where they rest during inpatient monitoring. Because compression is relieved at the time of reopening, quantitative validation of electrode positions is fundamentally impossible with photography alone. Future studies could potentially compare leading techniques of quantitative electrode localization such as those described in Dalal, Miller, Kovalev, and Mahvash.10–12,19 In addition, measurements of electrode shift at several time points throughout the duration of video-iEEG monitoring are needed to evaluate reliability and temporal stability of 3D models as opposed to photographic (or other) data obtained at a single time point. Changes in position caused by removal of bandages and other activities of daily living may cause additional variance in measurements of electrode position. This type of measurement would be possible with additional CT and MR imaging before resection. Our 3D models could also be verified using intra-operative navigational techniques, comparing modeled electrode position to that physically measured at the time of resection. This method, however, would be analogous to the photographic validation previously discussed and subject to the same disadvantages. Therefore, it may be more intuitive to use intraoperative navigation to measure electrode shifts along the cortical surface between measurements in the compressed and subsequent decompressed states. Finally, a quantitative study formally comparing cost functions when coregistering postgrid MRI and CT data should be done for optimization and validation.
The technique described here provides several advances in subdural electrode localization and 3D modeling. For the first time, we demonstrate the reconstruction and rendering of cortical brain models by use of MRI acquired after electrodes have been placed on the brain. This accounts for cortical compression and brain shift caused by surgery and electrode grids, never previously addressed. Our technique also allows visualization of medially placed electrodes, because individual hemispheres are modeled separately. We also demonstrate the ability to detect sulcal-straddling electrodes before resective surgery, allowing for more accurate surgical strategizing and planning. We expect that this new 3D modeling technique will allow epileptologists and neurosurgeons to more precisely determine resective margins of epileptic zones, and subsequently increase success rates in surgical intervention. This technique may also provide the level of accuracy required for source modeling of iEEG data,30,31 both in research and potential clinical applications.
Acknowledgments
Special thanks to Linda Allen, BSN, RN, Sonia Neuberger, PA-C, for administrative support, Dr Sean Lew, MD, for helpful conversations, and to the patients who chose to participate in this study.
ABBREVIATIONS
- iEEG
intracranial electroencephalography
- SPGR
spoiled gradient echo
Footnotes
Disclosure
The authors have no personal financial or institutional interest in any of the drugs, materials, or devices described in this article.
References
- 1.Luders H, Awad I, Burgess R, Wyllie E, Van Ness P. Subdural electrodes in the presurgical evaluation for surgery of epilepsy. Epilepsy Res Suppl. 1992;5(suppl):147–156. [PubMed] [Google Scholar]
- 2.Engel J, Jr, Henry TR, Risinger MW, et al. Presurgical evaluation for partial epilepsy: relative contributions of chronic depth-electrode recordings versus FDG-PET and scalp-sphenoidal ictal EEG. Neurology. 1990;40(11):1670–1677. doi: 10.1212/wnl.40.11.1670. [DOI] [PubMed] [Google Scholar]
- 3.Jayakar P, Duchowny M, Resnick TJ. Subdural monitoring in the evaluation of children for epilepsy surgery. J Child Neurol. 1994;9(Suppl 2):61–66. [PubMed] [Google Scholar]
- 4.Behrens E, Zentner J, van Roost D, Hufnagel A, Elger CE, Schramm J. Subdural and depth electrodes in the presurgical evaluation of epilepsy. Acta Neurochir (Wien) 1994;128(1–4):84–87. doi: 10.1007/BF01400656. [DOI] [PubMed] [Google Scholar]
- 5.Luders H, Lesser RP, Dinner DS, Hahn JF, Salanga V, Morris HH. The second sensory area in humans: evoked potential and electrical stimulation studies. Ann Neurol. 1985;17(2):177–184. doi: 10.1002/ana.410170212. [DOI] [PubMed] [Google Scholar]
- 6.Lesser RP, Luders H, Klem G, et al. Extraoperative cortical functional localization in patients with epilepsy. J Clin Neurophysiol. 1987;4(1):27–53. doi: 10.1097/00004691-198701000-00003. [DOI] [PubMed] [Google Scholar]
- 7.Silberbusch MA, Rothman MI, Bergey GK, Zoarski GH, Zagardo MT. Subdural grid implantation for intracranial EEG recording: CT and MR appearance. AJNR Am J Neuroradiol. 1998;19(6):1089–1093. [PMC free article] [PubMed] [Google Scholar]
- 8.Bootsveld K, Traber F, Kaiser WA, et al. Intracranial ECoG electrodes. Location determination using three-dimensional reconstruction of MR data of the brain as a component of the presurgical diagnosis of epilepsy. Radiologe. 1993;33(4):185–188. [PubMed] [Google Scholar]
- 9.Winkler PA, Vollmar C, Krishnan KG, Pfluger T, Bruckmann H, Noachtar S. Usefulness of 3-D reconstructed images of the human cerebral cortex for localization of subdural electrodes in epilepsy surgery. Epilepsy Res. 2000;41(2):169–178. doi: 10.1016/s0920-1211(00)00137-6. [DOI] [PubMed] [Google Scholar]
- 10.Dalal SS, Edwards E, Kirsch HE, Barbaro NM, Knight RT, Nagarajan SS. Localization of neurosurgically implanted electrodes via photograph-MRI-radiograph coregistration. J Neurosci Methods. 2008;174(1):106–115. doi: 10.1016/j.jneumeth.2008.06.02. [DOI] [PMC free article] [PubMed] [Google Scholar]
- 11.Kovalev D, Spreer J, Honegger J, Zentner J, Schulze-Bonhage A, Huppertz HJ. Rapid and fully automated visualization of subdural electrodes in the presurgical evaluation of epilepsy patients. AJNR Am J Neuroradiol. 2005;26(5):1078–1083. [PMC free article] [PubMed] [Google Scholar]
- 12.Miller KJ, Makeig S, Hebb AO, Rao RP, denNijs M, Ojemann JG. Cortical electrode localization from X-rays and simple mapping for electrocorticographic research: The “Location on Cortex” (LOC) package for MATLAB. J Neurosci Methods. 2007;162(1–2):303–308. doi: 10.1016/j.jneumeth.2007.01.019. [DOI] [PubMed] [Google Scholar]
- 13.Schulze-Bonhage AH, Huppertz HJ, Comeau RM, Honegger JB, Spreer JM, Zentner JK. Visualization of subdural strip and grid electrodes using curvilinear reformatting of 3D MR imaging data sets. AJNR Am J Neuroradiol. 2002;23(3):400–403. [PMC free article] [PubMed] [Google Scholar]
- 14.Nelles M, Koenig R, Kandyba J, Schaller C, Urbach H. Fusion of MRI and CT with subdural grid electrodes. Zentralbl Neurochir. 2004;65(4):174–179. doi: 10.1055/s-2004-820354. [DOI] [PubMed] [Google Scholar]
- 15.Tao JX, Hawes-Ebersole S, Baldwin M, Shah S, Erickson RK, Ebersole JS. The accuracy and reliability of 3D CT/MRI co-registration in planning epilepsy surgery. Clin Neurophysiol. 2009;120(4):748–753. doi: 10.1016/j.clinph.2009.02.002. [DOI] [PubMed] [Google Scholar]
- 16.Grzeszczuk R, Tan KK, Levin DN, et al. Retrospective fusion of radiographic and MR data for localization of subdural electrodes. J Comput Assist Tomogr. 1992;16(5):764–773. doi: 10.1097/00004728-199209000-00018. [DOI] [PubMed] [Google Scholar]
- 17.Morris K, O’Brien TJ, Cook MJ, Murphy M, Bowden SC. A computer-generated stereotactic “Virtual Subdural Grid” to guide resective epilepsy surgery. AJNR Am J Neuroradiol. 2004;25(1):77–83. [PMC free article] [PubMed] [Google Scholar]
- 18.Wellmer J, von Oertzen J, Schaller C, et al. Digital photography and 3D MRI-based multimodal imaging for individualized planning of resective neocortical epilepsy surgery. Epilepsia. 2002;43(12):1543–1550. doi: 10.1046/j.1528-1157.2002.30002.x. [DOI] [PubMed] [Google Scholar]
- 19.Mahvash M, Konig R, Wellmer J, Urbach H, Meyer B, Schaller K. Coregistration of digital photography of the human cortex and cranial magnetic resonance imaging for visualization of subdural electrodes in epilepsy surgery. Neurosurgery. 2007;61(5 suppl 2):340–344. doi: 10.1227/01.neu.0000303992.87987.17. discussion 344–345. [DOI] [PubMed] [Google Scholar]
- 20.Eross L, Bago AG, Entz L, et al. Neuronavigation and fluoroscopy-assisted subdural strip electrode positioning: a simple method to increase intraoperative accuracy of strip localization in epilepsy surgery. J Neurosurg. 2009;110(2):327–331. doi: 10.3171/2008.6.JNS17611. [DOI] [PubMed] [Google Scholar]
- 21.Miyagi Y, Shima F, Sasaki T. Brain shift: an error factor during implantation of deep brain stimulation electrodes. J Neurosurg. 2007;107(5):989–997. doi: 10.3171/JNS-07/11/0989. [DOI] [PubMed] [Google Scholar]
- 22.Roberts DW, Hartov A, Kennedy FE, Miga MI, Paulsen KD. Intraoperative brain shift and deformation: a quantitative analysis of cortical displacement in 28 cases. Neurosurgery. 1998;43(4):749–758. doi: 10.1097/00006123-199810000-00010. discussion 758–760. [DOI] [PubMed] [Google Scholar]
- 23.Hill DL, Maurer CR, Jr, Maciunas RJ, Barwise JA, Fitzpatrick JM, Wang MY. Measurement of intraoperative brain surface deformation under a craniotomy. Neurosurgery. 1998;43(3):514–526. doi: 10.1097/00006123-199809000-00066. discussion 527–528. [DOI] [PubMed] [Google Scholar]
- 24.Hunter JD, Hanan DM, Singer BF, et al. Locating chronically implanted subdural electrodes using surface reconstruction. Clin Neurophysiol. 2005;116(8):1984–1987. doi: 10.1016/j.clinph.2005.03.027. [DOI] [PubMed] [Google Scholar]
- 25.Dale AM, Fischl B, Sereno MI. Cortical surface-based analysis. I. Segmentation and surface reconstruction. Neuroimage. 1999;9(2):179–194. doi: 10.1006/nimg.1998.0395. [DOI] [PubMed] [Google Scholar]
- 26.Fischl B, Sereno MI, Dale AM. Cortical surface-based analysis. II: Inflation, flattening, and a surface-based coordinate system. Neuroimage. 1999;9(2):195–207. doi: 10.1006/nimg.1998.0396. [DOI] [PubMed] [Google Scholar]
- 27.Fischl B, Salat DH, Busa E, et al. Whole brain segmentation: automated labeling of neuroanatomical structures in the human brain. Neuron. 2002;33(3):341–355. doi: 10.1016/s0896-6273(02)00569-x. [DOI] [PubMed] [Google Scholar]
- 28.Robb RA, Hanson DP, Karwoski RA, Larson AG, Workman EL, Stacy MC. Analyze: a comprehensive, operator-interactive software package for multidimensional medical image display and analysis. Comput Med Imaging Graph. 1989;13(6):433–454. doi: 10.1016/0895-6111(89)90285-1. [DOI] [PubMed] [Google Scholar]
- 29.Butson CR, Cooper SE, Henderson JM, McIntyre CC. Patient-specific analysis of the volume of tissue activated during deep brain stimulation. Neuroimage. 2007;34(2):661–670. doi: 10.1016/j.neuroimage.2006.09.034. [DOI] [PMC free article] [PubMed] [Google Scholar]
- 30.Fuchs M, Wagner M, Kastner J. Development of volume conductor and source models to localize epileptic foci. J Clin Neurophysiol. 2007;24(2):101–119. doi: 10.1097/WNP.0b013e318038fb3e. [DOI] [PubMed] [Google Scholar]
- 31.Zhang Y, van Drongelen W, Kohrman M, He B. Three-dimensional brain current source reconstruction from intra-cranial ECoG recordings. Neuroimage. 2008;42(2):683–695. doi: 10.1016/j.neuroimage.2008.04.263. [DOI] [PMC free article] [PubMed] [Google Scholar]