Abstract
Cardiovascular simulations using patient-specific geometries can help researchers understand the mechanical behavior of the heart under different loading or disease conditions. However, to replicate the regional mechanics of the heart accurately, both the nonlinear passive and active material properties must be estimated reliably. In this paper, automated methods were used to determine passive material properties while simultaneously computing the unloaded reference geometry of the ventricles for stress analysis. Two different approaches were used to model systole. In the first, a physiologically-based active contraction model [1] coupled to a hemodynamic three-element Windkessel model of the circulation was used to simulate ventricular ejection. In the second, developed active tension was directly adjusted to match ventricular volumes at end-systole while prescribing the known end-systolic pressure. These methods were tested in four normal dogs using the data provided for the LV mechanics challenge [2]. The resulting end-diastolic and end-systolic geometry from the simulation were compared with measured image data.
Keywords: Finite Element Method, mesh generation, parameter estimation, unloaded geometry
1 Introduction
Cardiovascular simulations using patient-specific geometries of the ventricles are now possible with advances in computational modeling and medical imaging [3–8]. Such simulations can help researchers understand the mechanical behavior of the heart under different loading or disease conditions. However, to replicate the regional mechanics of the heart accurately, both the passive hyperelastic properties and the active tension developed during systole in the myocardium have to be correctly determined.
Using mathematical simulations of the cardiac cycle, it is possible to reverse engineer the mechanical properties of the heart by comparing the simulated material point displacements to image data. In this paper, we describe methods by which the passive material properties and the active systolic properties of the left ventricle can be optimized with the help of global ventricular measures such as cavity pressure and volume. High-resolution MRI data from four normal dogs, contributed from the National Institutes of Health [2] defining the LV epicardial and endocardial surfaces, and muscle fiber orientations derived from ex-vivo diffusion tensor MRI and registered to the in-vivo geometry were used to test the models.
One of the requirements to determine regional material displacements accurately is a good estimate of the unloaded ventricular geometry for use as the stress-free reference state. Images obtained from animals or patients in vivo are always in some state of mechanical loading during the cardiac cycle. The geometry obtained at diastasis is also not stress-free since the cardiac pressure is not zero, and diastolic strains are near maximal. In this paper, we calculate the unloaded state from end-diastolic ventricular geometry making use of the pressure and volume measurements between diastasis and end-diastole, using the method developed by Krishnamurthy, et al. [9]. The resting material properties of the myocardium [10] and the unloaded geometry are optimized simultaneously to match the filling curve between diastasis and end-diastole.
To model the active contractile properties of the myocardium, we compared two different approaches. In the first method, the active contractile model of the ventricle was coupled to a three-element Windkessel model of the systemic arterial circulation. The parameters of a Hill-type contractile model [1] and the circulation model were adjusted to obtain ventricular systolic pressure and volume time-courses that are similar to the ones measured by cardiac catheterization. In the second method, the active forces developed were directly adjusted such that the ventricular volume in the model matches the measured end-systolic volume, at prescribed end-systolic pressure. The resulting end-systolic geometry from the model was then compared with the measured geometry at end-systole.
2 Methods
We make use of a cubic-Hermite finite element method to model the left ventricle of the dogs [11]. The finite element mesh is constructed from the surface data at end-diastole. A hyper-elastic constitutive relation [10] is used for the resting properties of the myocardium. In this section, we explain some of the methods that were developed to construct the geometric mesh and to estimate the material parameters of the model.
2.1 Geometry Fitting
To perform biomechanics simulations, a cubic-Hermite finite element mesh that matches the geometry of the left ventricle is constructed. The surface mesh for the epicardium and the endocardium are constructed by sampling points from the input data cloud (Fig. 1A). The surfaces are then fit to reduce the projected error between the data points and the mesh surfaces (Fig. 1C). Once the surfaces are fit separately, they are automatically combined to construct a linear hexahedral finite element mesh (Fig. 1D). This mesh is then successively subdivided twice (Fig. 1E, F) using the methods outlined in [12, 13], to estimate the cubic Hermite derivatives at the nodes. Finally, the 3D cubic-Hermite finite element mesh consisting of 28 elements and 66 nodes (1584 degrees of freedom) is constructed using the estimated derivatives (Fig. 1G).
Fig. 1.
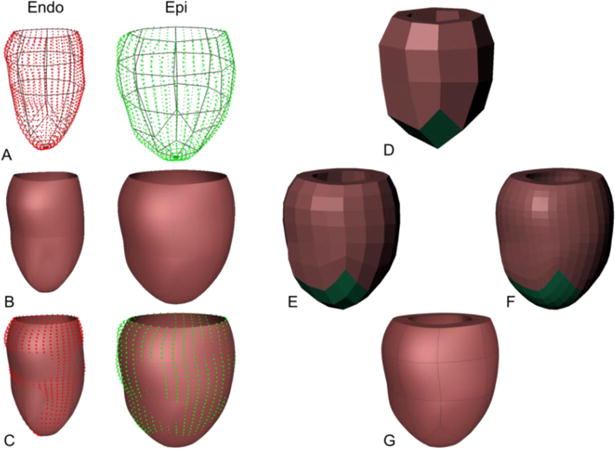
Hexahedral mesh generation from input data. A linear surface mesh (A) is constructed separately for epicardial and endocardial data and is fitted to match the contours (B, C). A linear Hexahedral mesh is constructed from the surface meshes (D) and is subdivided twice (E, F) to obtain the final cubic-Hermite Hexahedral finite-element mesh (G).
2.2 Fiber Fitting
Canine myofiber vectors computed from diffusion-tensor MRI (DT-MRI), and registered to the geometry at diastasis were provided. This data is used to perform a volumetric fit to estimate the components of the fiber vector at the nodes of the finite element mesh. The cubic-Hermite finite element mesh at diastasis was constructed using the geometry fitting methods explained above from the diastasis surface data. Once this data is fitted to the dog ventricular geometry, it is interpolated using a log-Euclidean framework to estimate the fiber orientations within each element of the mesh (Fig. 2).
Fig. 2.
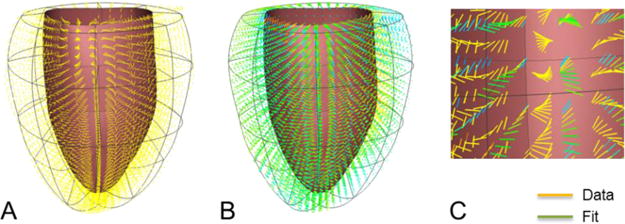
Fiber orientation data from DT-MRI (A) registered to the geometry at diastasis. Diffusion tensors were fitted and interpolated using log-Euclidian metric (B). Comparison between the data and the fit (C) in a region of the ventricular mesh.
Orthogonal fiber, sheet, and sheet-normal vector components were interpolated throughout the ventricular geometry using a log Euclidean framework [9, 14]. Imbrication (transverse) and sheet angles were prescribed to be zero (the sheet and sheet-normal vectors are normal and tangent to the local epicardial and endocardial surfaces, respectively). The vectors corresponding to the sheet and sheet-normal directions were then computed from the fiber vector provided. A synthetic Euclidean diffusion tensor was constructed for each data point using the three orthogonal vectors and generic eigenvalues. The symmetric matrix logarithms of the synthetic diffusion tensors were computed, and the resulting six independent components of the log Euclidean tensors were interpolated between the nodes by performing a trilinear least squares fit of the nodal parameters. During simulations, the fiber, sheet, and sheet-normal vector components were obtained by taking the matrix exponential of the fitted log tensor components and computing the eigenvectors of the resulting Euclidean tensor at each Gauss point.
2.3 Passive Material Properties and Unloaded Geometry
The in-vivo images are necessarily obtained in a loaded configuration of the heart; often end-diastole or diastasis. However, an unloaded reference state is required to compute the stresses and strains correctly. This unloaded geometry, when loaded to the measured end-diastolic pressure, will deform to the measured end-diastolic geometry. Previous studies have used some simplifying assumptions for the unloaded geometry; these include using the end-systolic [15] or mid-diastolic [16] geometry as the unloaded state. Rajagopal, et al. [17] developed a method to estimate the unloaded geometry of human breasts that has been applied to heart modeling [18]. We make use of the method developed by Krishnamurthy, et al. [9], to estimate the unloaded geometry together with the passive material parameters.
The transversely-isotropic form of the constitutive model developed by Holzapfel and Ogden [10] is used to model the passive properties of the myocardium, In this model, the anisotropy in the fiber and cross-fiber directions of the myocardium is modeled using a separate exponential term with different exponents (Eq. 1). The first term (with scaling parameter a and exponent b) corresponds to the isotropic material properties of the tissue, while the second term (with scaling parameter af and exponent bf) corresponds to the fiber direction passive properties.
| (1) |
In, Eq. 1, I1 corresponds to the first invariant of the right Cauchy-Green strain tensor, I4f corresponds to the components of the right Cauchy-Green strain tensor in the fiber direction. The default parameters of the model were fitted to match the biaxial tests [19] and the shear tests [20] of ex-vivo canine myocardial tissue. In the material parameter estimation, the ratio of the pressure scaling coefficients and the exponents were kept constant (same value as default) so as to maintain the anisotropy. This assumption results in two independent parameters that need to be adjusted to match the pressure-volume curve measured from diastasis to end-diastole.
2.4 Active Material Properties
We used two different methods to model systolic contraction in the ventricles. The first method makes use of a physiologically-based muscle contraction model [1] with length-tension and force-velocity relationships. It is coupled to a three-element Windkessel model to simulate ventricular ejection. The second method makes use of directly changing the active tension developed in the muscle to match the measured end-systolic ventricular volume while applying the measured end-systolic pressure as a boundary condition. In both methods, the active tension model used is transversely isotropic. The transverse direction active force was specified to be 70% of the fiber direction active force.
To determine the contractile parameters for the first method, the finite element model was iso-volumically contracted by activating the fibers and the resulting pressure time-course was compared with the measured catheter pressures. The parameters of the contractile model, specifically the active stress scaling coefficient (SfAct), activation rise time (tR), and activation decay time (tD), were adjusted to match the peak systolic pressure, dP/dtmax, and dP/dtmin respectively. The basal boundary conditions were not explicitly specified since the displacements at different time points of the cardiac cycle is not known. The finite element model was then coupled to the Windkessel model [21], whose parameters were then adjusted to match the volume time-course.
In the second method, the finite element model is first passively inflated to the end-systolic pressure. The active tension is then increased slowly in steps until the volume of the ventricle contracts to match the measured end-systolic volume. In addition, the basal epicardial displacements at end systole were directly specified from the available data. The resulting geometry is then used as the end-systolic geometry for comparison. This process can be repeated for each measured pressure and volume point pair in the cardiac cycle and the time-course of the active tension can be obtained. Thus, the time-varying elastance of the ventricles for the entire cardiac cycle can be estimated.
3 Results
The end-diastolic finite element mesh for each dog was fitted from the surface data clouds. This geometry was then used to estimate the unloaded reference geometry. The maximum RMS error between the fitted surfaces and the data points for different dogs is ~0.6mm.
The patient-specific parameters of the constitutive model were estimated together with the unloaded geometry. The estimated passive parameters are given in Table 2. The match between the simulated filling curves and the measured pressure-volume curves between diastasis and end-diastole is within 5% (Fig. 3). The pressure curve for dog D0917 was shifted up by 0.09kPa to make the pressure at diastasis zero.
Table 2.
Passive material parameters for the Ogden-Holzapfel constitutive relation.
| a | af | b | bf | |
|---|---|---|---|---|
| D0912 | 0.760 | 0.560 | 9.726 | 15.779 |
| D0917 | 0.988 | 0.728 | 14.589 | 23.669 |
| D1017 | 0.988 | 0.728 | 14.589 | 23.669 |
| D1024 | 0.760 | 0.560 | 19.452 | 31.558 |
Fig. 3.
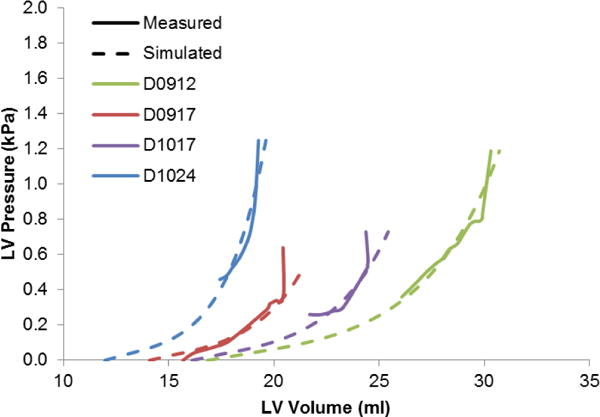
Passive filling curves corresponding to the four different dogs along with their pressure-volume relation between diastasis and end-diastole. The unloaded volume varies depending on the stiffness of the ventricles for the individual dogs.
The pressure and volume time-course for one of the dogs (D0912) is within 10% of their respective values using the first method of systolic contraction coupled to a Windkessel model (Fig. 4).
Fig. 4.
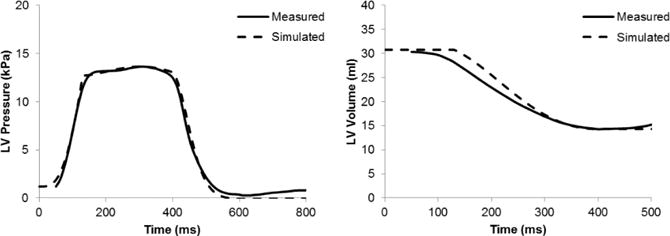
Pressure and volume time courses during systole for one of the dogs (D0912). The active tension and the circulation parameters were adjusted to match these time-courses.
The end-systolic geometry from the two different systolic loading methods was compared to the geometry obtained from fitting the surfaces to end-systolic image data (Fig. 6). The epicardial and endocardial surfaces were within 10% of the measured data, with maximum deviation near the base for the method using the circulation model since the basal displacements were not specified. For the method where the displacements were specified the deviations from the surface were smaller at the base. The end-systolic volumes for the cavity and wall obtained from the two different methods are within 10% of the measured data (Table 3).
Fig. 6.

End-systolic geometries for one dog (D0912) obtained from measured surfaces (A), from simulation using the circulation model (B), from simulation using prescribed pressure and volume (C).
Table 3.
Comparison of end-systolic volume between the different methods.
| End-Systolic Volume (ml) | Measured | Circulation Model | Prescribed Pressure |
|---|---|---|---|
| LV Cavity | 14.1 | 15.3 | 14.3 |
| LV Wall | 42.3 | 40.4 | 38.5 |
The fiber stresses at end-diastole (Fig. 7) and end-systole (Fig. 8) were computed by applying the appropriate pressure boundary conditions to the respective equilibrium geometries. The box-plots show the stress distribution with the 25th, 50th and 75th percentile shown as horizontal lines within the respective boxes. The resulting stress distribution shows that the fiber stresses are less than 3kPa at end-diastole similar to values of circumferential stress in a cylindrical pressure vessel of similar thickness and diameter at end-diastolic internal pressure. The fiber stresses at end-systole are higher due to active stresses generated by the myocardium that cause the contraction.
Fig. 7.
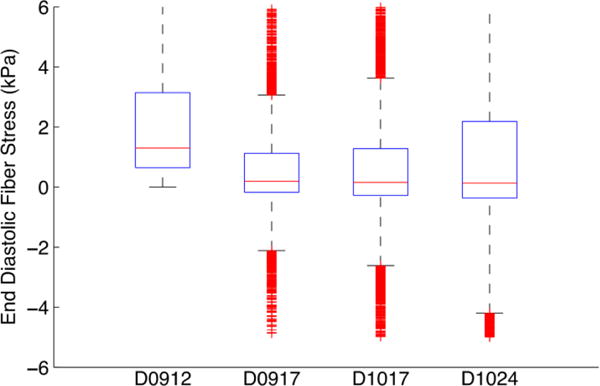
Box plot of end diastolic fiber stress distribution for the 4 dogs.
Fig. 8.
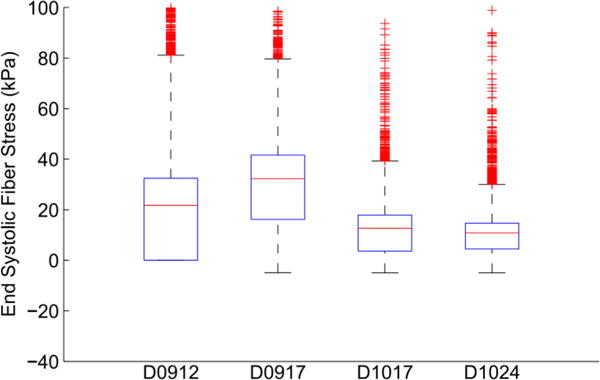
Box plot of end systolic fiber stress distribution for the 4 dogs.
4 Discussion
In reality, there are residual stresses present in the heart. The numerical method employed (finite elasticity) requires a reference state that is unstressed and unloaded, even in the case when residual stresses would have been included. However, the presence of residual stresses might change the displacements of the material points during systole. This might be one of the reasons for the discrepancy between the model and the measured images.
For passive material parameter estimation, we have assumed that the anisotropy of the material remains the same as it is during bi-axial testing. As a result, we kept the ratio of the stress scaling coefficients to the exponents the same. This reduces the number of parameters to be estimated and improves the confidence in the estimated parameters, especially when only global measurements such as pressure and volume are available. However, with the availability of 3D strain measurements in-vivo, it may be possible to separately estimate each of the parameters using the strain information from the fiber and cross-fiber directions.
For active material parameter estimation, having a physiological active force generation that includes length-tension relationship and the force-velocity relationship for cardiac muscles coupled to a circulation model could provide realistic pressure-volume curves. However, estimating the extra parameters might be difficult without prior knowledge of the behavior of these models. In the presence of pressure and volume data, directly prescribing the active force to obtain a geometry that matches the volume under prescribed pressure boundary conditions might provide a better estimate of the regional material point displacements and the overall contractility of the heart. This might be useful in certain disease conditions when the contractility of the heart changes.
Fig. 5.
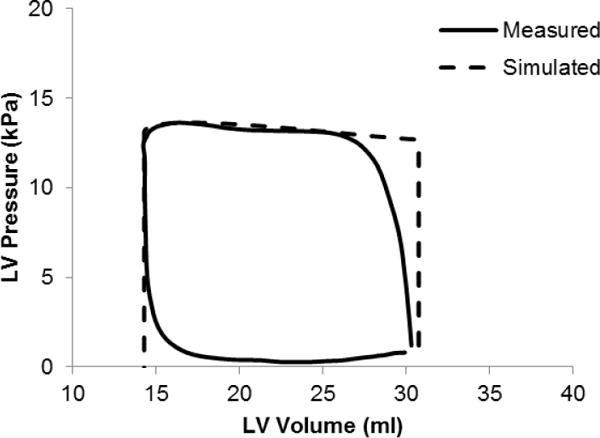
Simulated PV loop using a circulation model during systole compared to the measured data for one of the dogs (D0912).
Table 1.
RMS error (mm) between the surface data point cloud and the fitted surfaces for the different dogs, respectively.
| Endocardial Surface (mm) | Epicardial Surface (mm) | |
|---|---|---|
| D0912 | 0.53 | 0.61 |
| D0917 | 0.48 | 0.48 |
| D1017 | 0.60 | 0.65 |
| D1024 | 0.43 | 0.46 |
Acknowledgments
The methods and simulations in this paper were performed using Continuity 6.4b (r8149). We would like to thank Jeff Van Dorn for providing us with technical support for the software.
References
- 1.Lumens J, Delhaas T, Kirn B, Arts T. Three-wall segment (TriSeg) model describing mechanics and hemodynamics of ventricular interaction. Annals of Biomedical Engineering. 2009;37:2234–2255. doi: 10.1007/s10439-009-9774-2. [DOI] [PMC free article] [PubMed] [Google Scholar]
- 2.Wang VY, Lam HI, Ennis DB, Cowan BR, Young AA, Nash MP. Modelling passive diastolic mechanics with quantitative MRI of cardiac structure and function. Medical image analysis. 2009;13:773–784. doi: 10.1016/j.media.2009.07.006. [DOI] [PMC free article] [PubMed] [Google Scholar]
- 3.Trayanova N. Whole Heart Modeling. Circulation Research. 2011;108:113–128. doi: 10.1161/CIRCRESAHA.110.223610. [DOI] [PMC free article] [PubMed] [Google Scholar]
- 4.Aguado-Sierra J, Krishnamurthy A, Villongco C, Chuang J, Howard E, Gonzales MJ, Omens J, Krummen DE, Narayan S, Kerckhoffs RCP, et al. Progress in Biophysics and Molecular Biology. 2011. Patient-Specific Modeling of Dyssynchronous Heart Failure: A Case Study. [DOI] [PMC free article] [PubMed] [Google Scholar]
- 5.Niederer SA, Plank G, Chinchapatnam P, Ginks M, Lamata P, Rhode KS, Rinaldi CA, Razavi R, Smith NP. Length-dependent tension in the failing heart and the efficacy of cardiac resynchronization therapy. Cardiovascular Research. 2011;89:336–343. doi: 10.1093/cvr/cvq318. [DOI] [PubMed] [Google Scholar]
- 6.Neal ML, Kerckhoffs R. Current progress in patient-specific modeling. Briefings in bioinformatics. 2010;11:111. doi: 10.1093/bib/bbp049. [DOI] [PMC free article] [PubMed] [Google Scholar]
- 7.Lumens J, Blanchard DG, Arts T, Mahmud E, Delhaas T. Left ventricular underfilling and not septal bulging dominates abnormal left ventricular filling hemodynamics in chronic thromboembolic pulmonary hypertension. American Journal of Physiology-Heart and Circulatory Physiology. 2010;299:H1083. doi: 10.1152/ajpheart.00607.2010. [DOI] [PubMed] [Google Scholar]
- 8.Sermesant M, Peyrat JM, Chinchapatnam P, Billet F, Mansi T, Rhode K, Delingette H, Razavi R, Ayache N. Toward patient-specific myocardial models of the heart. Heart Failure Clinics. 2008;4:289–301. doi: 10.1016/j.hfc.2008.02.014. [DOI] [PubMed] [Google Scholar]
- 9.Krishnamurthy A, Villongco CT, Chuang J, Frank LR, Nigam V, Belezzuoli E, Stark P, Krummen DE, Narayan S, Omens JH, McCulloch AD, Kerckhoffs RC. Patient-Specific Models of Cardiac Biomechanics. Journal of computational physics. 2013;244:4–21. doi: 10.1016/j.jcp.2012.09.015. [DOI] [PMC free article] [PubMed] [Google Scholar]
- 10.Holzapfel GA, Ogden RW. Constitutive modelling of passive myocardium: a structurally based framework for material characterization. Philosophical Transactions A. 2009;367:3445. doi: 10.1098/rsta.2009.0091. [DOI] [PubMed] [Google Scholar]
- 11.Costa K, Hunter P, Wayne J, Waldman L, Guccione J, McCulloch A. A three-dimensional finite element method for large elastic deformations of ventricular myocardium: II?prolate spheroidal coordinates. Journal of biomechanical engineering. 1996;118:464. doi: 10.1115/1.2796032. [DOI] [PubMed] [Google Scholar]
- 12.Zhang Y, Liang X, Ma J, Jing Y, Gonzales MJ, Villongco C, Krishnamurthy A, Frank LR, Nigam V, Stark P, Narayan SM, McCulloch AD. An atlas-based geometry pipeline for cardiac Hermite model construction and diffusion tensor reorientation. Medical image analysis. 2012;16:1130–1141. doi: 10.1016/j.media.2012.06.005. [DOI] [PMC free article] [PubMed] [Google Scholar]
- 13.Gonzales MJ, Sturgeon G, Krishnamurthy A, Hake J, Jonas R, Stark P, Rappel WJ, Narayan SM, Zhang Y, Segars WP, McCulloch AD. A three-dimensional finite element model of human atrial anatomy: new methods for cubic Hermite meshes with extraordinary vertices. Medical image analysis. 2013;17:525–537. doi: 10.1016/j.media.2013.03.005. [DOI] [PMC free article] [PubMed] [Google Scholar]
- 14.Arsigny V, Fillard P, Pennec X, Ayache N. Log-Euclidean metrics for fast and simple calculus on diffusion tensors. Magnetic resonance in medicine : official journal of the Society of Magnetic Resonance in Medicine / Society of Magnetic Resonance in Medicine. 2006;56:411–421. doi: 10.1002/mrm.20965. [DOI] [PubMed] [Google Scholar]
- 15.Walker JC, Ratcliffe MB, Zhang P, Wallace AW, Fata B, Hsu EW, Saloner D, Guccione JM. MRI-based finite-element analysis of left ventricular aneurysm. American Journal of Physiology-Heart and Circulatory Physiology. 2005;289:H692. doi: 10.1152/ajpheart.01226.2004. [DOI] [PubMed] [Google Scholar]
- 16.Sermesant M, Razavi R. Personalized Computational Models of the Heart for Cardiac Resynchronization Therapy. Patient-Specific Modeling of the Cardiovascular System. 2010:167–182. [Google Scholar]
- 17.Rajagopal V, Chung J, Nielsen P, Nash M. Finite element modelling of breast biomechanics: directly calculating the reference state; EMBS’06. 28th Annual International Conference of the IEEE; 2006; Engineering in Medicine and Biology Society; 2006. pp. 420–423. [DOI] [PubMed] [Google Scholar]
- 18.Nordsletten DA, Niederer SA, Nash MP, Hunter PJ, Smith NP. Coupling multiphysics models to cardiac mechanics. Progress in Biophysics and Molecular Biology. 2011;104:77–88. doi: 10.1016/j.pbiomolbio.2009.11.001. [DOI] [PubMed] [Google Scholar]
- 19.Yin FCP, Strumpf RK, Chew PH, Zeger SL. Quantification of the mechanical properties of noncontracting canine myocardium under simultaneous biaxial loading. Journal of biomechanics. 1987;20:577–589. doi: 10.1016/0021-9290(87)90279-x. [DOI] [PubMed] [Google Scholar]
- 20.Dokos S, Smaill BH, Young AA, LeGrice IJ. Shear properties of passive ventricular myocardium. American Journal of Physiology-Heart and Circulatory Physiology. 2002;283:H2650. doi: 10.1152/ajpheart.00111.2002. [DOI] [PubMed] [Google Scholar]
- 21.Kerckhoffs RCP, Neal ML, Gu Q, Bassingthwaighte JB, Omens JH, McCulloch AD. Coupling of a 3D finite element model of cardiac ventricular mechanics to lumped systems models of the systemic and pulmonic circulation. Annals of Biomedical Engineering. 2007;35:1–18. doi: 10.1007/s10439-006-9212-7. [DOI] [PMC free article] [PubMed] [Google Scholar]


