

Abstract
The zebrafish has been proposed for modeling fetal alcohol spectrum disorders (FASD). Previous FASD research with zebrafish employed high concentrations of alcohol and/or long exposure periods. Here, we exposed zebrafish eggs to low doses of alcohol (0, 0.25, 0.50, 0.75 and 1.0% (vol/vol); external bath application of which 1/20th may reach the inside of the egg) at 16-h post-fertilization (hpf) and only for a short duration (2 h) in the hope to avoid gross morphological aberrations and to mimic the more frequent FASD exposure levels. Upon reaching adulthood the exposed and control zebrafish were tested for their associative learning performance in a plus-maze. Embryonic alcohol exposure led to no gross anatomical abnormalities and did not increase mortality. Unexposed (control) zebrafish showed excellent acquisition of association between a conditioned visual stimulus (CS) and food reward, demonstrated by their preference for the target zone of the maze that contained the CS during a probe trial in the absence of reward. However, alcohol-exposed fish showed no such preference and performed indistinguishable from random chance. Locomotor activity during training and the probe trial or the amount of food consumed during training did not differ between the embryonic alcohol exposed and unexposed (control) fish, suggesting that the impaired learning performance found was unlikely to be caused by altered motivation or motor function. Our results suggest that even very small amounts of alcohol reaching the embryo for only a short duration of time may have long lasting deleterious effects on cognitive function in vertebrates.
Keywords: Fetal alcohol spectrum disorders, Embryonic alcohol exposure, Zebrafish, Learning impairment
1. Introduction
Prenatal alcohol (ethyl alcohol, ethanol, EtOH) exposure produces a range of symptoms that are collectively labeled under the non-diagnostic umbrella term, fetal alcohol spectrum disorder (FASD) [1]. Fetal alcohol syndrome (FAS), a more specifically defined and severe form of FASD is characterized by craniofacial malformations, growth deficiencies as well as central nervous system (CNS) abnormalities including severe cognitive and/or behavioral impairment [2]. These CNS abnormalities include deficits in intelligence, executive functioning, language, visual-spatial ability, motor function, attention, activity, academic achievement, learning and memory [3]. The prevalence of FAS in the United States is 2.8 per 1000 live births [4]. Alcohol-related neurodevelopmental disorder, or ARND, is another clinical term that describes a symptom cluster associated with prenatal alcohol exposure. Individuals with ARND exhibit cognitive and behavioral problems but lack the physical malformations associated with FAS [5]. While FAS is the most severe outcome of prenatal alcohol exposure, ARND, which is thought to result from only moderate drinking by pregnant women, is more prevalent. Embryonic alcohol exposure induced problems are estimated to affect over 9 out of 1000 children [4,6] and the less severe cases that fall within the category of ARND represent more than two third of these cases. Thus elucidating the mechanisms that underlie the milder forms of fetal alcohol exposure induced problems (i.e. ARND) is of utmost importance. Animal models can significantly aid in this endeavor.
The zebrafish may be an ideal model organism with which the effects of embryonic alcohol exposure may be investigated [7]. One advantage of this species is the simplicity and precision of alcohol delivery. Since the chorion of the egg is somewhat permeable to alcohol [8], alcohol diffuses into the egg bathing the embryo. Thus the complexities associated with intra-uterine environment and maternal physiology inherent in mammalian animal models is absent in zebrafish. The timing of alcohol exposure is also precise. Eggs can be immersed and removed from the alcohol solution at will and thus the initiation and cessation of alcohol exposure can be precisely controlled [9]. A female zebrafish can produce 200 eggs in a single spawning [10] and the eggs are fertilized and develop externally. Thus large number of subjects may be exposed to alcohol treatment in a uniform manner, which is expected to reduce error variation and thus increase statistical power [9].
Behavioral changes caused by embryonic alcohol exposures have not been the primary focus of investigation using zebrafish. Instead, most studies analyzed gross anatomical aberrations and/or gene expression changes induced by high doses of, or extended exposure to alcohol. For example, Arenzana et al. treated zebrafish embryos for approximately 20 h with 0.5% or 2.4% (vol/vol) alcohol and found cyclopia (the fusion of 2 eyes) along with cytoarchitectural abnormalities [11]. Loucks & Ahlgren treated zebrafish embryos with alcohol concentrations ranging from 0.2% up to 2.5% (v/v) from 4.3 h post-fertilization (hpf) up to 24 hpf and reported embryonic alcohol exposure to lead to reduced expression of genes, e.g. that of six3b and gli1, notochord defects and ocular distance abnormalities [12]. After exposing zebrafish embryos to alcohol concentrations ranging from 0.5% to 2.0%, from 6 to 10 hpf, 10–18 hpf, 6–24 hpf, 24–48 hpf, or 48–72 hpf, Zhang et al. reported reduced gene expression in the forebrain and hindbrain of exposed fish [13]. While the analysis of changes induced by larger doses of and longer exposures to alcohol may illuminate mechanisms associated with the most severe forms of human FAS, animal models that recapitulate the changes seen in less severe forms of the disease (e.g. ARND) may be even more important as such cases are more prevalent in the clinic. Cognitive impairment is a characteristic feature of these milder forms of fetal alcohol exposure cases. The abnormalities, which are often life-long, include deficits in intelligence, executive functioning, language, visual-spatial ability, motor function, attention, activity, academic achievement, and learning and memory [3].
In the current study, we investigate, for the first time, the effects of a 2 h long exposure to lower bath concentrations of alcohol (0, 0.25, 0.50, 0.75 or 1%) at 16 h post fertilization. Notably, the concentration of alcohol inside the egg has been found to be approximately 1/20th–1/30th of that of the external bath when using the above dose range [14,15]. Previously, we have found that similar doses of alcohol employed at 24 hpf resulted in no gross anatomical changes or increased mortality and only led to subtle but significant behavioral abnormalities [14]. In the current study, we explore the effect of alcohol when delivered at 16 hpf.
The choice of this developmental stage (the 16th hpf age of the embryo) when alcohol is administered was somewhat arbitrary. Although zebrafish embryonic development (including the development of the brain) is well mapped, the question of how certain developmental stages of zebrafish correspond to human embryonic development is complex. The 16 hpf stage appeared reasonable for us as the time point of manipulation because at this stage the brain has started to form but has not finished developing. For example, the prominent subdivisions of the zebrafish brain, the telencephalon, diencephalon, midbrain and hindbrain have already developed by 16 hpf, and the neural crest migration in the head and trunk is underway [16].
We decided to focus our analysis of the adult zebrafish previously exposed to alcohol during their embryonic development on learning and memory performance to explore possible long lasting consequences of the exposure. We chose our focus to be learning and memory because a prevalent abnormality seen in ARND children has been cognitive deficits associated with impaired attention, learning and memory. For example, Mattson et al. found children with prenatal alcohol exposure to be able to recall fewer words using a word list memory task [17] and later also described both verbal and non-verbal memory impairment [18].
Zebrafish have been increasingly employed to study learning and memory [19]. Zebrafish are highly social and when offered the opportunity under experimental conditions have been found to be motivated to seek out and stay close to their conspecifics [20–23]. This feature of zebrafish has been utilized in learning studies in which the sight of conspecifics has been found to be a salient unconditioned stimulus, a strong motivator [24]. Unfortunately, however, the sight of conspecifics may not be appropriate as a motivator in the current study because previously we found embryonic alcohol exposure to induce significant impairments in the way the treated zebrafish respond to their conspecifics [14,25]. The alcohol treated fish showed reduced preference for staying in close proximity to conspecific images presented on a computer screen [14] or to their shoal mates presented using freely moving live shoals [25]. Although the behavioral mechanism of this impairment is not known, it is likely to represent abnormal social behavior.
To avoid the possible complications arising from this (altered motivation as a confound in our learning study), we decided to train our zebrafish in an associative learning task in which the conditioned stimulus (a visual cue) would be paired with a rewarding stimulus other than the sight of conspecifics. We chose food to be the reinforcement. Zebrafish have been found to be able to learn the association between a visual cue and food reward in the plus maze before but food reward was found to diminish in reward value as the training progressed, presumably because the poikilothermic zebrafish satiated fast [26]. In the present work we employ a similar plus-maze but utilize a modified food reward and modified delivery method that increases delivery efficiency and rewarding value, and also makes the visual cue more salient (see below).
We investigate the effect of embryonic alcohol exposure on the behavior of adult zebrafish in this food rewarded associative learning task using the plus maze and report significant learning performance deficits without alterations in amount of food consumed or in locomotor activity.
2. Methods
2.1. Animals and housing
Sexually mature adult zebrafish of the AB strain were bred at the University of Toronto Missisauga Vivarium (Mississauga, Ontario, Canada) to obtain fertilized eggs. The progenitors of this population were obtained from the ZFIN Center (Eugene, Oregon, USA). AB is one of the most frequently studied zebrafish strains which is often used in forward genetic (mutagenesis) studies [27]. Approximately 240 fertilized eggs were collected 2 h post-fertilization (hpf) and washed with system water; deionized and sterile water supplemented with 60 mg/l Instant Ocean Sea Salt (Big Al’s Pet Store, Mississauga, ON, Canada). At 16 hpf, collected eggs were randomly divided into 5 equal groups, with approximately 40–50 eggs per group.
The low alcohol concentration and short exposure time were chosen to model the low levels and small frequency of drinking more commonly seen during pregnancy that are associated with ARND. Eggs were placed in a container with 100 ml of solution of the corresponding alcohol concentration (0, 0.25, 0.50, 0.75, or 1.00 vol/vol%) for 2 h. The eggs were subsequently washed with system water and maintained in 1.3 L tanks that were part of a nursery rack (Aquaneering Inc., San Diego, CA). Upon hatching, the fry were fed Larval AP 100 (ZeiglerBros. Inc., Gardners, PA). After 3 weeks, zebrafish were moved to 2.8 L rearing tanks (Aquaneering Inc.) placed in a high-density rack system. The system had multistage filtration that contained a mechanical filter, a fluidized glass bed biological filter, an active carbon filter, and a fluorescent UV light-sterilizing unit. Ten percent of the system water was replaced daily. Zebrafish were kept in the system rack until they were 6 months old and ready for testing. Zebrafish were housed in groups of 15 per tank. Each group corresponded to a particular alcohol concentration treatment. Fluorescent light tubes mounted in the ceiling provided illumination. Lights turned on at 08:00 h and off at 21:00 h. While the fish were in the high-density racks, they received a mixture of dried fish food (4 parts of Nelson Silver Cup, Aquaneering Inc. and powered spirulina, 1 part, Jehmco Inc., Lambertville, New Jersey). Sample size (n) for each treatment group including control was 40. Approximately equal numbers of males and females were found in each group. Each group was split into 4 cohorts for testing, which was conducted in a manner blind to and randomized across treatment conditions. One week prior to testing all fish were separated and kept in isolation until the completion of the test, which was necessary for individual identification. Notably, however, this physical isolation did not include visual or olfactory isolation as the experimental fish could see fish in adjacent tanks and could smell each other due to the recirculating water pumped through their tanks. Before training started, each fish was habituated to TetraMin flake food, the reward used in the learning task through regular daily (three times a day) feeding for at least one week.
2.2. Apparatus
The testing apparatus was a 4-arm “plus-maze” made of transparent Plexi-glass similar to what was employed before [26] (Fig. 1). The arms of the maze were 35 cm long × 11 cm wide × 20 cm high. An 11 cm × 11 cm square shaped start box was placed in the center of the maze and it was lifted to start the trial. Each arm of the maze contained a plastic bar mounted on top of the maze in order to support a floating red disk that served as holder of food reward and also as a salient associative cue. Grooves at the end of each arm allowed the insertion of a red cue card. The maze was filled with system water until all four discs floated at equal levels in all arms. The water was maintained at 27 °C. The maze sat on a wooden turntable that allowed rotation of the maze. The maze was rotated randomly across trials (but not during active behavioral recording or training sessions) to make extra-maze spatial cues on the ceiling irrelevant. The bottom of the maze was covered with white corrugated plastic and the maze was surrounded by 121.92 cm × 121.92 cm plywood sheets on each of the four sides to minimize access to extra-maze visual cues for the experimental subject and to reduce disturbance. An overhead digital camera (JVC GZ-MG330HV) recorded all trials, including a probe trial that allowed us to examine the response to the associative cue (CS) alone.
Fig. 1.
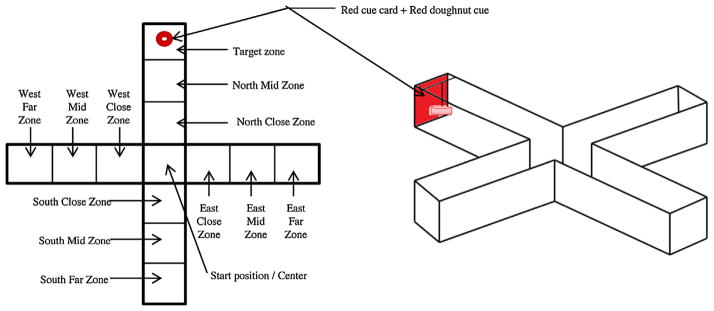
Schematic drawing of the plus maze. Note that the conditioned stimulus (CS) was a red plastic cue card that was positioned at the end of one of the arms (designated arbitrarily as the North arm). Note that in addition to this cue a red floating ring (“doughnut”) was positioned next to the cue card on the surface of the water. This ring served both as a food delivery apparatus (the floating flake food was placed inside the ring) as well as a CS. The maze was divided into imaginary zones and we measured how much time the fish spent in the target zone and also how frequently they entered the target zone and all other zones. For further details on the apparatus and procedure see Section 2. (For interpretation of the references to color in this figure legend, the reader is referred to the web version of the article.)
2.3. Procedure
General procedures
We decided to test learning performance in an appetitive (reward-based) associative learning task using food reward in a plus maze. Although faster learning tasks have been developed [19] the chosen learning task has several advantages including its ability to dissociate performance factors from learning itself and also the fact it is dependent upon reward related mechanisms known to be affected by embryonic alcohol treatment [26]. Furthermore, we also found tasks that employ aversive cues to be less sensitive to detect subtle alterations in learning performance due, perhaps, to increased error variation associated with handling of zebrafish [19]. Zebrafish were deprived of food 24 h prior to testing. During training, experimental fish were fed only when they located the food reward in the maze. Testing started at 13:00 h and finished two hours before the lights turning off, i.e. at 19:00 h, making sure that light cycle changes had minimal effects on the behavior of the experimental subjects. Fish were tested individually in a randomized order according to their concentration group. Cohort 1 and Cohort 2 were tested on alternating days. Subsequently, Cohort 3 and 4 were tested. A single zebrafish was placed in the start box at the center of the maze, and after a 10 s long acclimation period the box was lifted and the fish was released and permitted to explore the maze for a predetermined amount of time, which depended upon the experimental phase (habituation/shaping/training/probe). Specifically, during habituation and shaping, fish spent 30 min in the maze in total, while during testing they spent 20 min. Finally, during the probe trial the fish spent 5 min in the maze. Upon completion of the trial, the fish was removed and the amount of food eaten was estimated (see below). Fish that did not eat over the span of 3 consecutive secessions or for a total of 7 days were removed from the experiment. A total of 20 fish (out of 60) were removed from the experiment for this reason (exactly 4 fish for each treatment group). An additional fish was removed from the 0.50% alcohol treatment group due to excessive immobility. It is notable that zebrafish (and many other species) may remain healthy even if they do not consume food for extended periods of time, but lack of eating may indicate altered motivation and thus it would have interfered with training and learning performance. Notably, the fish removed from the experiment were distributed equally among the treatment groups.
Habituation
Prior to training, all fish were acclimatized to the maze and food reward for four days. The first 2 days consisted of a single 30-min trial, and the last 2 days consisted of two 15-min trials per day. During the habituation phase, a single piece of flake food was placed in each arm of the maze. This arrangement may also be considered part of shaping as it allowed the fish to learn that food rewards may be found in the maze and they may be found at the end of the arm.
Shaping
A shaping procedure was conducted to facilitate the acquisition of the association between the CS and food reward. Shaping consisted of 3 days, and was performed every other day. During shaping day 1, fish were placed in the plus-maze for a single 30-min trial with cues baited with food in all arms. During shaping day 2, fish were placed in the plus-maze twice, each time for 15-min with cues baited with food in three of the four arms of the maze. During shaping day 3, fish were placed in the plus-maze for three occasions, each time for 10-min with cues baited with food in only two out of the four arms. The location of food reward was randomized and the random sequence was determined using a random value generator (www.random.org).
Training
Fish were trained to associate the food reward (TetraMin flake piece) with the two red cues (conditioned stimulus (CS)) for a total of 5 days, a red cue card that was visible from all directions in the maze, and a red doughnut shaped floating ring on the surface of the water that also served as the holder for the TetraMin flake. During training days, each fish received 4 training trials. A trial consisted of a single fish being placed in the plus-maze for the duration of 5 min. During each trial only one arm of the maze contained food reward and the CS. Each fish was trained every other day for 5 days, thus receiving (5 × 4) 20 trials. All training trials were recorded via a digital camera mounted above the testing apparatus.
Perhaps the most important phase of the learning paradigm was the probe trial. It allowed us to evaluate the response of our experimental fish to the CS alone, i.e. whether the fish learned the association between the CS and food reward. During the probe trial a single fish was placed in the plus-maze for 5 min and the red doughnut and red card (CS) were present but no food reward was given. The location of the CS in the maze was randomized between trials for each fish. The overhead digital camera recorded the trials for behavioral analysis.
2.4. Quantification of behavior and statistical analysis
The experimenter was blind as to group designation of the experimental fish and each fish had a coded “name” and its group designation was only known to a person other than the experimenter. The digitally recorded video files were analyzed by a trained individual that was blind to the purpose of the study. The codes were broken after all experimental procedures were completed; data recorded and analyzed. The behavior of experimental zebrafish was quantified using an event recording software application, The Observer XT 9.0 (Noldus, Info Tech., Wageningen, The Netherlands). We divided the plus maze into 13 equal imaginary sections, which we termed “zones”, and recorded the amount of time the subject spent in each zone. We also counted the number of entries into each of these zones. Notably, the number of zone entries counted manually and the distance traveled quantified using video-tracking systems have been found to highly correlate [32]. The amount of food consumed by each fish during each trial was also recorded. The advantage of the employed flake food is that it is clearly visible and palatable for zebrafish; it also floats on the surface of the water and thus could be localized inside the food-dispensing ring. However, the particle size of the food is highly variable and weighing the uneaten (and thus the consumed food too) once the food got in contact with water is not practical. Thus, the amount fish ate was only estimated and scored as follows: a score of 1 was assigned if the presented food was completely consumed; a score of 0.5 was assigned if the food was partially consumed and a score of 0 was assigned if the food was not consumed.
Data were analyzed using SPSS (version 21) for the PC. Parametric statistical tests including variance analyses (ANOVAs) followed by Tukey Honestly Significant Difference (HSD) post hoc multiple comparison tests were performed. We examined the performance of the fish (see below) during the first training day (TD1), the last training day (TD5) and the probe (P). No sex differences or sex × alcohol treatment interactions were found and therefore the data were pooled for sexes for subsequent analyses.
We measured the food eaten to determine whether there was a difference between groups in the level of reward obtained (and thus potentially in the motivation to get the reward). Repeated measures variance analysis (ANOVA) was conducted to investigate whether alcohol (5 concentration groups, between subject factor) affected the amount of food consumed during each experimental day (12 days, the repeated measure within subject factor). To examine whether alcohol affected locomotor activity, we analyzed the total number of entries made into all zones of the maze on three separate days (TD1, TD5 and P) using a repeated measures ANOVA with alcohol (5 concentrations, between subjects variable) and experimental days (3 days, the repeated measure within subject factor) as independent factors. Employing a repeated measure ANOVA we also investigated whether alcohol (5 concentrations, between subjects variable) affected the number of entries made into the target zone during the TD1, TD 5 and P (3 days, the repeated measure within subject factor).
Last, and most importantly, to study the acquisition of associative memory, we measured the percentage of time the experimental fish spent during the probe trial in the target zone, i.e. in the proximity of the CS in the absence of reward. A univariate ANOVA was carried out to examine the effect of alcohol on the percentage of time spent in the target zone during the probe. Finally, one-sample one-tailed t-tests with the Bonferroni correction (α = 0.01) were conducted to examine whether the percentage of time spent in the target zone during the probe trial was above random chance (7.69%). In case of random spatial distribution of the fish, the amount of time fish will spend in the target zone is proportional to the area of the target zone relative to the total area of the maze, and the target zone area was 7.69% of the total area of the maze. Under unrewarded conditions, e.g. during habituation to the test environment in which no reinforcer is placed, we indeed observed fish to show no preference for any particular part of the plus maze [26] (and unpublished observation).
3. Results
The percentage of time spent in the close proximity of the conditioned stimulus during the probe trial (target zone time) appeared to show a robust effect of embryonic alcohol treatment (Fig. 2). Alcohol exposed fish appeared to spend much less time in the target zone compared to control. ANOVA confirmed this observation and demonstrated a significant Alcohol effect (F(4, 34) = 4.28, p < 0.01). Tukey HSD post hoc multiple comparison test showed that control fish spent a significantly (p < 0.05) higher percentage of time in the target zone as compared to fish that were exposed to 0.25%, 0.75% and 1.00% alcohol during their embryonic development, while differences among other groups were found non-significant (p > 0.05). In addition, we also analyzed whether the percentage of time the alcohol treated and control fish spent in the target zone was higher than random chance. To examine this, we conducted one-sample one-tailed t-tests with Bonferroni correction for multiple comparisons, and compared the value of each group to 7.69% (the random chance value expected in case of uniform preference for all areas of the maze). We found that control fish spent significantly higher than chance amount of time in the target zone (t = 4.15, df = 7, p = 0.01) but the performance of fish of all alcohol treatment groups was statistically indistinguishable from random chance (0.25%, t = 1.12, df = 7, p > 0.75; 0.50%, t = 1.22, df = 6, p > 0.65; 0.75%, t = 0.599, df = 7, p > 0.95; 1.00%, t = 0.31, df = 7, p > 0.95).
Fig. 2.

Embryonic alcohol significantly impairs associative learning performance in adult zebrafish. Percentage of time spent in the target zone during the probe trial is shown (mean ± SEM). Sample sizes of groups were as follows: n0 = 8, n0.25% = 8, n0.50% = 7, n0.75% = 8, n1.00% = 8. The solid horizontal line represents random chance level performance. Note that the control (no alcohol exposure) fish performed significantly better than the alcohol exposed fish and also significantly above random chance while the performance of alcohol exposed fish was not statistically distinguishable from random chance. Also note that fish of the different alcohol concentration groups did not significantly differ from each other. For further details and the results of statistical analyses see Results.
The impaired learning performance of the fish exposed to alcohol during their embryonic development may be due to abnormal motivation, e.g. lack of interest to seek out and/or eat the food. However, these possibilities were found unlikely. Fig. 3 shows the estimated amount of food consumed during each experimental day of training. ANOVA found a significant experimental day effect (F(11, 374) = 6.67, p < 0.001), a non-significant experimental day × alcohol interaction, F(44, 374) = 0.83, p > 0.75) and a non-significant Alcohol effect (F(4, 34) = 0.33, p > 0.85) suggesting that although the daily food amount consumed fluctuated, alcohol exposure during embryonic development did not affect how much food the fully grown adult zebrafish ate. It is notable that the amount of food eaten was only estimated in a manner that this variable was categorical in nature. Thus, to confirm the validity of the above parametric analysis, we also conducted two non-parametric tests. First, we studied whether the amount of food eaten fluctuated over days using the Friedman test and found that for most treatment groups it did (0.00% alcohol, χ2 = 36.1, df = 11, p < 0.001; 0.25% alcohol χ2 = 22.8, df = 11, p < 0.05; 0.50% alcohol, χ2 = 15.3, df = 11, p > 0.15; 0.75% alcohol, χ2 = 19.52, df = 11, p > 0.05; 0.00% alcohol, χ2 = 11.5, df = 11, p > 0.40). Next we analyzed whether the alcohol treatment groups differed using the non-parametric Kruskal–Wallis test and found no significant alcohol treatment effect (χ2 = 0.85, df = 4, p > 0.90), results that confirm those of the ANOVA presented above.
Fig. 3.

The estimated amount of food consumed during each training day was not significantly affected by embryonic alcohol exposure. Mean ± SEM are shown. Sample sizes are as indicated in the legend of Fig. 2.
Motivation to explore and seek out the food reward as well as motor function may be examined by measuring the locomotory activity of the fish in the plus maze. We quantified the total number of entries made by the alcohol exposed and control fish into all the zones of the plus maze during the first (day 1) and the last day (day 5) of training as well as during the probe trial (Fig. 4). Repeated measures ANOVA revealed that the number of zone entries significantly varied across experimental days (F(2, 68) = 27.39, p < 0.001), but alcohol did not have a significant overall effect (F(4, 34) = 1.376, p > 0.25) and the experimental day × alcohol interaction term was also non-significant (F(8, 68) = 0.44, p > 0.50) (Fig. 5).
Fig. 4.

Locomotory activity (number of zone entries) did not significantly differ among treatment groups on any day analyzed (first day of training, Training Day 1, last day of training, Training Day 5, and the probe trial). Mean ± SEM are shown. Sample sizes are indicated in Fig. 2.
Fig. 5.

The number of entries to the target zone do not differ among the treatment groups on any day analyzed (first day of training, Training Day 1, last day of training, Training Day 5, and the probe trial). Mean ± SEM are shown. Sample sizes are indicated in Fig. 2.
In addition to the total number of zone entries, we also quantified the number of entries to the target zone (Fig. 4). Repeated measure ANOVA again revealed a significant experimental day effect (F(2, 68) = 12.08, p < 0.001). The main effect of Alcohol (F(4, 34) = 0.50, p > 0.99) and the interaction term experimental day × alcohol was both found non-significant (F(8, 68) = 0.62 p > 0.75).
4. Discussion
The zebrafish has been proposed to be a useful model organism with which the effects of alcohol may be investigated on vertebrate brain function and development [7,10]. An important aspect of animal models of human diseases is face validity, i.e. similar appearance of at least part of the symptoms. This is usually considered the first step in establishing the model, which may eventually allow the establishment of construct validity, i.e. mechanistic similarity between the animal and human disease, and thus better understanding of the human disease via the analysis of the animal model. A hallmark of human ARND is cognitive impairment, which includes diminished capacity to learn and remember without any gross morphological abnormalities [28]. The low alcohol doses administered for only a short period of time during the development of our experimental zebrafish led to no detectable anatomical alterations, did not affect the growth rate of our fish and did not increase their mortality. Importantly, however, similarly to children with ARND [18], zebrafish exposed to alcohol during embryonic development also showed a significant learning performance deficit. These fish did not show any preference to the conditioned stimulus and spent time in the target zone containing this stimulus for a length that was indistinguishable from random chance. However, control fish, i.e. fish that were exposed to freshwater instead of alcohol during development, developed a robust preference for the conditioned stimulus. These fish spent time in the target zone containing this stimulus that was significantly above chance and significantly higher than the alcohol treated fish. Given that all experimental fish, including alcohol treated and control, were experimentally manipulated, raised and tested in a blind and fully randomized manner and under identical conditions in the same holding and testing rooms, we conclude that the demonstrated performance deficit was due to the alcohol treatment.
Does this deficit represent learning impairment or could it be due to factors other than learning and/or memory? At this point the answer to this question is speculative. For example, the learning performance deficit found in the alcohol treated fish may be due to motor impairment, deficient motivation, and/or alterations in the visual system. Embryonic alcohol has been found to affect all of these factors [29,30].
Although possible, we suggest that the effect of these above factors is unlikely. Our results show, for example, that fish of the different alcohol treatment groups did not differ in the amount of food they consumed. We therefore argue that the motivation to eat the food and the rewarding value of the unconditioned stimulus did not differ among our treatment groups. We also found that the number of entries to the zones of the maze did not differ among our fish and thus conclude that motor function, as well as the exploratory drive of the experimental fish also did not differ across the treatment groups. Furthermore, we found the number of entries to the target zone also not to significantly differ among the treatment groups and thus again conclude that the motivation to explore or the ability to get to the end zone (target) of the maze did not differ among the treatment groups. The last factor we consider potentially important, vision, we did not independently measure, and also we do not have indirect data that would allow us to explore whether this perceptual modality may be impaired in our alcohol exposed fish. The development of the visual system is known to be affected by exposure to high alcohol doses during ontogenesis [30,31]. Nevertheless, at the doses and exposure length we employed alcohol was found not to impair a response to visual stimuli (the sight of conspecifics) [14]. Notably, these stimuli (moving life-sized images of zebrafish) employed previously required much better visual acuity than the large red cue card and floating red ring we employed as conditioned stimuli in the current study. Thus we propose that it is unlikely a putative visual impairment may explain the observed learning performance deficit. It is more likely that this deficit is indeed due to impaired learning and/or memory broadly defined. What aspect of learning and/or memory may be affected is unknown at this point. Future research will explore whether attentional processes, acquisition, consolidation, retention and/or recall of memory may be altered by the embryonic alcohol exposure we employed in zebrafish.
It is also notable that exposure to different concentrations of alcohol led to performance impairment that was statistically indistinguishable among the different alcohol concentration groups. We obtained a flat dose response curve. This result shows that alcohol reaching the embryo at even the lowest concentration (0.25% × 1/20) had a robust and maximal effect. It is thus likely that even lower doses may have deleterious consequences on learning and/or memory performance, a point that begs the question of what may be the highest safe dose of alcohol, if any. It is also notable that in a previous study [14], in which we investigated the effect of the same alcohol doses on social behavior, we found not a flat but a linear dose dependent response relationship. The difference between our present and prior results could be due to the studied behavioral phenomena. It is possible that social behavior is more robust and requires higher doses of alcohol to become significantly impaired. Cognitive functions such as learning and memory may be more sensitive and thus may show strong alcohol effects even at lower doses. Alternatively, it is also possible that the timing of exposure makes a difference: at 16 hpf alcohol’s effects may be more devastating and even very small doses (0.25% or less, external bath concentration) lead to robust changes, whereas at 24 hpf only higher doses (0.75% or higher external bath concentration) have impairing effects, possibilities that will be distinguished in the future.
In summary, our current results suggest that even very low concentrations of alcohol reaching the vertebrate embryo for only a short duration of time may have long lasting significant negative consequences on cognitive function. Although at the earliest stages of zebrafish ARND model development, our current and previous results [14,15] coupled with the increasingly powerful recombinant DNA technologies developed for this species imply that zebrafish may become an excellent investigational tool with which the mechanisms underlying human ARND may be analyzed.
HIGHLIGHTS.
Zebrafish embryos exposed to low alcohol concentrations were tested when adult.
Embryonic alcohol exposed zebrafish exhibited no gross anatomical abnormalities.
Associative learning performance of embryonic alcohol exposed fish was impaired.
Motor function and food consumption of the alcohol exposed fish were unaffected.
Even small amount of alcohol reaching the embryo leads to lasting cognitive deficit.
References
- 1.Stratton KR, Howe CJ, Battaglia FC. Fetal alcohol syndrome: diagnosis, epidemiology, prevention, and treatment. Institute of Medicine (U.S.), Division of Biobehavioral Sciences and Mental Disorders, Committee to Study Fetal Alcohol Syndrome, National Institute on Alcohol Abuse and Alcoholism (U.S.); 1996. [Google Scholar]
- 2.Abel EL. Fetal alcohol syndrome: from mechanism to prevention. 1. CRC-Press; 1996. [Google Scholar]
- 3.Mattson SN, Crocker N, Nguyen TT. Fetal alcohol spectrum disorders: neuropsychological and behavioral features. Neuropsychol Rev. 2011;21:81–101. doi: 10.1007/s11065-011-9167-9. [DOI] [PMC free article] [PubMed] [Google Scholar]
- 4.Sampson PDP, Streissguth APA, Bookstein FLF, Little RER, Clarren SKS, Dehaene PP, et al. Incidence of fetal alcohol syndrome and prevalence of alcohol-related neurodevelopmental disorder. Teratology. 1997;56:317–26. doi: 10.1002/(SICI)1096-9926(199711)56:5<317::AID-TERA5>3.0.CO;2-U. [DOI] [PubMed] [Google Scholar]
- 5.Rasmussen C, Becker M, McLennan J, Urichuk L, Andrew G. An evaluation of social skills in children with and without prenatal alcohol exposure. Child: Care, Health Dev. 2010;37:711–8. doi: 10.1111/j.1365-2214.2010.01152.x. [DOI] [PubMed] [Google Scholar]
- 6.May PA, Gossage JP, Kalberg WO, Robinson LK, Buckley D, Manning M, et al. Prevalence and epidemiologic characteristics of FASD from various research methods with an emphasis on recent in-school studies. Dev Disabil Res Revs. 2009;15:176–92. doi: 10.1002/ddrr.68. [DOI] [PubMed] [Google Scholar]
- 7.Echevarria DJ, Toms CN, Jouandot DJ. Alcohol-induced behavior change in zebrafish models. Reviews in the Neurosciences. n.d:22. doi: 10.1515/RNS.2011.010. [DOI] [PubMed] [Google Scholar]
- 8.Loucks E, Carvan MJ., III Strain-dependent effects of developmental ethanol exposure in zebrafish. Neurotoxicol Teratol. 2004;26:745–55. doi: 10.1016/j.ntt.2004.06.017. [DOI] [PubMed] [Google Scholar]
- 9.Bilotta J, Barnett JA, Hancock L, Saszik S. Ethanol exposure alters zebrafish development: a novel model of fetal alcohol syndrome. Neurotoxicol Teratol. 2004;26:737–43. doi: 10.1016/j.ntt.2004.06.011. [DOI] [PubMed] [Google Scholar]
- 10.Gerlai R, Lahav M, Guo S, Rosenthal A. Drinks like a fish: zebra fish (Danio rerio) as a behavior genetic model to study alcohol effects. Pharmacol Biochem Behav. 2000;67:773–82. doi: 10.1016/s0091-3057(00)00422-6. [DOI] [PubMed] [Google Scholar]
- 11.Arenzana FJ, Carvan MJ, III, Aijón J, Sánchez-González R, Arévalo R, Porteros A. Teratogenic effects of ethanol exposure on zebrafish visual system development. Neurotoxicol Teratol. 2006;28:342–8. doi: 10.1016/j.ntt.2006.02.001. [DOI] [PubMed] [Google Scholar]
- 12.Loucks E, Ahlgren S. Assessing teratogenic changes in a zebrafish model of fetal alcohol exposure. JoVE. 2012:61. doi: 10.3791/3704. http://dx.doi.org/10.3791/3704, pii:3704. [DOI] [PMC free article] [PubMed]
- 13.Zhang C, Turton QM, Mackinnon S, Sulik KK, Cole GJ. Agrin function associated with ocular development is a target of ethanol exposure in embryonic zebrafish. Birth Defects Res A: Clin Mol Teratol. 2011;91:129–41. doi: 10.1002/bdra.20766. [DOI] [PMC free article] [PubMed] [Google Scholar]
- 14.Fernandes Y, Gerlai R. Long-term behavioral changes in response to early developmental exposure to ethanol in zebrafish. Alcohol Clin Exp Res. 2009;33:601–9. doi: 10.1111/j.1530-0277.2008.00874.x. [DOI] [PMC free article] [PubMed] [Google Scholar]
- 15.Mahabir S, Chatterjee D, Gerlai R. Strain dependent neurochemical changes induced by embryonic alcohol exposure in zebrafish. Neurotoxicol Teratol. 2013:1–9. doi: 10.1016/j.ntt.2013.11.001. [DOI] [PMC free article] [PubMed] [Google Scholar]
- 16.Kimmel CB, Ballard WW, Kimmel SR, Ullmann B, Schilling TF. Stages of embryonic development of the zebrafish. Am J Anat. 1995;203:253–310. doi: 10.1002/aja.1002030302. [DOI] [PubMed] [Google Scholar]
- 17.Mattson SN, Riley EP, Delis DC, Stern C, Jones KL. Verbal learning and memory in children with fetal alcohol syndrome. Alcohol Clin Exp Res. 1996;20:810–6. doi: 10.1111/j.1530-0277.1996.tb05256.x. [DOI] [PubMed] [Google Scholar]
- 18.Mattson SN, Roebuck TM. Acquisition and retention of verbal and nonverbal information in children with heavy prenatal alcohol exposure. Alcohol Clin Exp Res. 2002;26:875–82. [PubMed] [Google Scholar]
- 19.Gerlai R. Associative learning in zebrafish (Danio rerio) Methods Cell Biol. 2011;101:249–70. doi: 10.1016/B978-0-12-387036-0.00012-8. [DOI] [PubMed] [Google Scholar]
- 20.Saverino C, Gerlai R. The social zebrafish: behavioral responses to conspecific, heterospecific, and computer animated fish. Behav Brain Res. 2008;191:77–87. doi: 10.1016/j.bbr.2008.03.013. [DOI] [PMC free article] [PubMed] [Google Scholar]
- 21.Miller N, Gerlai R. Quantification of shoaling behaviour in zebrafish (Danio rerio) Behav Brain Res. 2007;184:157–66. doi: 10.1016/j.bbr.2007.07.007. [DOI] [PubMed] [Google Scholar]
- 22.Miller NY, Gerlai R. Shoaling in zebrafish: what we don’t know. Rev Neurosci. 2011;22:17–25. doi: 10.1515/RNS.2011.004. [DOI] [PubMed] [Google Scholar]
- 23.Miller NY, Gerlai R. Oscillations in shoal cohesion in zebrafish (Danio rerio) Behav Brain Res. 2008;193:148–51. doi: 10.1016/j.bbr.2008.05.004. [DOI] [PMC free article] [PubMed] [Google Scholar]
- 24.Al-Imari L, Gerlai R. Sight of conspecifics as reward in associative learning in zebrafish (Danio rerio) Behav Brain Res. 2008;189:216–9. doi: 10.1016/j.bbr.2007.12.007. [DOI] [PubMed] [Google Scholar]
- 25.Buske C, Gerlai R. Early embryonic ethanol exposure impairs shoaling and the dopaminergic and serotoninergic systems in adult zebrafish. Neurotoxicol Teratol. 2011;33:698–707. doi: 10.1016/j.ntt.2011.05.009. [DOI] [PMC free article] [PubMed] [Google Scholar]
- 26.Sison M, Gerlai R. Associative learning in zebrafish (Danio rerio) in the plus maze. Behav Brain Res. 2010;207:99–104. doi: 10.1016/j.bbr.2009.09.043. [DOI] [PMC free article] [PubMed] [Google Scholar]
- 27.Lockwood B, Bjerke S, Kobayashi K, Guo S. Acute effects of alcohol on larval zebrafish: a genetic system for large-scale screening. Pharmacol Biochem Behav. 2004;77:647–54. doi: 10.1016/j.pbb.2004.01.003. [DOI] [PubMed] [Google Scholar]
- 28.Kodituwakku PW. Defining the behavioral phenotype in children with fetal alcohol spectrum disorders: a review. Neurosci Biobehav Rev. 2007;31:192–201. doi: 10.1016/j.neubiorev.2006.06.020. [DOI] [PubMed] [Google Scholar]
- 29.Schneider ML, Moore CF, Adkins MM. The effects of prenatal alcohol exposure on behavior: rodent and primate studies. Neuropsychol Rev. 2011;21:186–203. doi: 10.1007/s11065-011-9168-8. [DOI] [PMC free article] [PubMed] [Google Scholar]
- 30.Matsui JI. Effects of ethanol on photoreceptors and visual function in developing zebrafish. Investig Ophthalmol Vis Sci. 2006;47:4589–97. doi: 10.1167/iovs.05-0971. [DOI] [PMC free article] [PubMed] [Google Scholar]
- 31.Dlugos CA, Rabin RA. Ocular deficits associated with alcohol exposure during zebrafish development. J Comp Neurol. 2007;502:497–506. doi: 10.1002/cne.21320. [DOI] [PubMed] [Google Scholar]
- 32.Blaser R, Gerlai R. Behavioral phenotyping in zebrafish: comparison of three behavioral quantification methods. Behav Res Methods. 2006;38:456–69. doi: 10.3758/bf03192800. [DOI] [PubMed] [Google Scholar]