

Abstract
Sperm guidance is controlled by chemical and physical cues. In many species, Ca2+ bursts in the flagellum govern navigation to the egg. In Arbacia punctulata, a model system of sperm chemotaxis, a cGMP signaling pathway controls these Ca2+ bursts. The underlying Ca2+ channel and its mechanisms of activation are unknown. Here, we identify CatSper Ca2+ channels in the flagellum of A. punctulata sperm. We show that CatSper mediates the chemoattractant-evoked Ca2+ influx and controls chemotactic steering; a concomitant alkalization serves as a highly cooperative mechanism that enables CatSper to transduce periodic voltage changes into Ca2+ bursts. Our results reveal intriguing phylogenetic commonalities but also variations between marine invertebrates and mammals regarding the function and control of CatSper. The variations probably reflect functional and mechanistic adaptations that evolved during the transition from external to internal fertilization.
Keywords: CatSper, Ca2+ signaling, chemotaxis, sperm
Introduction
The intracellular Ca2+ concentration ([Ca2+]i) coordinates several sperm functions required for fertilization (Ho & Suarez, 2001; Eisenbach & Giojalas, 2006; Florman et al, 2008; Kaupp et al, 2008; Publicover et al, 2008). In particular, Ca2+ controls the beat of the flagellum and, thereby, the swimming behavior. In mice and humans, the sperm-specific Ca2+ channel CatSper (cation channel of sperm) represents the principal pathway for Ca2+ entry into the flagellum (Quill et al, 2001; Ren et al, 2001; Kirichok et al, 2006; Lishko et al, 2010). Targeted disruption of CatSper in mice impairs sperm motility (Qi et al, 2007), and CatSper−/− sperm fail to traverse the oviduct (Ho et al, 2009; Miki & Clapham, 2013; Chung et al, 2014) and to penetrate the egg coat (Ren et al, 2001)—deficits that cause male infertility (Quill et al, 2001; Ren et al, 2001; Qi et al, 2007). Similarly, mutations in human CatSper genes cause infertility in men (Avenarius et al, 2009; Hildebrand et al, 2010).
CatSper has been proposed to serve as a polymodal sensor that integrates diverse chemical and physical cues (Brenker et al, 2012; Miki & Clapham, 2013; Tavares et al, 2013; Schiffer et al, 2014): In general, CatSper is activated at depolarized membrane potentials (Vm) and at alkaline intracellular pH (pHi) (Kirichok et al, 2006; Lishko et al, 2010, 2011; Strünker et al, 2011). However, the interplay between Vm and pHi to control CatSper during fertilization is unknown. In human sperm, hormones in the seminal fluid and the oviduct, i.e. prostaglandins and progesterone, directly activate CatSper (Lishko et al, 2011; Strünker et al, 2011; Brenker et al, 2012; Smith et al, 2013) and, thereby, affect sperm motility (Aitken & Kelly, 1985; Alasmari et al, 2013). Progesterone has been implicated in human sperm chemotaxis (Oren-Benaroya et al, 2008; Publicover et al, 2008; Teves et al, 2009); yet, in vivo, neither sperm chemotaxis nor the physiological role of these hormones during fertilization has been definitely established (Baldi et al, 2009). This is due to the demanding challenge to experimentally emulate the complex chemical, hydrodynamic, and topographical landscape of the female genital tract (Suarez & Pacey, 2006; Suarez, 2008; Kirkman-Brown & Smith, 2011; Miki & Clapham, 2013).
In contrast, many aquatic species, in particular marine invertebrates, release their gametes into the ambient water; consequently, gametes of broadcast spawners can be studied under close to native conditions. For 100 years, sperm of marine invertebrates have served as a powerful model of fertilization research (Kaupp, 2012). It is well established that in the aquatic habitat, sperm are guided to the egg by chemotaxis. A case in point is sea urchin sperm. In sea urchin sperm, a cGMP signaling pathway generates Ca2+ bursts in the flagellum that coordinate chemotactic steering (Böhmer et al, 2005; Wood et al, 2005; Darszon et al, 2008; Kaupp et al, 2008; Guerrero et al, 2010a,b; Alvarez et al, 2012). Important components and cellular events of this signaling pathway have been identified (reviewed in Darszon et al, 2008; Kaupp et al, 2008; Alvarez et al, 2014). Briefly, the chemoattractant activates a receptor guanylyl cyclase (GC) and, thereby, stimulates rapid cGMP synthesis (Dangott & Garbers, 1984; Bentley et al, 1986, 1988; Shimomura & Garbers, 1986; Dangott et al, 1989; Kaupp et al, 2003). cGMP opens K+-selective cyclic nucleotide-gated (CNGK) channels (Strünker et al, 2006; Galindo et al, 2007; Bönigk et al, 2009). The ensuing hyperpolarization (Cook & Babcock, 1993; Reynaud et al, 1993; Beltrán et al, 1996; Strünker et al, 2006) activates a sperm-specific voltage-dependent Na+/H+ exchanger (sNHE) (Lee, 1984a; Lee, 1984b; Lee & Garbers, 1986), mediating a rapid rise of pHi (Nishigaki et al, 2001; Solzin et al, 2004) and, eventually, opens voltage-gated Ca2+ channels (Gonzáles-Martínez et al, 1992; Beltrán et al, 1996; Nishigaki et al, 2001; Kaupp et al, 2003; Strünker et al, 2006). However, to date, the molecular identity of the Ca2+ channel and its mechanism of activation have been elusive.
CatSper genes exist in many metazoan genomes, including aquatic animals (Cai & Clapham, 2008), yet the expression and function of CatSper in non-mammalian species are unknown. Here, we show that CatSper represents the long-sought Ca2+ channel of the chemotactic signaling pathway in sperm of the sea urchin A. punctulata. CatSper mediates the chemoattractant-induced Ca2+ bursts and controls chemotactic steering. We unveil the intimate, allosteric relationship between pHi and Vm for CatSper activation: A minute chemoattractant-induced increase of pHi enables CatSper in a highly cooperative fashion to open during a subsequent depolarization. The pHi-induced shift of the voltage dependence of CatSper activation enables sperm to transduce periodic Vm changes into periodic Ca2+ bursts during sperm navigation on periodic paths in a chemoattractant gradient. We reveal intriguing commonalities and variations in the function and molecular makeup of chemosensory signaling pathways in sperm from mammals and marine invertebrates. Although different in design, these pathways share the CatSper channel as a key component of Ca2+ signaling.
Results
CatSper is expressed in the flagellum of Arbacia punctulata sperm
From a cDNA library of A. punctulata testis, we cloned four cDNAs encoding pore-forming CatSper subunits (ApCatSper 1–4) (Fig1A, Supplementary Fig S1). Each ApCatSper subunit harbors six transmembrane segments (S1–S6), a voltage sensor in S4, and a pore loop between S5 and S6 (Fig1A, Supplementary Fig S1). The pore loops carry the signature sequence of Cav and CatSper channels (Fig1B, upper panel) (Navarro et al, 2008). Similar to other voltage-gated channels, the S4 segments of all four ApCatSper subunits carry six to seven positively charged residues (Fig1B, lower panel). The intracellular N- or C-termini of ApCatSper 1, 2, and 4, but not of ApCatSper 3, carry coiled-coil domains (Fig1A, Supplementary Fig S1) that were proposed to mediate heterotetramerization in mammalian CatSper (Lobley et al, 2003). The overall homology of ApCatSper subunits with their mammalian CatSper ortholog is low (25–35%).
Figure 1.
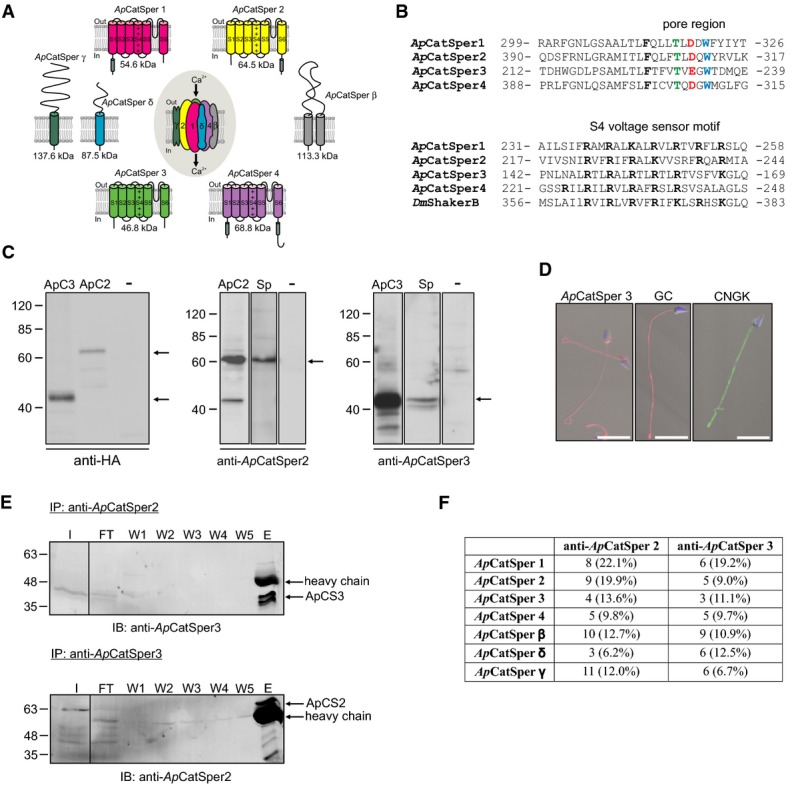
- Predicted membrane topology and predicted molecular weight of ApCatSper 1–4 cloned from A. punctulata testis, and of ApCatSper β, δ, and γ. A gene encoding ApCatSper δ was identified in the A. punctulata genome; transcripts encoding ApCatSper β and ApCatSper γ were identified in the A. punctulata transcriptome. S1 to S6, transmembrane segments; +, positively charged amino acids in S4; gray cylinder, coiled-coil domain.
- Upper panel, alignment of pore regions of ApCatSper 1–4. Amino acids of the Ca2+ selectivity-filter motif are highlighted. Lower panel, alignment of S4 voltage-sensor segments of ApCatSper 1–4 and of D. melanogaster ShakerB Kv channel. Positively charged amino acids are highlighted. Numbers indicate start and end position of amino acids of the selected region.
- Western blots of total protein of CHO cells transfected with ApCatSper 2 or 3, non-transfected control cells (-), and A. punctulata sperm (Sp). The Western blots were probed with anti-HA, anti-ApCatSper 2, or anti-ApCatSper 3 antibodies. Arrows indicate bands representing ApCatSper 2 and 3.
- Immunocytochemical analysis of sperm stained with anti-ApCatSper 3, anti-GC, or anti-CNGK antibodies; superposition of images obtained by fluorescence and bright-field microscopy; scale bar = 10 μm. The DNA was stained with DAPI (blue).
- Western blot analysis of co-immunoprecipitation (IP) of A. punctulata sperm proteins. The input (I), flow through (FT), washes (W1-5), and the eluate (E) of the IP using the anti-ApCatSper 2 antibody were probed with the anti-ApCatSper 3 antibody (upper panel) and vice versa (lower panel). ApCatSper 3 and ApCatSper 2 were co-immunoprecipitated with the anti-ApCatSper 2 (upper panel) and anti-ApCatSper 3 antibody (lower panel), respectively.
- Analysis by mass spectrometry of immunoprecipitated proteins. ApCatSper 1-4, β, γ, and δ were identified in the immunoprecipitates obtained with both the anti-ApCatSper 2 and anti-ApCatSper 3 antibodies. The number of tryptic peptides identified and the respective sequence coverage are given.
Source data are available online for this figure.
To localize ApCatSper subunits in sperm, we raised monoclonal antibodies against ApCatSper 2 and 3 (Supplementary Fig S1). Hemagglutinin (HA)-tagged ApCatSper 2 and 3 subunits were heterologously expressed in Chinese hamster ovary (CHO) cells. In Western blots, an anti-HA antibody labeled polypeptides with apparent molecular weights (Mw) of 66.5 ± 3.1 kDa (ApCatSper 2, n = 24) and 41.6 ± 2.1 kDa (ApCatSper 3, n = 9). The same polypeptides were recognized by the monoclonal anti-ApCatSper 2 and 3 antibodies in transfected CHO cells and in sperm (Fig1C), demonstrating that ApCatSper 2 and 3 are expressed in A. punctulata sperm. In immunocytochemistry, the anti-ApCatSper 3 antibody stained the flagellum (Fig1D, left). The staining pattern of the receptor GC (Fig1D, middle), the CNGK channel (Fig1D, right), and ApCatSper 3 overlapped, showing that CatSper colocalizes with components of the chemotactic signaling pathway. Mass spectrometry confirmed the presence of ApCatSper 1–4 in the flagellum: In protein preparations from purified flagella, we identified proteotypic peptides for all four ApCatSper subunits (Supplementary Fig S1, Supplementary Table S1); the peptides covered 5–25% of the respective protein sequences (Supplementary Table S1). Moreover, in the A. punctulata genome and testis transcriptome (to be published), we identified a gene encoding the accessory subunit CatSper δ (Chung et al, 2011) and mRNAs encoding CatSper β (Liu et al, 2007) and CatSper γ (Wang et al, 2009) (Supplementary Fig S1, 1Fig A). In purified flagella, we identified proteotypic peptides of the predicted accessory subunits (Supplementary Table S1). We conclude that ApCatSper 1–4 and ApCatSper β, δ, and γ are expressed in sperm and are located in the flagellum.
We immunoprecipitated ApCatSper 2 and ApCatSper 3, using the respective anti-ApCatSper antibodies. Analysis of the co-immunoprecipitates by Western blotting (Fig1E) and mass spectrometry (Fig1F, Supplementary Table S2) indicates that ApCatSper 1–4, β, δ, and γ interact to form a protein complex. Therefore, we propose that the architecture of the CatSper channel is similar in sea urchins and mammals. Unfortunately, like their mammalian counterparts (Ren et al, 2001), heterologously expressed ApCatSper subunits did not yield functional channels.
Intracellular pH and membrane voltage control Ca2+ influx in sea urchin sperm
Using a stopped-flow apparatus and fluorescent probes for Ca2+, Vm, and pH, we studied the role of CatSper in intact A. punctulata sperm. Ammonium chloride (NH4Cl) evoked a rapid and sustained intracellular alkalization (Supplementary Fig S2) that stimulated a Ca2+ increase (Fig2A). At low NH4Cl concentrations (≤ 3 mM), Ca2+ signals slowly reached a plateau; at higher concentrations (≥ 10 mM), NH4Cl evoked rapid, oscillatory Ca2+ responses (Fig2A). Mixing of sperm with both NH4Cl and EGTA, which lowers extracellular [Ca2+] to ≤ 400 nM, abolished the Ca2+, but not the pHi response (Supplementary Fig S2), demonstrating that alkalization stimulates Ca2+ influx.
Figure 2.
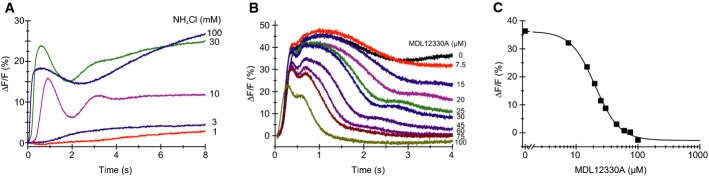
- Alkaline-evoked Ca2+ signals in sperm mixed with NH4Cl; sperm were loaded with the Ca2+ indicator Fluo-4. ΔF/F (%) indicates the change in Fluo-4 fluorescence (ΔF) with respect to the basal fluorescence (F, mean of the first 3–5 data points).
- Ca2+ signals evoked by mixing of sperm simultaneously with NH4Cl (30 mM) and the CatSper inhibitor MDL12330A.
- Dose–response relation of inhibition of the Ca2+ signals shown in panel (B), Ki = 20 μM, amplitudes were determined at t = 4 s.
Two distinct CatSper inhibitors, MDL12330A (MDL) (Brenker et al, 2012) and mibefradil (Strünker et al, 2011), suppressed the alkaline-evoked Ca2+ signal (Fig2B and C, Supplementary Fig S2); the constants of half-maximal inhibition (Ki) were 15.6 ± 3.3 μM (MDL) and 20.7 ± 5.1 μM (mibefradil) (n = 4) (Fig2B and C, Supplementary Fig S2). Sperm were mixed simultaneously with NH4Cl and the inhibitors, and the time course of inhibition probably reflects the time required for the drug to reach the blocking site; we did not test whether drug action reached steady state within the recording time.
The drugs inhibit CatSper-mediated Ca2+ signals in human sperm with similar potency (Strünker et al, 2011; Brenker et al, 2012). We conclude that in sea urchin sperm, similar to mouse and human sperm, CatSper mediates alkaline-evoked Ca2+ influx. Because MDL and mibefradil are not selective for CatSper, we cannot exclude that the sperm might harbor additional, so far unknown Ca2+-permeable channels that are also activated at alkaline pHi and inhibited by both drugs.
We determined the pHi sensitivity of the alkaline-induced Ca2+ influx using the “pHi pseudo-null-point” method (Eisner et al, 1989; Chow et al, 1996; Bond & Varley, 2005; Swietach et al, 2010) that allows clamping of pHi to fixed values and calibration of the pH indicator BCECF. Key is a set of pHi-clamp solutions composed of a weak acid (butyric acid, BA) and a weak base (trimethylamine, TMA) at different molar ratios (see Materials and Methods). TMA and BA freely equilibrate across the membrane and, at sufficiently high concentrations (see Materials and Methods), establish a defined pHi that is set by the acid/base ratio (Chow et al, 1996).
Mixing of sperm with a pHi 7.2-clamp solution changed pHi only slightly, suggesting a resting pH (pHrest) of about 7.2 (Fig3A). Mixing with pHi-clamp solutions < 7.2 and > 7.2 evoked acidification and alkalization, respectively, that was stable after 4–5 s and persisted for at least 14 s (Fig3A). The changes in ΔR/R of BCECF fluorescence were linearly related to pHi-clamp values (Fig3B); interpolation yielded a pHrest of 7.16 ± 0.04 (Fig3B; n = 7). Similar pHrest values of sea urchin sperm were determined by other methods (Babcock et al, 1992; Guerrero et al, 1998). Moreover, the calibration allowed rescaling of the data in Fig3A to absolute pHi values (inset in Fig3B).
Figure 3.
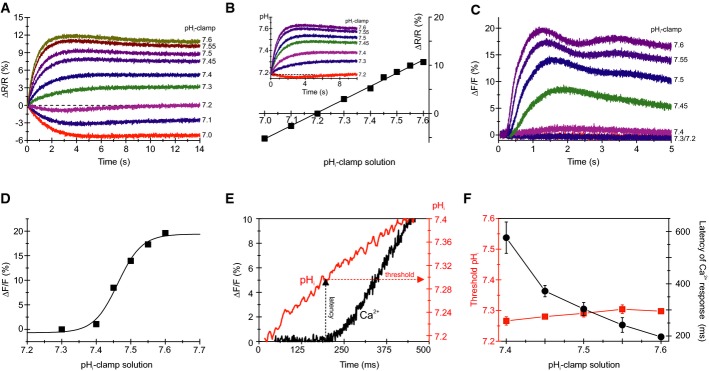
- Changes in pHi evoked by mixing with pHi-clamp solutions (see explanation in the text); sperm were loaded with the pHi indicator BCECF. ΔR/R (%) indicates the change in the BCECF fluorescence emission ratio (ΔR = F494/F540) with respect to the basal ratio (R, mean of the first 3–5 data points).
- Steady-state change (at t = 14 s) of BCECF fluorescence for the pHi signals shown in (A). The intercept of the fitted straight line with the x-axis yields the resting pHi; the slope of the straight line yields the ΔR/R (%) × ΔpH−1. Inset: calibrated changes in pHi evoked by various pHi-clamp solutions.
- Ca2+ signals evoked by mixing of sperm with pHi-clamp solutions.
- Dose–response relation for the Ca2+ signals shown in (C).
- Calibrated pHi increase (red) and respective Ca2+ response (black) evoked by mixing of sperm with a pHi 7.6-clamp solution; depicted are, on an extended time scale, the first 500 ms of the respective pHi increase and Ca2+ signal shown in (B, inset) and (C), respectively. The threshold pHi for CatSper activation was deduced from the latency of the Ca2+ signal.
- Threshold pHi and latency of Ca2+ signals evoked by various pHi-clamp solutions (mean ± SD; n ≥ 3).
Figure3C shows the time course of Ca2+ responses in sperm mixed with different pHi-clamp solutions. Plotting the amplitude of the Ca2+ signals versus the respective pHi-clamp values disclosed an exceptionally steep dose–response relation with a pH½ of 7.47 ± 0.01 and a Hill coefficient of 10.8 ± 2.2 (Fig3D, n = 4). From the time course of the changes in pHi and Ca2+, we reconstructed the threshold pHi (pHthr) at which the Ca2+ influx commenced (Fig3E). For example, using the pHi 7.6-clamp solution, the Ca2+ signal was observed after a latency of ≅ 200 ms (Fig3E, dotted black line), at which the pHi of sperm had increased to ≅ 7.3 (Fig3E, dotted red line), i.e. pHthr for Ca2+ influx. We determined pHthr for the entire range of pHi-clamp solutions (Fig3F). The latency of the Ca2+ influx decreased with increasing pHi-clamp values (Fig3F, black), because the alkalization proceeded on a faster time scale (Fig3A and inset of Fig3B). However, pHthr was largely independent of the rate and magnitude of the pHi increase (Fig3F, red). The invariant pHthr for the alkaline-induced Ca2+ influx and its exceptionally steep, switch-like dose–response relation suggest that intracellular alkalization sensitizes CatSper to open during depolarization.
We also wondered whether depolarization evokes a Ca2+ increase. In fact, rapid elevation of the extracellular K+ concentration ([K+]o) to ≥ 30 mM evoked a transient Ca2+ signal (Fig4A), whose amplitude was graded with [K+]o. MDL inhibited Ca2+ signals evoked by 80 mM and 160 mM K+ with a Ki of 38.8 ± 7.5 μM and 29.2 ± 11.2 μM (n = 3), respectively (Fig4B–D); the Ca2+ signals were also suppressed by mibefradil (Supplementary Fig S2). We conclude that CatSper also supports depolarization-evoked Ca2+ influx in sea urchin sperm.
Figure 4.
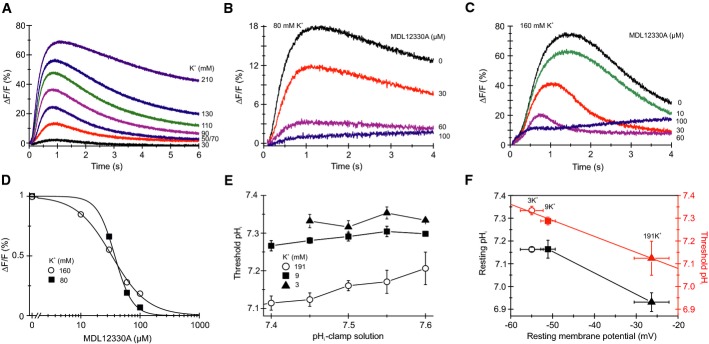
- Depolarization-evoked Ca2+ signals in sperm mixed with ASW containing high KCl concentrations.
- Ca2+ signals evoked by mixing of sperm with 80 mM KCl and the CatSper inhibitor MDL12330A.
- Ca2+ signals evoked by mixing of sperm with 160 mM KCl and MDL12330A.
- Dose–response relation for the Ca2+ signals shown in (B, C) at t = 1–2 s.
- Threshold pHi for Ca2+ signals evoked by pHi-clamp solutions in sperm bathed in ASW containing low (3 mM), high (191 mM), and normal (9 mM) KCl (mean ± SD; n ≥ 3); data for 9 mM KCl are from Fig3F.
- Resting pHi and resting Vm in sperm bathed in ASW containing low (3 mM), high (191 mM), and normal (9 mM) KCl (black) (mean ± SD; n ≥ 3). Mean threshold pHi for CatSper activation at different membrane potentials (red); mean threshold pHi was derived from data shown in (E).
We examined the relationship between pHthr and Vm. To manipulate the resting potential (Vrest), sperm were incubated at different [K+]o. In standard artificial sea water (ASW, 9 mM [K+]o), Vrest was −51.9 ± 2 mV (Fig4E, n = 6); sperm were hyperpolarized and depolarized to −54.9 ± 2.2 mV and −26.3 ± 4.2 mV, respectively, at low (3 mM) and high (191 mM) [K+]o (Fig4F, n = 3); Vrest was determined by the [K+]o null-point method (Strünker et al, 2006; see also Materials and Methods), assuming an intracellular K+ concentration of 423 mM. Probing cells with different pHi-clamp solutions and analyzing the time course of pHi and Ca2+ signals revealed pHthr for different Vrest values (Fig4E, Supplementary Fig S3). At hyperpolarized Vrest, the pHthr for Ca2+ influx was shifted to more alkaline pHi values (Fig4E, Supplementary Fig S3); when Vrest was depolarized, the pHthr was shifted to more acidic pHi values (Fig4E and F, Supplementary Fig S3); a linear fit of the data yielded a slope of ΔpHthr/10 mV of 0.07 ± 0.004 (standard error of the fit) (Fig4F, red line). In addition, pHrest was more acidic at depolarized Vrest (Fig4F). We conclude that the control of Ca2+ influx via CatSper by pHi and membrane voltage is closely intertwined.
Chemoattractant-induced ΔpHi and ΔVm orchestrate Ca2+ influx in sea urchin sperm
We studied the control of Ca2+ influx by pHi and Vm in sperm stimulated with either the chemoattractant resact or the intracellular messenger cGMP. Ca2+ signals evoked by photorelease of resact from caged resact were abolished by MDL (Ki = 6.4 ± 1 μM) and mibefradil (9.5 ± 1.6 μM) (n = 3) (Fig5A, C, and D, Supplementary Fig S4). Both drugs also abolished Ca2+ signals evoked by intracellular photorelease of cGMP from caged cGMP (MDL: Ki = 3.9 ± 0.4 μM; mibefradil: Ki = 25.2 ± 3.7 μM) (n = 3) (Fig5B–D, Supplementary Fig S4). The potency of MDL to inhibit the resact- and cGMP-evoked Ca2+ responses was about 2- to 3-fold higher than the potency to inhibit Ca2+ signals evoked by alkalization or depolarization. However, sperm were first pre-incubated for about 5 s before resact or cGMP was released. This short pre-incubation might enhance the potency. It is however unclear, why mibefradil inhibited the resact- and cGMP-induced Ca2+ responses with about 3-fold different potencies. Altogether, we conclude that CatSper mediates the chemoattractant- and cGMP-induced Ca2+ influx.
Figure 5.
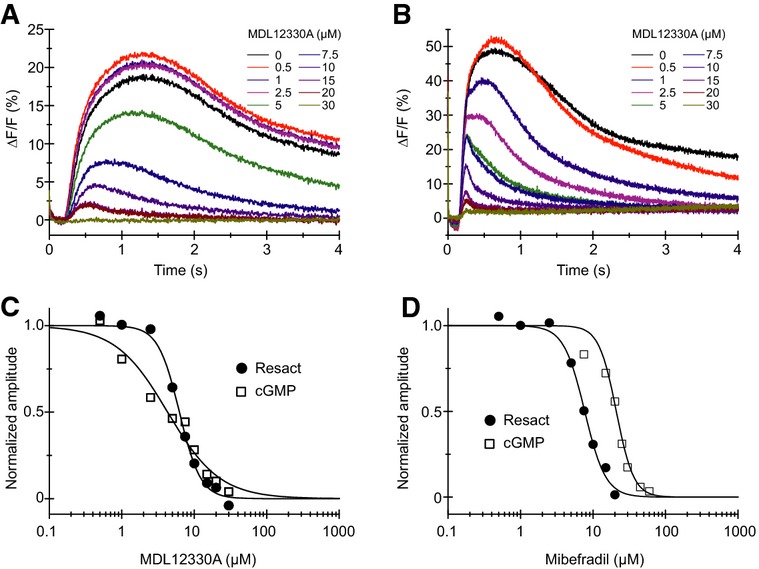
- Ca2+ signals in sperm evoked by photorelease (at t = 0) of resact from caged resact in the presence of the CatSper inhibitor MDL12330A.
- Ca2+ signals evoked by intracellular photorelease (at t = 0) of cGMP in sperm loaded with caged cGMP in the presence of the CatSper inhibitor MDL12330A.
- Normalized dose–response relation for inhibition of the resact- and cGMP-induced Ca2+ signals shown in (A, B) (Ki = 6.2 and 4.3 μM, respectively).
- Normalized dose-response relation for inhibition of the resact- and cGMP-induced Ca2+ signals shown in Supplementary Fig S4 by the CatSper inhibitor mibefradil (Ki = 7.7 and 20.9 μM, respectively).
Resact and cGMP stimulate a transient hyperpolarization, and the Ca2+ influx commences shortly after the hyperpolarization peaks (Strünker et al, 2006). Moreover, resact and cGMP also evoke a rapid pHi increase (Fig6D, Supplementary Fig S5) (Darszon et al, 2008). Given the steep pHi sensitivity of the alkaline-evoked Ca2+ influx, we scrutinized the hypothesis that the pHi increase allosterically shifts the voltage dependence of CatSper to more negative Vm values. A prerequisite for such a mechanism is that the onset of ΔpHi precedes the onset of the Ca2+ signal. Therefore, we determined the exact timing and sequence of signaling events for resact concentrations ranging from 500 fM to 25 nM (Fig6A, Supplementary Fig S6). For all concentrations, the sequence of cellular events was as follows: first sperm hyperpolarized, then the cytosol alkalized, and finally, Ca2+ commenced to rise (Fig6B and C, Supplementary Fig S6). Furthermore, the pHi increase evoked by intracellular photorelease of cGMP also preceded the onset of the Ca2+ signal (Fig6D) (Darszon et al, 2008). These results are consistent with the notion that the resact-induced alkalization enables activation of CatSper channels upon depolarization.
Figure 6.

- Calibrated Vm (left) and pHi (right) changes and Ca2+ signals (middle) evoked by resact.
- Normalized Vm, pHi, and Ca2+ signals evoked by 10 pM resact; the first 600 ms after mixing are shown. The hyperpolarization precedes the pHi increase, whereas the pHi increase precedes the Ca2+ increase.
- Latency of the Vm, the pHi, and the Ca2+ signals evoked by various resact concentrations (mean ± SD; n = 3).
- Normalized pHi and Ca2+ signals evoked by photorelease of cGMP in sperm loaded with caged cGMP.
- Calibrated Vm and Ca2+ signals evoked by 1 nM resact; the threshold voltage (Vthr) for the Ca2+ influx was deduced from the latency of the Ca2+ signal.
- Calibrated pHi and Ca2+ signals evoked by 1 nM resact; the threshold pHi (pHthr) at which the Ca2+ influx commences was deduced from the latency of the Ca2+ signal.
- Linear relationship between pHthr and Vthr for activation of Ca2+ influx by various resact concentrations (data derived from Supplementary Fig S6; mean ± SD; n ≥ 3).
From the latency of the Ca2+ signal at different resact concentrations, we identified pairs of voltage threshold (Vthr) and pHthr at which the Ca2+ influx commenced (Fig6E–G). For example, using 1 nM resact, Ca2+ influx commenced at Vthr of −71 ± 3 mV and at pHthr of 7.36 ± 0.004 (Fig6E–G, n = 3). For resact concentrations from 10 pM to 25 nM, the respective Vthr versus pHthr pairs displayed an inverse, linear relationship (Fig6G), i.e. with increasing resact concentrations, the Ca2+ influx commenced at more negative Vthr and at more alkaline pHthr (Supplementary Fig S7). The slope of the straight line fitted to the data yielded a ΔVthr/ΔpH ratio of 75 mV. This result underscores the intimate relationship between pHi and Vm for CatSper activation, which requires that changes in pHi and Vm proceed in precise chronology. In mouse sperm, a change of pHi from 6 to 7 shifts the voltage dependence of CatSper activation by about −70 mV (Kirichok et al, 2006), indicating that the pHi sensitivity of mammalian and sea urchin CatSper is similar. In summary, our experiments indicate that the resact-induced alkalization is key to the Ca2+ influx via CatSper.
We attempted to prevent the resact-induced alkalization by incubating sperm with the membrane-permeant pH buffer imidazole. Imidazole ≤ 20 mM attenuated the resact-induced alkalization in a dose-dependent fashion; at 30 mM imidazole, the alkalization was abolished (Supplementary Fig S8A). Concomitantly, the Ca2+ response was abolished as well (Supplementary Fig S8B), suggesting that the alkalization is required for CatSper activation. However, we observed that imidazole also strongly reduced the initial hyperpolarization (Supplementary Fig S8D and E), demonstrating that the drug is not suited to study signaling in sea urchin sperm. We wondered whether incubation with a physiological pH buffer like bicarbonate ( ) prevents the pHi responses—assuming that
  enters the sperm. However, the resact-induced alkalization was similar in the absence and presence of 10 and 30 mM
  (Supplementary Fig S8F).
CatSper controls chemotaxis of sperm
Finally, we tested whether CatSper controls chemotactic steering of sperm. In a shallow observation chamber under a dark-field microscope, sperm were bathed in caged resact (Kaupp et al, 2003; Böhmer et al, 2005; Alvarez et al, 2012). A resact gradient was established by photolysis of caged resact in the center of the recording chamber (Fig7A). After the flash, sperm accumulated in the irradiated area, indicated by a decrease in sperm dispersion in the field of view, whereas the surrounding area became depleted of sperm (Fig7, Supplementary Movies S1 and S2; control); MDL and mibefradil abolished the resact-induced accumulation of sperm (Fig7, MDL12330A; Supplementary Movies S1 and S2). We conclude that the chemoattractant-induced Ca2+ influx via CatSper controls navigation of sperm in a resact gradient.
Figure 7.
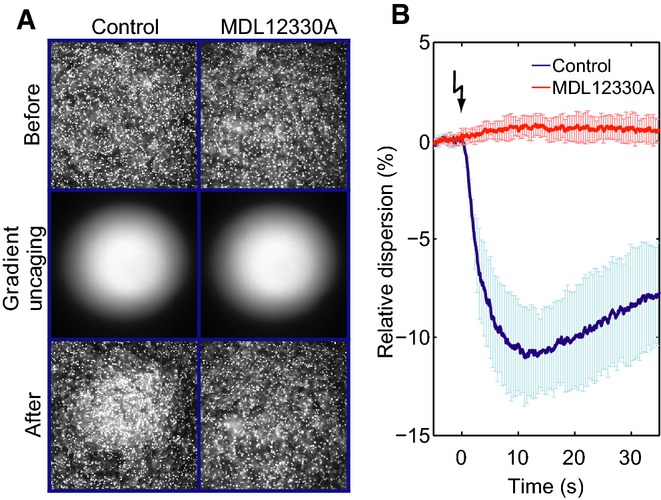
- Dark-field microscopy images of a sperm suspension before (top) and after (bottom) photorelease of a resact gradient (middle) in the absence (control; left) or presence of the CatSper inhibitor MDL12330A (10 μM; right). MDL12330A abolishes resact-induced sperm accumulation.
- Relative change of the sperm dispersion in the field of view evoked by photorelease of resact (t = 0, flash) in the absence (control; blue) or presence of MDL12330A (red); a decrease in dispersion indicates sperm accumulation in the irradiated area (mean ± SD; n = 4).
Discussion
Although CatSper has been discovered more than a decade ago and CatSper genes are present in many phyla, knowledge about CatSper channels originates exclusively from studies of human and mouse sperm. We show that CatSper constitutes the long-sought Ca2+ channel that controls chemotaxis in sea urchin sperm. Moreover, we unravel in quantitative terms the interplay between pHi and Vm to control Ca2+ influx via CatSper in intact sperm.
At rest, Vthr of CatSper activation is slightly more positive than Vrest and the channel is closed. The chemoattractant-induced hyperpolarization (Fig8B, black arrow) evokes a rapid intracellular alkalization via the sNHE exchanger that harbors a classic voltage-sensor motif, which probably mediates the voltage dependence (Wang et al, 2003; Nomura & Vacquier, 2006). The alkalization shifts the voltage dependence of CatSper by as much as 30 mV to more negative values (Fig8B, blue arrow) and, thereby, enables CatSper to open during the subsequent depolarization brought about by hyperpolarization-activated and cyclic nucleotide-gated (HCN) channels (Fig8B, red arrow) (Gauss et al, 1998; Galindo et al, 2005). The high cooperativity of the allosteric pH control serves as a sensitive mechanism that allows gating of CatSper within the operational voltage range set by Vrest (about −50 mV) and the reversal potential of the CNGK channel (about −95 mV).
Figure 8.
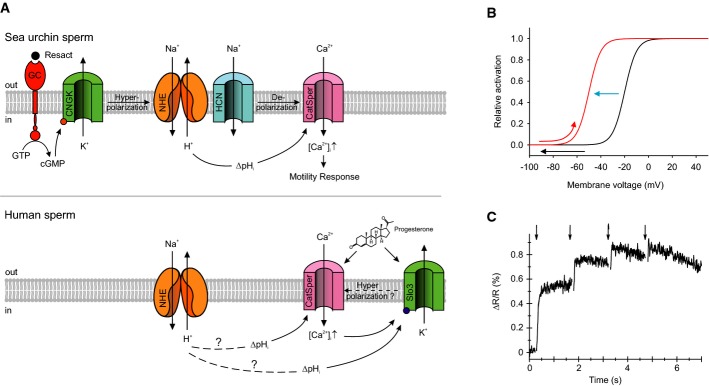
- Signaling pathways in sperm of A. punctulata (upper panel) and humans (lower panel). Questionmarks above dashed lines in the lower panel indicate that the mechanism of how ΔpHi is produced and the hyperpolarization by Slo3 has not been firmly established. Solid lines indicate that the action of ΔpHi on CatSper and of ΔpHi and Ca2+ on Slo3 activity has been firmly established.
- Model of the pHi-induced change in the voltage dependence and Vthr of CatSper; the resact-induced hyperpolarization (black arrow) evokes a rapid alkalization that shifts the voltage dependence of CatSper activation to more negative values (blue arrow) and, thereby, primes CatSper to open during the subsequent depolarization (red arrow).
- Changes in pHi evoked by repetitive release (arrows) of cGMP from caged cGMP. The first UV flash was delivered at t = 0.
In a chemical gradient, sperm are periodically stimulated with the angular frequency of circular swimming of ∽1 Hz (Böhmer et al, 2005). The periodic stimulation can be emulated by repetitive (1 Hz) photorelease of cGMP; each cGMP pulse evokes a Vm and Ca2+ response of similar amplitude (Kashikar et al, 2012). We gained further insight into the interplay between pHi and Ca2+ responses by studying pHi signals evoked by repetitive photorelease of cGMP. Whereas the first flash produced a large increase of pHi, subsequent flashes evoked only a small or no further alkalization (Fig8C). Thus, once alkalization shifted the voltage dependence of CatSper to the permissive voltage range, channel gating is controlled by voltage only. This indicates that ΔpHi is the mechanism that enables sperm to transduce periodic Vm changes into periodic Ca2+ changes during sperm navigation on periodic paths in a chemoattractant gradient (Kashikar et al, 2012).
Here, we reveal intriguing commonalities and differences between signaling pathways in sperm from mammals and marine invertebrates. Although distinct in many respects, signaling pathways share both CatSper and the sNHE exchanger (Fig8A), suggesting that a voltage-induced change in pHi and a pH-induced activation of CatSper are evolutionary conserved signaling events. A mechanism reminiscent of that controlling CatSper in sea urchins has recently been proposed for mouse sperm (Chavez et al, 2014). Hyperpolarization by Slo3, the principal K+ channel in mouse (Santi et al, 2010; Zeng et al, 2011, 2013) and human sperm (Brenker et al, 2014), is required for CatSper to open upon depolarization. The hyperpolarization might involve alkalization, probably mediated by sNHE (Chavez et al, 2014). These events seem to control sperm capacitation, a maturation process inside the female genital tract. At first sight, these capacitation events are reminiscent of the hyperpolarization-induced events during chemotaxis in sea urchin sperm. However, the time scales are entirely different: Mammalian sperm capacitation proceeds in minutes to hours, whereas chemotactic signaling happens within subseconds. Finally, the physiological trigger for Slo3 activation and the precise interplay between Vm and pHi to control mammalian CatSper are unknown. In conclusion, the allosteric mechanism of CatSper activation by pHi and Vm in sea urchins provides a blueprint for studies in mammalian sperm.
On a final note, a difference between chemosensation in sea urchin and human sperm might concern the interplay of CatSper and K+ channels (Fig8A). In sea urchin, the opening of CNGK first activates sNHE and eventually CatSper. Thus, CNGK is located upstream of CatSper on the excitatory limb of the signaling pathway (Fig8A). By contrast, in human sperm, Slo3 is activated by Ca2+ (Brenker et al, 2014), and a Ca2+-induced hyperpolarization might curtail the progesterone-induced Ca2+ influx via CatSper. Thus, Slo3 is placed downstream of CatSper on the recovery limb of signaling (Fig8A). This variation of signaling motifs might reflect a phylogenetic adaptation to the direct activation of human CatSper by extracellular ligands such as progesterone.
In conclusion, CatSper constitutes a crucial component of Ca2+ entry employed by diverse signaling pathways. In general, CatSper might serve as a versatile polymodal sensor that integrates multiple stimuli such as pHi, female factors, and membrane voltage. Depending on the species, CatSper employs either intracellular alkalization or ligand binding to allosterically shift its voltage dependence to the permissive range of membrane potentials. We envisage that variations or combinations of these two mechanisms control CatSper in other species.
Materials and Methods
Arbacia punctulata sperm
Collection of dry sperm and composition of artificial seawater (ASW) was as described previously (Kaupp et al, 2003; Strünker et al, 2006; Kashikar et al, 2012). In brief, about 0.5 ml of 0.5 M KCl was injected into the body cavity to evoke spawning. Spawned sperm (dry sperm) were collected using a Pasteur pipette and stored on ice.
Cloning of ApCatSper subunits
For cloning of ApCatSper 2 and ApCatSper 3, fragments of partial clones from orthologous Strongylocentrotus purpuratus SpCatSper 2 and 3 (kindly provided by D. Ren, University of Pennsylvania, Philadelphia, USA) were amplified. For cloning of ApCatSper 1 and ApCatSper 4, we compared the sequences of mammalian CatSper 1 and 4 subunits with predicted messenger RNA (mRNA) sequences from the S. purpuratus genome project, and we designed primers to amplify fragments of SpCatSper 1 and SpCatSper 4 from a cDNA library of S. purpuratus testis. The SpCatSper 1–4 fragments were used as probes to screen random-primed cDNA libraries of A. punctulata testis under low-stringency conditions. Overlapping ApCatSper partial clones were combined to yield full-length clones; missing sequence information at the 5′- and 3′-end was completed by RACE-PCR (Frohman et al, 1988). PCRs, the construction and screening of cDNA libraries, subcloning, and sequencing of cDNA were performed according to standard protocols. The ApCatSper 2 and 3 clones were fused with the coding sequence for a C-terminal hemagglutinin tag (HA-tag) and cloned into the mammalian expression vector pcDNA3.1+ (Invitrogen).
Antibodies
The antibodies directed against the GC (GCN3D12) and the CNGK (AP47C9) were described previously (Bönigk et al, 2009; Pichlo et al, 2014). A monoclonal antibody from rat (RKKE4F6) was directed against the C-terminus (amino acids 297–317) of ApCatSper 3. Another monoclonal antibody from rat (APCS28G4) was directed against the N-terminus of ApCatSper 2 (amino acids 42–58). The rat anti-HA antibody was from Roche Applied Science. Secondary antibodies were used as follows: goat anti-rat-HRP antibody (Dianova); goat anti-rat-IRDye800cw antibody (LI-COR); donkey anti-rat-Cy3 (Dianova) and goat anti-rat-Alexa488 (Life Technologies).
Immunocytochemistry
Sperm were immobilized on SuperFrost Plus microscope slides (Menzel) and fixed for 5 min with 4% paraformaldehyde. After preincubation with 0.5% Triton X-100 and 5% chemiblocker (Millipore) in 0.1 M phosphate buffer (pH 7.4), sperm were incubated for 1 h with antibodies RKKE4F6 or AP47C9 (undiluted in the presence of 0.5% Triton X-100), or GCN3D12 (1:100 diluted in the presence of 0.5% Triton X-100) and visualized with the donkey anti-rat-Cy3 (RKKE4F6, GCN3D12) or goat anti-rat-Alexa488 (AP47C9) antibodies.
Western blotting
CHO cells transiently transfected with ApCatSper 2 or ApCatSper 3 were resuspended in phosphate-buffered saline (PBS) containing (in mM) 137 NaCl, 2.7 KCl, 6.5 Na2HPO4, 1.5 KH2PO4, pH 7.4, and the protease inhibitor Complete (Roche). Total protein content was determined by using the BCA Assay kit (Pierce). Ten μg of total protein was used in the Western blot analysis. Membrane proteins from A. punctulata sperm were prepared as previously described (Mengerink & Vacquier, 2004). Ten μg of membrane proteins was used in the Western blot analysis. Proteins were separated by 10% SDS–polyacrylamide gel electrophoresis (SDS–PAGE) and blotted, and the membranes were probed with RKKE4F6 (undiluted), APCS28G4 (dilution 1:100), or rat anti-HA (dilution 1:1,000). The goat anti-rat-HRP antibody (dilution 1:5,000) was used to visualize protein bands by a chemoluminescence detection kit; chemoluminescence was detected via a CCD-imaging system (LAS-3000; Fuji) (CHO proteins) or by hyperfilms (GE Healthcare) (sperm proteins). The goat anti-rat-IRDye800cw antibody (1:20,000) was used to visualize sperm protein bands via the Odyssey Imaging System (LI-COR).
Mass spectrometry of proteins from A. punctulata flagella
Sperm flagella and heads were separated as described (Mengerink & Vacquier, 2004; Strünker et al, 2006) with some modifications: Dry sperm was diluted (1:25) in ASW pH 7.8 and centrifuged (200 g, 7 min) to sediment coelomocytes. The supernatant was centrifuged (3,000 g, 15 min) to sediment sperm. The sperm pellet was diluted in ASW pH 7.8 with protease inhibitor Complete (Roche) (1:10 dilution). The sperm suspension was sheared ∽20 times with a 24-G needle and centrifuged (800 g, 10 min) to sediment intact sperm and sperm heads. The purity of flagella preparations was checked by phase-contrast microscopy. Shearing and subsequent centrifugation was repeated several times until pure flagella samples were obtained. All steps were performed on ice. Flagella were lysed by several “freeze/thaw” cycles and sonification steps in buffer containing (in mM): 25 HEPES pH 7.5, 10 NaCl, 2 EGTA, and protease inhibitor cocktails (Roche Applied Science and Sigma). Membranes were sedimented by ultracentrifugation (100,000 g, 30 min, 4°C) and washed twice with 0.1 M (NH4)2CO3. After another ultracentrifugation step, membrane pellets were resuspended, sonicated, and processed by tryptic in-solution digestion (sequencing grade modified trypsin, Promega) in a methanol and NH4HCO3 buffer (Fischer et al, 2006). After removal of membranes by ultracentrifugation, samples were desalted using Spec PT C18 AR tips (Varian). Both MudPIT (2D) with seven salt steps and one-dimensional (1D) analysis were performed on an LTQ Orbitrap Velos (Thermo Fisher Scientific) according to Fränzel et al (2010) and Trötschel et al (2012). All database searches were performed using SEQUEST algorithm, embedded in Proteome Discoverer™ (Rev. 1.2.0.208 or Rev. 1.4.0.288, Thermo Fischer Scientific). Searches were done by using both an A. punctulata protein database derived from testis transcriptome and sperm genome sequencing (to be published) and an NCBI protein database for S. purpuratus proteins, in which the S. purpuratus protein sequences for the CatSper subunits 1, 2, 3, 4, GC, and CNGK were replaced by the respective A. punctulata sequences. Tryptic peptides with ≤ 2 missed cleavages were accepted. Oxidation of methionine was permitted as variable modification. The mass tolerance for precursor ions was set to 6 ppm; the mass tolerance for fragment ions was set to 0.8 amu. For search result filtering, a false discovery rate (FDR) of < 1% was applied, and ≥ 2 peptides per protein as well as peptides with search result rank 1 were required.
Co-immunoprecipitation
The monoclonal rat anti-ApCatSper 2 and anti-ApCatSper 3 antibodies APCS28G4 and RKKE4F6, respectively, were immobilized on Protein G Sepharose 4 Fast Flow (GE Healthcare). Arbacia punctulata dry sperm were suspended in lysis buffer containing in mM: 140 NaCl, 1 EDTA, 1% n-dodecyl-β-D-maltopyranoside (DDM, Anatrace), 10 Tris–HCl (pH 7.6), and protease inhibitor cocktail (Sigma). The suspension (total lysate) was centrifuged for 10 min at 10,000 × g, and the total protein content of the supernatant, containing cytosolic and solubilized membrane proteins, was determined by a BCA Assay kit (Pierce). For co-immunoprecipitation, proteins (input) were pre-incubated with fresh Protein G resin end-over-end for 30 min at 4°C. The suspension was briefly centrifuged (0.5 min, 200 × g, 4°C), and the supernatant was added to the respective antibody-coupled resin, incubated end-over-end overnight at 4°C, and centrifuged to remove the supernatant (flow through). The resin was subsequently washed five times with lysis buffer; finally, co-immunoprecipitated proteins were eluted with 1× SDS–PAGE sample buffer (2% [w/v] SDS, 50 mM Tris, 12.5% glycerin, 1% 2-mercaptoethanol, 0.01% bromphenol blue). For Western blot analysis, proteins were separated by 10% SDS–PAGE and blotted, and membranes were probed with either the anti-ApCatSper 2 or anti-ApCatSper 3 (both undiluted) antibody and visualized, using the Odyssey Imaging System (LI-COR).
For mass spectrometry analysis, (co-)immunoprecipitated proteins were separated by 10% SDS–PAGE. Gels were stained with colloidal Coomassie, containing 0.08% (w/v) Coomassie G-250, 1.6% (v/v) phosphoric acid, 8% (w/v) ammonium sulfate, and 20% (v/v) methanol, destained with 1% (v/v) acetic acid, and cut into 10 slices. Proteins in the slices were processed by tryptic in-gel digestion and analyzed by protein mass spectrometry.
Measurement of changes in intracellular Ca2+ concentration, pH, and membrane voltage
We measured changes in [Ca2+]i, pHi, and Vm in a rapid-mixing device (SFM-400; BioLogic) in the stopped-flow mode. The changes in [Ca2+]i, pHi, and Vm were measured with the Ca2+ indicator Fluo-4-AM, the pH indicator BCECF-AM, and the voltage-sensitive indicator di-8-ANEPPS (Molecular Probes), respectively (Solzin et al, 2004; Strünker et al, 2006; Bönigk et al, 2009; Kashikar et al, 2012). Dry sperm were suspended 1:6 (vol/vol) in loading buffer containing ASW and the indicator in the absence (BCECF-AM) or presence (Fluo-4-AM, di-8-ANEPPS) of 0.5% Pluronic F127 (Sigma-Aldrich or Molecular Probes). After incubation (for 45–120 min with Fluo-4-AM, 10–15 min for BCECF-AM, or 5 min for di-8-ANEPPS) at 17°C, the sample was diluted 1:20 to 1:200 with ASW. Sperm were allowed to equilibrate in the new medium for 5 min. In the stopped-flow device, the sperm suspension was rapidly mixed 1:1 (vol/vol) with the respective stimulus. Concentrations of inhibitors or ligands are given as final concentrations after mixing. Fluorescence was excited by a 150-W Xe lamp (LSB521; LOT Oriel) or a SpectraX Light Engine (Lumencor). Emission was recorded by photomultiplier modules (H9656-20; Hamamatsu Photonics). The signal was amplified and filtered through a voltage amplifier (DLPVA-100-B-S; Femto Messtechnik). Data acquisition was performed with a data acquisition pad (PCI-6221; National Instruments) and Bio-Kine software (BioLogic). For Ca2+ and Vm recordings, the excitation light was passed through either an ET490/20 nm (Chroma Technology) (Xe lamp) or a BrightLine 475/28-nm filter (Semrock) (SpectraX Light Engine). For pHi measurements, the excitation light was passed through a BrightLine 452/45-nm filter (Semrock). For Ca2+ measurements, the emitted light was passed through a BrightLine 536/40 filter (Semrock). Ca2+ signals represent the average of at least two recordings and are depicted as the percent change in fluorescence (ΔF) with respect to the mean of the first 5–10 data points before the onset of the signal (F0). The control (ASW) ΔF/F0 signal was subtracted from the NH4Cl-, pHi-clamp-, resact-, or cGMP-induced signals. The Vm signals were recorded in the ratiometric dual-emission mode. The filters in front of the two photomultipliers were BrightLine 536/40 nm and BrightLine 628/40 (Semrock). The BioLogic software was used to record fluorescence in the dual-emission mode. The Vm signals represent the ratio F536/628 (R). The control (ASW) R signal was subtracted from the resact- or cGMP-induced signals. The mean R of the first 5–10 data points before the onset of the changes in fluorescence was set to 0, yielding ΔR. The Vm signals represent the average of at least three recordings and were digitally smoothed with five-point average smoothing. The changes in di-8-ANEPPS fluorescence were calibrated to yield Vm values (mV) by mixing sperm with both resact (2 nM) and various [K+]o (Strünker et al, 2006). With increasing [K+]o, the amplitude of the resact-induced hyperpolarization decreases and, eventually, sperm depolarized. Plotting the resact-evoked ΔR versus [K+]o allows interpolation of the [K+]o at which resact does not change Vm. At this [K+]o null-point, the Nernst potential of K+ equaled Vrest before stimulation. We calculated the respective Nernst potential, assuming an intracellular K+ concentration of 423 mM. Moreover, ΔR is linearly related to [K+]o, which allows to determine ΔR/mV. Determination of Vrest and calibration of ΔR into mV was performed for each set of experiments. BCECF fluorescence was recorded in a dual-emission mode using BrightLine 494/20-nm and BrightLine 540/10-nm filters (Semrock). The pHi signals represent the ratio of F494/540, represent the average of at least two recordings, and are depicted as the percent of the relative change in ratio (ΔR/R) with respect to the mean of the first 5–10 data points before the onset of the signal. The control (ASW) signal was subtracted from the NH4Cl-, pHi-clamp-, resact-, or cGMP-induced signals.
The calibration procedure for BCECF fluorescence to yield pHi by the pHi-null-point method is described in the result section and below; pHi calibration was performed for each set of experiments. The pHi-null-point solutions were prepared according to the following equation: pHi-null = pHo – 0.5 log ([TMA]/[BA]); pHo = extracellular pH (7.8) (Eisner et al, 1989), wherein [TMA] indicates the concentration of trimethylamine and [BA] that of butyric acid. According to this equation, each [TMA]/[BA] ratio defines a new pHi or pHi-null-point. When a cell with a resting pHi (pHrest) is placed in a pHi-null-point solution, it will not change its pHi when the pHi-null-point solution matches pHrest. If the null-point is more alkaline than pHrest, the cell will alkalize; if the null-point is more acidic, then the cell will acidify. Monitoring the changes in pHi after mixing sperm with various null-point solutions allows interpolating pHrest. When the pHi-null-point does not match pHrest, the absolute concentrations of acid and base determine to what extent the pHi of a cell will change (Chow et al, 1996): The higher the concentrations of the acid/base mixture, the more the pHi will be shifted toward the pHi-null-point. At saturation, the newly established pHi matches the pHi-null-point; thus, the cell is clamped to a new pHi. Therefore, we refer to this saturating pHi-null-point solution as pHi-clamp solution. Finally, the time course of pHi determines the time window for which this pHi-clamp concept holds. To ensure that in A. punctulata sperm, the pHi was indeed clamped to the pHi-null-point for several tens of seconds, we determined for each pHi-null-point solution, i.e. for each TMA/BA ratio, the molar concentrations of TMA and BA required to produce saturating changes in pHi (Supplementary Fig S9). The pHi-clamp solutions that clamped pHi in A. punctulata sperm to pHi-null all contained 60 mM BA, whereas the TMA concentration was varied to yield the respective pHi-null; for example, for the pHi-null 7.0 solution, we used 1.5071 mM TMA/60 mM BA, for the pHi-null 7.2 solution, 3.7857 mM TMA/60 mM BA, etc. Addition of TMA and BA increased the osmolarity of the ASW by < 13%.
Caged compounds and flash photolysis
DEACM-caged cGMP and DMNB-caged resact were obtained from V. Hagen (Leibniz-Institut für Molekulare Pharmakologie, Berlin) (Hagen et al, 2003; Kaupp et al, 2003). For Ca2+ recordings, sperm were diluted 1:6 in loading buffer (ASW) containing Fluo-4-AM and 30 μM DEACM-caged cGMP for ≥ 45 min (Kaupp et al, 2003). For pHi recordings, sperm were incubated first with 30 μM DEACM-caged cGMP for ≥ 40 min followed by incubation for another 10–15 min with BCECF-AM. After loading, sperm were diluted 1:20 to 1:200 for stopped-flow experiments. For experiments with DMNB-caged resact, sperm were first loaded with Fluo-4-AM; after loading, the sample was diluted 1:20 to 1:200 with ASW containing 1 μM DMNB-caged resact. Sperm were allowed to equilibrate in the new medium for 5 min. In the stopped-flow device, the sperm suspension was rapidly mixed 1:1 (vol/vol) with ASW (control) or the respective inhibitors. About 2–5 s after mixing, caged cGMP and caged resact were photolyzed by a UV flash (∼1 ms) from a Xenon flash lamp (JML-C2; Rapp OptoElectronic). The UV flash was passed through a bandpass 295- to 395-nm interference filter (Rapp OptoElectronic) and delivered by a liquid light guide to the cuvette (FC-15; BioLogic) of the stopped-flow device.
Sperm chemotaxis
Sperm accumulation in a resact gradient was studied as described with some modifications (Alvarez et al, 2012; Hirohashi et al, 2013). In brief, sperm swimming in a recording chamber (150 μm depth) were imaged using a microscope (IX71; Olympus) equipped with a 10× objective (UPlanSApo; NA 0.4; Olympus). Stroboscopic dark-field illumination (2 ms pulses) was achieved using a white LED (K2 star; Luxeon), a custom-made housing, and a pulse generator. Images were bandpass-filtered (HQ520/40; Chroma) and acquired at 20 Hz, using an electron-multiplying charge-coupled device camera (DU-897D; Andor). Sperm were suspended at about 108 cells/ml in ASW containing caged resact (50 nM; control) or caged resact and MDL 12330A (10 μM) or mibefradil (60 μM). Resact was released by 400-ms UV flashes (LED M365L2-C1; Thorlabs) with a Gaussian profile of σ = 178 μm width, coupled to the microscope using a beam splitter (495 nm cutoff, BrightLine; Semrock). The light power delivered to the sample was 1.7 mW. The sperm distribution around the center of the illuminated area was quantified by the relative changes of the weighted standard distance (Alvarez et al, 2012; Hirohashi et al, 2013). Only points within a distance ≤ 2σ to the center of the UV flash were considered. The uncaging gradient was quantified by imaging fluorescein (10 μM) with the same UV light source and optical components.
Data analysis
The data obtained from the stopped-flow recordings were analyzed using Prism 5 (GraphPad Software) and OriginPro 8.1G SR3 (OriginLab Corporation). All data are given as mean ± standard deviation.
Acknowledgments
We thank K.M. Dressler and Rene Pascal for technical assistance, H. Krause for preparing the manuscript, and D. Ren (University of Pennsylvania, Philadelphia, USA) for providing us with the S. purpuratus cDNA clones encoding CatSper 2 and CatSper 3. This work was supported by the German Research Foundation (SFB645).
Author contributions
RS and TS conceived the project. RS, MF, WB, LA, CT, AP, AM, NG, PP, NDK, EK, JJ, BT, HK, DF, FW, UBK, and TS designed and performed experiments. TS, RS, and UBK wrote the manuscript. All authors revised the manuscript.
Conflict of interest
The authors declare that they have no conflict of interest.
Supporting Information
Supplementary Figure S1
Supplementary Figure S2
Supplementary Figure S3
Supplementary Figure S4
Supplementary Figure S5
Supplementary Figure S6
Supplementary Figure S7
Supplementary Figure S8
Supplementary Figure S9
Supplementary Table S1
Supplementary Table S2
Legends for Supplementary Figures and Movies
Supplementary Movie S1
Supplementary Movie S2
Review Process File
Source Data for Figure 1C
Source Data for Figure 1E
References
- Aitken RJ, Kelly RW. Analysis of the direct effects of prostaglandins on human sperm function. J Reprod Fertil. 1985;73:139–146. doi: 10.1530/jrf.0.0730139. [DOI] [PubMed] [Google Scholar]
- Alasmari W, Costello S, Correia J, Oxenham SK, Morris J, Fernandes L, Ramalho-Santos J, Kirkman-Brown J, Michelangeli F, Publicover S, Barratt CL. Ca2+ signals generated by CatSper and Ca2+ stores regulate different behaviors in human sperm. J Biol Chem. 2013;288:6248–6258. doi: 10.1074/jbc.M112.439356. [DOI] [PMC free article] [PubMed] [Google Scholar]
- Alvarez L, Dai L, Friedrich BM, Kashikar ND, Gregor I, Pascal R, Kaupp UB. The rate of change in Ca2+ concentration controls sperm chemotaxis. J Cell Biol. 2012;196:653–663. doi: 10.1083/jcb.201106096. [DOI] [PMC free article] [PubMed] [Google Scholar]
- Alvarez L, Friedrich BM, Gompper G, Kaupp UB. The computational sperm cell. Trends Cell Biol. 2014;24:198–207. doi: 10.1016/j.tcb.2013.10.004. [DOI] [PubMed] [Google Scholar]
- Avenarius MR, Hildebrand MS, Zhang Y, Meyer NC, Smith LL, Kahrizi K, Najmabadi H, Smith RJ. Human male infertility caused by mutations in the CATSPER1 channel protein. Am J Hum Genet. 2009;84:505–510. doi: 10.1016/j.ajhg.2009.03.004. [DOI] [PMC free article] [PubMed] [Google Scholar]
- Babcock DF, Bosma MM, Battaglia DE, Darszon A. Early persistent activation of sperm K+ channels by the egg peptide speract. Proc Natl Acad Sci USA. 1992;89:6001–6005. doi: 10.1073/pnas.89.13.6001. [DOI] [PMC free article] [PubMed] [Google Scholar]
- Baldi E, Luconi M, Muratori M, Marchiani S, Tamburrino L, Forti G. Nongenomic activation of spermatozoa by steroid hormones: facts and fictions. Mol Cell Endocrinol. 2009;308:39–46. doi: 10.1016/j.mce.2009.02.006. [DOI] [PubMed] [Google Scholar]
- Beltrán C, Zapata O, Darszon A. Membrane potential regulates sea urchin sperm adenylylcyclase. Biochemistry. 1996;35:7591–7598. doi: 10.1021/bi952806v. [DOI] [PubMed] [Google Scholar]
- Bentley JK, Tubb DJ, Garbers DL. Receptor-mediated activation of spermatozoan guanylate cyclase. J Biol Chem. 1986;261:14859–14862. [PubMed] [Google Scholar]
- Bentley JK, Khatra AS, Garbers DL. Receptor-mediated activation of detergent-solubilized guanylate cyclase. Biol Reprod. 1988;39:639–647. doi: 10.1095/biolreprod39.3.639. [DOI] [PubMed] [Google Scholar]
- Böhmer M, Van Q, Weyand I, Hagen V, Beyermann M, Matsumoto M, Hoshi M, Hildebrand E, Kaupp UB. Ca2+ spikes in the flagellum control chemotactic behavior of sperm. EMBO J. 2005;24:2741–2752. doi: 10.1038/sj.emboj.7600744. [DOI] [PMC free article] [PubMed] [Google Scholar]
- Bond J, Varley J. Use of flow cytometry and SNARF to calibrate and measure intracellular pH in NS0 cells. Cytometry A. 2005;64:43–50. doi: 10.1002/cyto.a.20066. [DOI] [PubMed] [Google Scholar]
- Bönigk W, Loogen A, Seifert R, Kashikar N, Klemm C, Krause E, Hagen V, Kremmer E, Strünker T, Kaupp UB. An atypical CNG channel activated by a single cGMP molecule controls sperm chemotaxis. Sci Signal. 2009;2:ra68. doi: 10.1126/scisignal.2000516. [DOI] [PubMed] [Google Scholar]
- Brenker C, Goodwin N, Weyand I, Kashikar ND, Naruse M, Krähling M, Müller A, Kaupp UB, Strünker T. The CatSper channel: a polymodal chemosensor in human sperm. EMBO J. 2012;31:1654–1665. doi: 10.1038/emboj.2012.30. [DOI] [PMC free article] [PubMed] [Google Scholar]
- Brenker C, Zhou Y, Müller A, Echeverry FA, Trötschel C, Poetsch A, Xia XM, Bönigk W, Lingle CJ, Kaupp UB, Strünker T. The Ca2+-activated K+ current of human sperm is mediated by Slo3. eLife. 2014;3:e01438. doi: 10.7554/eLife.01438. [DOI] [PMC free article] [PubMed] [Google Scholar]
- Cai X, Clapham DE. Evolutionary genomics reveals lineage-specific gene loss and rapid evolution of a sperm-specific ion channel complex: CatSpers and CatSperbeta. PLoS ONE. 2008;3:e3569. doi: 10.1371/journal.pone.0003569. [DOI] [PMC free article] [PubMed] [Google Scholar]
- Chavez JC, Ferreira Gregorio J, Butler A, Trevino CL, Darszon A, Salkoff L, Santi CM. SLO3 K+ channels control calcium entry through CATSPER channels in sperm. J Biol Chem. 2014;289:32266–32275. doi: 10.1074/jbc.M114.607556. [DOI] [PMC free article] [PubMed] [Google Scholar]
- Chow S, Hedley D, Tannock I. Flow cytometric calibration of intracellular pH measurements in viable cells using mixtures of weak acids and bases. Cytometry. 1996;24:360–367. doi: 10.1002/(SICI)1097-0320(19960801)24:4<360::AID-CYTO7>3.0.CO;2-J. [DOI] [PubMed] [Google Scholar]
- Chung JJ, Navarro B, Krapivinsky G, Krapivinsky L, Clapham DE. A novel gene required for male fertility and functional CATSPER channel formation in spermatozoa. Nat Commun. 2011;2:153. doi: 10.1038/ncomms1153. [DOI] [PMC free article] [PubMed] [Google Scholar]
- Chung JJ, Shim SH, Everley RA, Gygi SP, Zhuang X, Clapham DE. Structurally distinct Ca2+ signaling domains of sperm flagella orchestrate tyrosine phosphorylation and motility. Cell. 2014;157:808–822. doi: 10.1016/j.cell.2014.02.056. [DOI] [PMC free article] [PubMed] [Google Scholar]
- Cook SP, Babcock DF. Selective modulation by cGMP of the K+ channel activated by speract. J Biol Chem. 1993;268:22402–22407. [PubMed] [Google Scholar]
- Dangott LJ, Garbers DL. Identification and partial characterization of the receptor for speract. J Biol Chem. 1984;259:13712–13716. [PubMed] [Google Scholar]
- Dangott LJ, Jordan JE, Bellet RA, Garbers DL. Cloning of the mRNA for the protein that crosslinks to the egg peptide speract. Proc Natl Acad Sci USA. 1989;86:2128–2132. doi: 10.1073/pnas.86.7.2128. [DOI] [PMC free article] [PubMed] [Google Scholar]
- Darszon A, Guerrero A, Galindo BE, Nishigaki T, Wood CD. Sperm-activating peptides in the regulation of ion fluxes, signal transduction and motility. Int J Dev Biol. 2008;52:595–606. doi: 10.1387/ijdb.072550ad. [DOI] [PubMed] [Google Scholar]
- Eisenbach M, Giojalas LC. Sperm guidance in mammals – an unpaved road to the egg. Nat Rev Mol Cell Biol. 2006;7:276–285. doi: 10.1038/nrm1893. [DOI] [PubMed] [Google Scholar]
- Eisner DA, Kenning NA, O'Neill SC, Pocock G, Richards CD, Valdeolmillos M. A novel method for absolute calibration of intracellular pH indicators. Pflugers Arch. 1989;413:553–558. doi: 10.1007/BF00594188. [DOI] [PubMed] [Google Scholar]
- Fischer F, Wolters D, Rogner M, Poetsch A. Toward the complete membrane proteome: high coverage of integral membrane proteins through transmembrane peptide detection. Mol Cell Proteomics. 2006;5:444–453. doi: 10.1074/mcp.M500234-MCP200. [DOI] [PubMed] [Google Scholar]
- Florman HM, Jungnickel MK, Sutton KA. Regulating the acrosome reaction. Int J Dev Biol. 2008;52:503–510. doi: 10.1387/ijdb.082696hf. [DOI] [PubMed] [Google Scholar]
- Fränzel B, Trötschel C, Ruckert C, Kalinowski J, Poetsch A, Wolters DA. Adaptation of Corynebacterium glutamicum to salt-stress conditions. Proteomics. 2010;10:445–457. doi: 10.1002/pmic.200900482. [DOI] [PubMed] [Google Scholar]
- Frohman MA, Dush MK, Martin GR. Rapid production of full-length cDNAs from rare transcripts: amplification using a single gene-specific oligonucleotide primer. Proc Natl Acad Sci USA. 1988;85:8998–9002. doi: 10.1073/pnas.85.23.8998. [DOI] [PMC free article] [PubMed] [Google Scholar]
- Galindo BE, Neill AT, Vacquier VD. A new hyperpolarization-activated, cyclic nucleotide-gated channel from sea urchin sperm flagella. Biochem Biophys Res Commun. 2005;334:96–101. doi: 10.1016/j.bbrc.2005.06.074. [DOI] [PubMed] [Google Scholar]
- Galindo BE, de la Vega-Beltrán JL, Labarca P, Vacquier VD, Darszon A. Sp-tetraKCNG: a novel cyclic nucleotide gated K+ channel. Biochem Biophys Res Commun. 2007;354:668–675. doi: 10.1016/j.bbrc.2007.01.035. [DOI] [PubMed] [Google Scholar]
- Gauss R, Seifert R, Kaupp UB. Molecular identification of a hyperpolarization-activated channel in sea urchin sperm. Nature. 1998;393:583–587. doi: 10.1038/31248. [DOI] [PubMed] [Google Scholar]
- Gonzáles-Martínez MT, Guerrero A, Morales E, de De la Torre L, Darszon A. A depolarization can trigger Ca2+ uptake and the acrosome reaction when preceded by a hyperpolarization in L. pictus sea urchin sperm. Dev Biol. 1992;150:193–202. doi: 10.1016/0012-1606(92)90018-c. [DOI] [PubMed] [Google Scholar]
- Guerrero A, García L, Zapata O, Rodríguez E, Darszon A. Acrosome reaction inactivation in sea urchin sperm. Biochim Biophys Acta. 1998;1401:329–338. doi: 10.1016/s0167-4889(97)00127-4. [DOI] [PubMed] [Google Scholar]
- Guerrero A, Nishigaki T, Carneiro J, Yoshiro T, Wood CD, Darszon A. Tuning sperm chemotaxis by calcium burst timing. Dev Biol. 2010a;344:52–65. doi: 10.1016/j.ydbio.2010.04.013. [DOI] [PubMed] [Google Scholar]
- Guerrero A, Wood CD, Nishigaki T, Carneiro J, Darszon A. Tuning sperm chemotaxis. Biochem Soc Trans. 2010b;38:1270–1274. doi: 10.1042/BST0381270. [DOI] [PubMed] [Google Scholar]
- Hagen V, Frings S, Wiesner B, Helm S, Kaupp UB, Bendig J. [7-(Dialkylamino)coumarin-4-yl]methyl-caged compounds as ultrafast and effective long-wavelength phototriggers of 8-bromo-substituted cyclic nucleotides. Chembiochem. 2003;4:434–442. doi: 10.1002/cbic.200300561. [DOI] [PubMed] [Google Scholar]
- Hildebrand MS, Avenarius MR, Fellous M, Zhang Y, Meyer NC, Auer J, Serres C, Kahrizi K, Najmabadi H, Beckmann JS, Smith RJ. Genetic male infertility and mutation of CATSPER ion channels. Eur J Hum Genet. 2010;18:1178–1184. doi: 10.1038/ejhg.2010.108. [DOI] [PMC free article] [PubMed] [Google Scholar]
- Hirohashi N, Alvarez L, Shiba K, Fujiwara E, Iwata Y, Mohri T, Inaba K, Chiba K, Ochi H, Supuran CT, Kotzur N, Kakiuchi Y, Kaupp UB, Baba SA. Sperm from sneaker male squids exhibit chemotactic swarming to CO2. Curr Biol. 2013;23:775–781. doi: 10.1016/j.cub.2013.03.040. [DOI] [PubMed] [Google Scholar]
- Ho H-C, Suarez SS. Hyperactivation of mammalian spermatozoa: function and regulation. Reproduction. 2001;122:519–526. doi: 10.1530/rep.0.1220519. [DOI] [PubMed] [Google Scholar]
- Ho K, Wolff CA, Suarez SS. CatSper-null mutant spermatozoa are unable to ascend beyond the oviductal reservoir. Reprod Fertil Dev. 2009;21:345–350. doi: 10.1071/rd08183. [DOI] [PubMed] [Google Scholar]
- Kashikar ND, Alvarez L, Seifert R, Gregor I, Jäckle O, Beyermann M, Krause E, Kaupp UB. Temporal sampling, resetting, and adaptation orchestrate gradient sensing in sperm. J Cell Biol. 2012;198:1075–1091. doi: 10.1083/jcb.201204024. [DOI] [PMC free article] [PubMed] [Google Scholar]
- Kaupp UB, Solzin J, Hildebrand E, Brown JE, Helbig A, Hagen V, Beyermann M, Pampaloni F, Weyand I. The signal flow and motor response controling chemotaxis of sea urchin sperm. Nat Cell Biol. 2003;5:109–117. doi: 10.1038/ncb915. [DOI] [PubMed] [Google Scholar]
- Kaupp UB, Kashikar ND, Weyand I. Mechanisms of sperm chemotaxis. Annu Rev Physiol. 2008;70:93–117. doi: 10.1146/annurev.physiol.70.113006.100654. [DOI] [PubMed] [Google Scholar]
- Kaupp UB. 100 years of sperm chemotaxis. J Gen Physiol. 2012;140:583–586. doi: 10.1085/jgp.201210902. [DOI] [PMC free article] [PubMed] [Google Scholar]
- Kirichok Y, Navarro B, Clapham DE. Whole-cell patch-clamp measurements of spermatozoa reveal an alkaline-activated Ca2+ channel. Nature. 2006;439:737–740. doi: 10.1038/nature04417. [DOI] [PubMed] [Google Scholar]
- Kirkman-Brown JC, Smith DJ. Sperm motility: is viscosity fundamental to progress? Mol Hum Reprod. 2011;17:539–544. doi: 10.1093/molehr/gar043. [DOI] [PubMed] [Google Scholar]
- Lee HC. A membrane potential-sensitive Na+-H+ exchange system in flagella isolated from sea urchin spermatozoa. J Biol Chem. 1984a;259:15315–15319. [PubMed] [Google Scholar]
- Lee HC. Sodium and proton transport in flagella isolated from sea urchin spermatozoa. J Biol Chem. 1984b;259:4957–4963. [PubMed] [Google Scholar]
- Lee HC, Garbers DL. Modulation of the voltage-sensitive Na+/H+ exchange in sea urchin spermatozoa through membrane potential changes induced by the egg peptide speract. J Biol Chem. 1986;261:16026–16032. [PubMed] [Google Scholar]
- Lishko PV, Botchkina IL, Fedorenko A, Kirichok Y. Acid extrusion from human spermatozoa is mediated by flagellar voltage-gated proton channel. Cell. 2010;140:327–337. doi: 10.1016/j.cell.2009.12.053. [DOI] [PubMed] [Google Scholar]
- Lishko PV, Botchkina IL, Kirichok Y. Progesterone activates the principal Ca2+ channel of human sperm. Nature. 2011;471:387–391. doi: 10.1038/nature09767. [DOI] [PubMed] [Google Scholar]
- Liu J, Xia J, Cho KH, Clapham DE, Ren D. CatSperbeta, a novel transmembrane protein in the CatSper channel complex. J Biol Chem. 2007;282:18945–18952. doi: 10.1074/jbc.M701083200. [DOI] [PubMed] [Google Scholar]
- Lobley A, Pierron V, Reynolds L, Allen L, Michalovich D. Identification of human and mouse CatSper3 and CatSper4 genes: characterisation of a common interaction domain and evidence for expression in testis. Reprod Biol Endocrinol. 2003;1:53. doi: 10.1186/1477-7827-1-53. [DOI] [PMC free article] [PubMed] [Google Scholar]
- Mengerink KJ, Vacquier VD. Isolation of sea urchin sperm plasma membranes. Methods Mol Biol. 2004;253:141–150. doi: 10.1385/1-59259-744-0:141. [DOI] [PubMed] [Google Scholar]
- Miki K, Clapham DE. Rheotaxis guides Mammalian sperm. Curr Biol. 2013;23:443–452. doi: 10.1016/j.cub.2013.02.007. [DOI] [PMC free article] [PubMed] [Google Scholar]
- Navarro B, Kirichok Y, Chung JJ, Clapham DE. Ion channels that control fertility in mammalian spermatozoa. Int J Dev Biol. 2008;52:607–613. doi: 10.1387/ijdb.072554bn. [DOI] [PMC free article] [PubMed] [Google Scholar]
- Nishigaki T, Zamudio FZ, Possani LD, Darszon A. Time-resolved sperm responses to an egg peptide measured by stopped-flow fluorometry. Biochem Biophys Res Commun. 2001;284:531–535. doi: 10.1006/bbrc.2001.5000. [DOI] [PubMed] [Google Scholar]
- Nomura M, Vacquier VD. Proteins associated with soluble adenylyl cyclase in sea urchin sperm flagella. Cell Motil Cytoskeleton. 2006;63:582–590. doi: 10.1002/cm.20147. [DOI] [PubMed] [Google Scholar]
- Oren-Benaroya R, Orvieto R, Gakamsky A, Pinchasov M, Eisenbach M. The sperm chemoattractant secreted from human cumulus cells is progesterone. Hum Reprod. 2008;23:2339–2345. doi: 10.1093/humrep/den265. [DOI] [PubMed] [Google Scholar]
- Pichlo M, Bungert-Plumke S, Weyand I, Seifert R, Bonigk W, Strunker T, Kashikar ND, Goodwin N, Muller A, Pelzer P, Van Q, Enderlein J, Klemm C, Krause E, Trotschel C, Poetsch A, Kremmer E, Kaupp UB. High density and ligand affinity confer ultrasensitive signal detection by a guanylyl cyclase chemoreceptor. J Cell Biol. 2014;206:541–557. doi: 10.1083/jcb.201402027. [DOI] [PMC free article] [PubMed] [Google Scholar]
- Publicover SJ, Giojalas LC, Teves ME, de Oliveira GS, Garcia AA, Barratt CL, Harper CV. Ca2+ signalling in the control of motility and guidance in mammalian sperm. Front Biosci. 2008;13:5623–5637. doi: 10.2741/3105. [DOI] [PubMed] [Google Scholar]
- Qi H, Moran MM, Navarro B, Chong JA, Krapivinsky G, Krapivinsky L, Kirichok Y, Ramsey IS, Quill TA, Clapham DE. All four CatSper ion channel proteins are required for male fertility and sperm cell hyperactivated motility. Proc Natl Acad Sci USA. 2007;104:1219–1223. doi: 10.1073/pnas.0610286104. [DOI] [PMC free article] [PubMed] [Google Scholar]
- Quill TA, Ren D, Clapham D, Garbers DL. A voltage-gated ion channel expressed specifically in spermatozoa. Proc Natl Acad Sci USA. 2001;98:12527–12531. doi: 10.1073/pnas.221454998. [DOI] [PMC free article] [PubMed] [Google Scholar]
- Ren D, Navarro B, Perez G, Jackson AC, Hsu S, Shi Q, Tilly JL, Clapham DE. A sperm ion channel required for sperm motility and male fertility. Nature. 2001;413:603–609. doi: 10.1038/35098027. [DOI] [PMC free article] [PubMed] [Google Scholar]
- Reynaud E, de De la Torre L, Zapata O, Liévano A, Darszon A. Ionic bases of the membrane potential and intracellular pH changes induced by speract in swollen sea urchin sperm. FEBS Lett. 1993;329:210–214. doi: 10.1016/0014-5793(93)80223-h. [DOI] [PubMed] [Google Scholar]
- Santi CM, Martinez-Lopez P, de la Vega-Beltran JL, Butler A, Alisio A, Darszon A, Salkoff L. The SLO3 sperm-specific potassium channel plays a vital role in male fertility. FEBS Lett. 2010;584:1041–1046. doi: 10.1016/j.febslet.2010.02.005. [DOI] [PMC free article] [PubMed] [Google Scholar]
- Schiffer C, Müller A, Egeberg DL, Alvarez L, Brenker C, Rehfeld A, Frederiksen H, Wäschle B, Kaupp UB, Balbach M, Wachten D, Skakkebaek NE, Almstrup K, Strünker T. Direct action of endocrine disrupting chemicals on human sperm. EMBO Rep. 2014;15:758–765. doi: 10.15252/embr.201438869. [DOI] [PMC free article] [PubMed] [Google Scholar]
- Shimomura H, Garbers DL. Differential effects of resact analogues on sperm respiration rates and cyclic nucleotide concentrations. Biochemistry. 1986;25:3405–3410. doi: 10.1021/bi00359a046. [DOI] [PubMed] [Google Scholar]
- Smith JF, Syritsyna O, Fellous M, Serres C, Mannowetz N, Kirichok Y, Lishko PV. Disruption of the principal, progesterone-activated sperm Ca2+ channel in a CatSper2-deficient infertile patient. Proc Natl Acad Sci USA. 2013;110:6823–6828. doi: 10.1073/pnas.1216588110. [DOI] [PMC free article] [PubMed] [Google Scholar]
- Solzin J, Helbig A, Van Q, Brown JE, Hildebrand E, Weyand I, Kaupp UB. Revisiting the role of H+ in chemotactic signaling of sperm. J Gene Physiol. 2004;124:115–124. doi: 10.1085/jgp.200409030. [DOI] [PMC free article] [PubMed] [Google Scholar]
- Strünker T, Weyand I, Bönigk W, Van Q, Loogen A, Brown JE, Kashikar N, Hagen V, Krause E, Kaupp UB. A K+ -selective cGMP-gated ion channel controls chemosensation of sperm. Nat Cell Biol. 2006;8:1149–1154. doi: 10.1038/ncb1473. [DOI] [PubMed] [Google Scholar]
- Strünker T, Goodwin N, Brenker C, Kashikar ND, Weyand I, Seifert R, Kaupp UB. The CatSper channel mediates progesterone-induced Ca2+ influx in human sperm. Nature. 2011;471:382–386. doi: 10.1038/nature09769. [DOI] [PubMed] [Google Scholar]
- Suarez SS, Pacey AA. Sperm transport in the female reproductive tract. Hum Reprod Update. 2006;12:23–37. doi: 10.1093/humupd/dmi047. [DOI] [PubMed] [Google Scholar]
- Suarez SS. Regulation of sperm storage and movement in the mammalian oviduct. Int J Dev Biol. 2008;52:455–462. doi: 10.1387/ijdb.072527ss. [DOI] [PubMed] [Google Scholar]
- Swietach P, Tiffert T, Mauritz JM, Seear R, Esposito A, Kaminski CF, Lew VL, Vaughan-Jones RD. Hydrogen ion dynamics in human red blood cells. J Physiol. 2010;588:4995–5014. doi: 10.1113/jphysiol.2010.197392. [DOI] [PMC free article] [PubMed] [Google Scholar]
- Tavares RS, Mansell S, Barratt CL, Wilson SM, Publicover SJ, Ramalho-Santos J. p,p′-DDE activates CatSper and compromises human sperm function at environmentally relevant concentrations. Hum Reprod. 2013;28:3167–3177. doi: 10.1093/humrep/det372. [DOI] [PMC free article] [PubMed] [Google Scholar]
- Teves ME, Guidobaldi HA, Unates DR, Sanchez R, Miska W, Publicover SJ, Morales Garcia AA, Giojalas LC. Molecular mechanism for human sperm chemotaxis mediated by progesterone. PLoS ONE. 2009;4:e8211. doi: 10.1371/journal.pone.0008211. [DOI] [PMC free article] [PubMed] [Google Scholar]
- Trötschel C, Albaum SP, Wolff D, Schröder S, Goesmann A, Nattkemper TW, Poetsch A. Protein turnover quantification in a multilabeling approach: from data calculation to evaluation. Mol Cell Proteomics. 2012;11:512–526. doi: 10.1074/mcp.M111.014134. [DOI] [PMC free article] [PubMed] [Google Scholar]
- Wang D, King SM, Quill TA, Doolittle LK, Garbers DL. A new sperm-specific Na+/H+ exchanger required for sperm motility and fertility. Nat Cell Biol. 2003;5:1117–1122. doi: 10.1038/ncb1072. [DOI] [PubMed] [Google Scholar]
- Wang H, Liu J, Cho KH, Ren D. A novel, single, transmembrane protein CATSPERG is associated with CATSPER1 channel protein. Biol Reprod. 2009;81:539–544. doi: 10.1095/biolreprod.109.077107. [DOI] [PMC free article] [PubMed] [Google Scholar]
- Wood CD, Nishigaki T, Furuta T, Baba SA, Darszon A. Real-time analysis of the role of Ca2+ in flagellar movement and motility in single sea urchin sperm. J Cell Biol. 2005;169:725–731. doi: 10.1083/jcb.200411001. [DOI] [PMC free article] [PubMed] [Google Scholar]
- Zeng XH, Yang C, Kim ST, Lingle CJ, Xia XM. Deletion of the Slo3 gene abolishes alkalization-activated K+ current in mouse spermatozoa. Proc Natl Acad Sci USA. 2011;108:5879–5884. doi: 10.1073/pnas.1100240108. [DOI] [PMC free article] [PubMed] [Google Scholar]
- Zeng XH, Navarro B, Xia XM, Clapham DE, Lingle CJ. Simultaneous knockout of Slo3 and CatSper1 abolishes all alkalization- and voltage-activated current in mouse spermatozoa. J Gene Physiol. 2013;142:305–313. doi: 10.1085/jgp.201311011. [DOI] [PMC free article] [PubMed] [Google Scholar]
Associated Data
This section collects any data citations, data availability statements, or supplementary materials included in this article.
Supplementary Materials
Supplementary Figure S1
Supplementary Figure S2
Supplementary Figure S3
Supplementary Figure S4
Supplementary Figure S5
Supplementary Figure S6
Supplementary Figure S7
Supplementary Figure S8
Supplementary Figure S9
Supplementary Table S1
Supplementary Table S2
Legends for Supplementary Figures and Movies
Supplementary Movie S1
Supplementary Movie S2
Review Process File
Source Data for Figure 1C
Source Data for Figure 1E