

Abstract
Hypoxia in solid tumors is one of the seminal mechanisms for developing aggressive trait and treatment resistsance in solid tumors. This evolutionarily conserved biological mechanism along with de-repression of cellular functions in cancer, although resulting in many challenges, provide us with opportunities to use these adversities to our advantage. Our ability to use molecular imaging to characterize therapeutic targets such as hypoxia and apply this information for therapeutic interventions is growing rapidly. Evaluation of hypoxia and its biological ramifications to effectively plan appropriate therapy that can overcome the cure-limiting effects of hypoxia provides an objective means for treatment selection and planning. FMISO PET imaging of tumor hypoxia continues to be the lead radiopharmaceutical for the evaluation, prognostication and quantification of hypoxia, one of the key elements of the tumor microenvironment. FMISO is less confounded by blood flow and, although the images have less contrast than FDG PET, its uptake after 2 hours is an accurate reflection of inadequate regional Po2 at the time of radiopharmaceutical administration. By virtue of extensive clinical utilization, FMISO remains the lead candidate for imaging and quantifying hypoxia. The past decade has seen significant technological advances in investigating hypoxia imaging in radiation treatment planning and in providing us with the ability to individualize radiation delivery and target volume coverage. The presence of widespread hypoxia in the tumor can be effectively targeted with a systemic hypoxic cell cytotoxin or other agents that are more effective with diminished PO2, either alone or in combination. Molecular imaging in general and hypoxia imaging in particular will likely become an important in vivo imaging biomarker of the future, complementing the traditional direct tissue sampling methods by providing a snap shot of a primary tumor and metastatic disease and in following treatment response and will serve as adjunct to personalized therapy.
Introduction
Several novel targeted anticancer agents and modalities have been introduced for personalized cancer therapy providing new opportunities for molecular imaging in localizing and characterizing targets. Molecular imaging has the potential to be an in vivo ‘biopsy’ since it has the ability to non-invasively image the targets in the primary and metastatic lesions in a snap-shot fashion. 1 Intra-tumoral heterogeneity remains one of the major challenges facing personalized cancer therapy both in the identification of targets and instituting therapy against them. However, the ultimate goal of personalized therapy remains to achieve cure by blocking the multiple pathways of cancer development and proliferation. 2. Hypoxia, one of the major microenvironmental factors, was described by Thomlinson and Gray in 1955 and still remains a stubborn and intriguing problem in cancer management. 3. The dawn of molecular imaging coupled with the availability of an expanding array of molecular probes is augmenting the role of molecular medicine in the treatment of cancer 4. This is complemented by technological advances in radiation delivery such as Intensity Modulated Radiotherapy (IMRT) and availability of novel therapeutic agents 5, making personalized cancer therapy a real possibility. 6–9, 10
Development of hypoxia in the tumor microenvironment is a dynamic process that is primarily dictated by abnormal vasculature and results in changes in metabolism and cellular proliferation. A clear understanding of the role of these processes and the interactions between them is important when considering personalized cancer therapy. 4. Typically, focal areas of hypoxia develop in many solid tumors (generally in the center of the tumor) as they grow and because of direct consequences of unregulated cellular growth that results in a greater demand on oxygen (as well as other nutrients) for energy metabolism. Hypoxia response is one of the many de-repression ‘atavistic’ traits by multicellular organisms in an attempt to express primitive unicellular characteristics as a means of ‘cellular survivalism’11. Cancer cells revert back to primitive protozoan like functions that exist quiescently in any normal cell but can be de-repressed by carcinogenic transformation. The ability to survive the lack of oxygen or hypoxia is one such trait, and hypoxia response itself is a characteristic pre-photosynthesis biological trait when there was lack of molecular oxygen in the atmosphere; this response trait is evolutionarily highly conserved in nature as exemplified by the stabilization mechanism of HIF1α under hypoxic conditions.
Hypoxia-Induced Changes in Tumor Behavior
A number of hypoxia-related genes have been found to be responsible for the genomic changes and associated downstream transcription factors have been identified 12, 13 e.g. expression of endothelial cytokines such as vascular endothelial growth factor (VEGF) and signaling molecules such as IL-1, TNF- alpha, and TGF – beta, and selection of cells with mutated p53 expression 14 and increased glucose transporter (GLUT) activity 15. The paradoxical relationship between microvascular density that is already inefficient and tumor hypoxia has been well characterized 16. Increased glycolysis seen in most hypoxic cells results in accumulation of lactate in the microenvironment that will lead to a reduction of glycolytic activity inspite of hypoxia, a mechanism that would reduce the specificity of [F18]fluorodeoxyglucose (FDG) as a surrogate marker for hypoxia. Moreover, hypoxia and resultant acidosis create an environment conducive for tumor progression and the development of metastases as well as therapy-resistant clones and this hypoxia-induced metastatic phenotype may be one of the reasons for the lack luster success of anti-angiogenic drugs. 17, 18
Hypoxia Inducible Factor (HIF)
The seminal mechanism for cellular oxygen sensing and response appears to be mediated by a heme-protein that uses O2 as a substrate to catalyze hydroxylation of proline in a segment of HIF1α 19, 20,21, leading to its degradation. In the absence of O2, it survives and becomes an important transcription factor regulated proteins that promote survival of tumor cells. There are hypoxia-directed therapies including reagents against HIF1α itself. 18, 22. 23, 24.
Tumor Hypoxia and Clinical Outcome
Negative influence of hypoxia on response to radiation therapy has long been recognized by radiobiologists with the understanding that oxygen is necessary for ‘fixing’ in the sense of making permanent the radiation-induced products in tissues. 25. Clinical and laboratory experience indicates that it can take three times as much photon radiation dose to cause the same cytotoxic effect in hypoxic cells as compared to normoxic cells 26. Boost radiation to a hypoxic sub-volume could be effectively delivered with modern IMRT techniques. In addition to radioresistance, under hypoxic conditions the viable cells become more aggressive, resulting in poor overall outcome due to several mechanisms, including increased metastatic potential 27, 28. Similar to resistance to radiation, hypoxia has been found to promote resistance to a number of chemotherapeutic agents as well, by related but independent mechanisms. 29–31.
The unique biological changes induced by hypoxia in a solid tumor have been investigated as attractive targets for hypoxia-activated prodrugs 32–34 that are less toxic and more effective. While focal hypoxia within a tumor can be tackled with boost radiation using intensity modulated radiation therapy (IMRT) without increasing normal tissue toxicities 35, 36,37, 38,37,39, 40, more diffuse and widespread hypoxia will benefit from systemic use of hypoxic cell toxins/sensitizers. 41,42, 43. Carbogen breathing combined with radiotherapy has been successfully used in several clinical trials and has shown benefit in tumors with significant hypoxia 44. It was the basis for the ARCON (Accelerated Radiotherapy with Carbogen and Nicotinamide) trial that was particularly beneficial in patients with signficant anemia 45, resulting in better response and survival. Janssens et al found in a chort of 345 laryngeal cancer patients a better five-year disease free survival of 68% vs 45% (p = 0.04).
Nontoxic prodrugs that generate active species in hypoxic tissue by selective bioreduction have now reached advanced clinical trials 42. These include tirapazamine, PR104 33 and TH 30246, 47. Newer drugs that target HIF1α are also available. 18. However, the lack of success with newer agents and techniques has been largely due to our inability to clearly identify, quantify, localize hypoxic tissue and select patients who would potentially benefited from such treatment modalities33, 48. 49 This is where tumor hypoxia imaging will be beneficial for identifying hypoxia and selecting patients for appropriate therapy. Even though reoxygenation can happen during radiotherapy 50, hypoxia-induced changes in the biology that begins earlier in the development of the tumor may result in a more profound and prolonged effect on the subsequent behavior of the tumor irrespective of reoxygenation. 51, 52,48, 53–55,33
Hypoxia as a Prognostic Marker
FMISO uptake in a solid tumor reflects the degree of hypoxia and hence the changes affecting the biology of cancer. Non-invasively identifying tumors with significant hypoxia in the tumor microenvironment along with other molecular markers of tumor biology, aggressiveness and treatment resistance, e.g. glucose metabolism, cellular proliferation etc will help us in selecting the appropriate therapy early in the process as a personalized approach. 17, 56, 57,58
PET has the ability to accurately quantify tissue uptake of the hypoxia tracer, independent of anatomic location of the tumor and it is noninvasive. able to image the entire tumor and regional lymphatic drainage in a snap shot fashion. More widespread availability of PET/CT scanners coupled with easy access to 18F-labeled hypoxia tracers in the community will enable this technology to be used in routine clinical pratcice. The utility of hypoxia imaging is two-fold: (1), the level of pretherapy hypoxia is an important prognostic parameter and (2) change in hypoxic volume with treatment will provide a better understanding of treatment response and a target for radiation boost. The application of PET/CT imaging for localizing hypoxia and then incorporating these images into radiation treatment planning systems will help oncologists plan and deliver hypoxia-directed radiotherapy boost using intensity modulated radiotherapy (IMRT) within the framework of a radiobiological rationale.
Methods for Evaluating Hypoxia
Currently available assays for tumor hypoxia can be largely categorized as in vivo (invasive and non-invasive) or ex vivo (invasive biopsy) 8, 59. To be clinically useful, an assay must distinguish normoxic regions from the ones that are hypoxic at a level relevant to cancer, Po2 in the 5 mm Hg range. Beginning with clinical evaluation and polarographic elctrode masurements several methods of evaluation have been attempted but they all have been shown to have weaknesses because of significant heterogeneity in hypoxia within a tumor, between tumors, and between patients with the similar tumor types and even in the same patient. Desirable characteristics for an ideal clinical hypoxia assay include 1) simple and non-invasive methodology, 2) lack of toxicity of any contrast agent, 3) rapid and easy to perform with consistency between laboratories and 4) the ability to quantify without the need for substantial calibration of the detection instrumentation. Electrodes are the classic way to quantify oxygen partial pressure (PO2) in an aqueous system. A miniaturized Clark-type electrode was developed for human measurements of regional PO2 where a small needle electrode is placed under CT guidance and voltage potential readings are recorded as the electrode is withdraw in small increments. Electrode readings (mV) can be calibrated in absolute units of mmHg or kPa and are therefore often referred to as a gold standard. However, the technique is limited to tumors that the probe can access. It also requires OR/CT time and support personnel and the electrode consumes O2 so the signal is smaller and is less reproducible at low PO2. Furthermore, this device, called the Eppendorf PO2 Histograph®, is no longer in production so its use is limited to laboratories that already have the instrumentation.
The OxyLite® probe is another instrument that measures O2 levels and is based on O2 quenching of a fluorescent signal. As the level of O2 decreases, quenching is less effective and the probe signal increases. This circumvents the limitation of the Eppendorf Histograph in terms of less sensitivity under hypoxic conditions but the technique has been limited to animal studies.
Clinically significant hypoxia is a phenomenological concept. It is not adequately quantified by a partial pressure measured in units of mmHg or kPa because different tissues need different levels of O2. The required level of O2 in healthy kidney, intestine and bone marrow is high whereas the level required for skeletal muscle is much lower. The most relevant assay of hypoxia would involve a technique that evaluated how adequately the supply of O2 was matching the demand for O2. There is a need to have an accurate and quantitative measure of tissue hypoxia rather than the level of oxygenation (PO2) with certain qualifications in order for it to be accepted and successful. 58, 60. An imaging technique where retention of the contrast agent was in direct competition with availability of metabolic oxygen should be the best way to achieve this imaging signal.
Several sampled biomarkers have been evaluated for identifying hypoxia in tissue biopsies. Most of these array-based methods assay for genes or proteins whose transcription is up regulated by hypoxia-regulated genes, molecules such as vascular endothelial growth factor (VEGF and VEGF-receptor), glucose transporter (GLUT1) and carbonic anhydrase IX. These signatures are highly prognostic of a poor outcome as a consequence of chronic hypoxia but they require a biopsy, which is challenging and sometimes impossible, especially when repeat measurements are required. Serum markers have also been evaluated but with less success. Furthermore, sampled biomarkers are not able to evaluate spatial heterogeneity, which is often relevant to overall response and is essential for defining a radiation treatment field.
Another tissue biomarker has developed as an outgrowth of the nitroimidazoles that are used as PET imaging agents for hypoxia. Pimonidazole binds to macromolecules under hypoxic conditions. While it has been used mostly for cell and animal studies, it can be used safely in patients and its covalent binding to intracellular molecules can be detected using antibodies. Thus it can be used to evaluate microscopic heterogeneity but it also requires tissue sampling. Commercial reagents are available for this assay under the name Hydroxyprobe® (Chemicon International). Specific antibodies against two of the PET imaging agents described in the next section, EF3 and EF5, have also been developed, allowing detection in biopsy material 61.
Imaged biomarkers provide the obvious solution to deal with heterogeneity. Non-invasive imaging provides spatial information and, with short T1/2 radiopharmaceuticals, imaging can be repeated as needed. However, this strategy presents the practical challenge of developing an image of the absence of oxygen, positive imaging of a negative situation.
Both sampled and imaged biomarkers have roles to play in the evaluation of hypoxia, but after the initial confirmation following cancer diagnosis in a patient, imaging methods will make serial evaluation of treatment response possible.
Heterogeneity Issues
Spatial heterogeneity in the distribution of hypoxia requires an assay that provides loco-regional evaluation of the tumor in its entirety. Hypoxia that is heterogeneously distributed should benefit from a differential delivery of radiation dose to a sub-volume by dose painting based on semi-quantitative measures of hypoxia and radiosensitivity maps 39, 62.63 Imaging in general and PET in particular has all of these advantages to overcome these limitations and to be effectively used in the clinical evaluation of hypoxia.
FMISO history
Hypoxia imaging was developed in our laboratory as an outgrowth of the development of radiosensitizers, which were pioneered in the 1970s to improve response of tumors to radiation therapy 64. Radiation oncologists were searching for a compound that was not consumed like O2 and could therefore diffuse farther than O2 and radiosensitize the poorly perfused hypoxic cells 65, 66. This oxygen mimetic might reach tissue regions where PO2 was insufficient to elicit the maximal cytotoxic effect of ionizing radiation. Two physicochemical characteristics were of paramount importance for the oxygen-mimetic compound. The first was that the molecule needed to substitute for O2 as an electron acceptor. The implication is that it would compete with O2 but it could not be a better electron acceptor than O2 or it could be toxic to mitochondria. The second was that the molecule should be about equally soluble in water and lipids, a partition coefficient very close to one so that it would not depend on blood flow to reach every cell in the body. (Figure 1) The same issues pertain to developing an imaging agent for hypoxia. The imaging study must be able to identify hypoxia independent of ischemia because in many instances these co-vary. Secondary considerations included drug solubility and toxicity but those would not be a limitation for an imaging agent administered in μg quantities. Chapman was the first to suggest that radiolabeled radiosensitizers could be used to image the spatial distribution of hypoxia. 67
Figure 1.
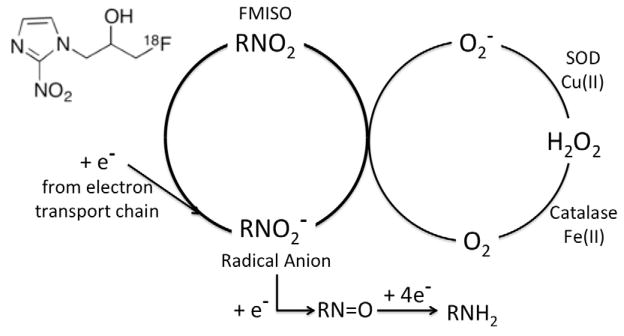
In alive cells, the mitochondria are continually leaking electrons that are taken up by the terminal electron acceptor, O2. In the absence of oxygen, a steady state concentration of the RNO2 radical anion accumulates and, if reduced by a second electron, it becomes an alkylating agent and is retained in cells at a level inversely related to O2 concentration. If O2 is present in adequate concentration, the RN O2 radical anion gives up its extra electron to the O2 and is returned in a futile cycle to the original FMISO.
Electron affinity is the parameter that quantifies electron-acceptor function. The first characteristic for radiosensitization was that the molecule needed to have an electron affinity that was close to but did not exceed that of O2. Electron affinity, the amount of energy released when an electron is added to a neutral atom or molecule, is the basis for the well-know electronegativity scale in chemistry. The physical parameter for electron affinity that is most relevant to radiopharmaceutical design is the one-electron reduction potential, which reflects the energy change for a neutral molecule converting to a radical anion. It is generally reported as or simply E1 (E2 for a second electron), in units of mV. Thus, the reaction for addition of one electron to O2 is O2 + e− → ·O2−, E° is −325 mV for O2 (1 atm) whereas E° (1 molar) is −155 mV 68. The radical anion becomes protonated in acid, , pK=4.8 69.
A number of studies have shown that the efficiency of radiosensitization by oxygen mimetics increases with the electron affinity of compounds 70. Electron migration within intracellular DNA and eventual electron trapping competes with radical recombination so that the overall level of free radical products is increased in the presence of the radiosensitizer. A comprehensive survey of electron affinic molecules started with simple quinones and highly conjugated carbonyl compounds such as menadione but both the benzoquinones and menadione were too electron-affinic, too reactive and hence toxic. Others considered the nitro-derivatives of benzenes and furans and eventually imidazoles. The latter group included metronidazole, a 2-methyl-5-nitroimidazole derivative called Flagyl® that was already in use for treating occult anaerobic infections. Scientists at SRI International made a series of 2-nitro-4-methyl derivatives with different alkyl substituents at the 5-position to search for molecules that were more electron-affinic than metronidazole 71 but most of the candidate molecules lead to rapid metabolism in vivo. The 2-nitroimidazoles substituted with alkyl groups at N1 are attractive drugs because the alkyl substituent can be modified without changing E1 but that change often has an impact on partition coefficient and metabolism. For example, the difference in E1 between phenol and the phenolic amino acid, tyrosine, is only 10 mV; alkyl substituents on aromatic systems have very little impact on electrochemistry.
Partition coefficient is the parameter that evaluates the relative lipophilic/hydrophilic nature of molecules and is commonly evaluated as the distribution coefficient between octan-1-ol and water. A partition coefficient (P) of one, not to be confused with a log P, means that the molecule is equally soluble in lipids and in aqueous phase (pure H2O or PBS or Ringers). For comparison, iodoantipyrine, which has been used as an inert, freely-diffusible blood flow tracer, has a partition coefficient of 0.78 measured as brain/blood 72; D-Glucose has a P of 0.0032 compared to 22 for lidocaine 73.
The ideal partition coefficient for a hypoxia agent is the subject of legitimate debate. If the value of P is close to one, the tracer will be a freely-diffusible flow trace immediately after injection but will then equilibrate to reflect the tissue partition coefficient. In other words, once distribution equilibrium is achieved, all tissues should have the same concentration as blood. Only regions of hypoxia or organs involved in excretion or metabolism will have uptake levels greater than blood. The advantage is that the concentration ratio for normoxic tissue to blood will be very close to one and will be completely independent of blood flow. This is demonstrated experimentally by uptake of hypoxia imaging agents in anaerobic bacteria in the intestinal lumen, a site inaccessible to blood perfusion. This result has been reported for FMISO 74 and for FAZA 75. The downside of this approach is that contrast between hypoxia and normoxia will be only modest.
The most common strategy suggested to improve image contrast is to make the hypoxia agent more soluble in water so that it is excreted as quickly as possible. However, this approach inevitably introduces blood flow as a secondary contributor to the resulting image. Because hypoxia can be a consequence of reduced blood flow, one can appreciate that introducing a flow component in the hypoxia image is a flawed concept and that it is preferable to accept low contrast and maintain rigorous independence of blood flow.
Table 1 provides a compilation of partition coefficients (P) for molecules that have been evaluated as hypoxia-imaging agents, with the caution that these values were compiled from numerous laboratories and so they invariably involve slightly different experimental methods. Of the potential PET agents, the P for FMISO has been measured by three groups with values of 0.40, 0.41, 0.44, values that bracket misonidazole. We emphasize that these are values for P, not log P as has been quoted in some reviews. Brown 76 developed a series of molecules that were more hydrophilic than misonidazole, anticipating that they should be less neurotoxic than metronidazole or misonidazole. While they were less toxic, toxicity is not an important limitation for radiopharmaceuticals because they are administered in μg amounts. The most favorable was etanidazole, which became the basis of FETA; P values are 0.046 and 0.16 without and with addition of a fluorine.
Table 1.
Partition Coefficients for potential hypoxia-imaging agents.
| Molecule | Partition Coef. (octanol/water) | Primary Citation |
|---|---|---|
| Desmethylmisonidazole | 0.11, 0.13 | (Adams 1976) |
| Fluoroazomycin arabinoside (FAZA) | 0.27 | (Bacchu 2014) |
| Misonidazole | 0.43, 0.35 | (Adams 1976; Sasai 1989) |
| Fluoromisonidazole (Ro 07-0741) | 0.40, 0.41, 0.44 | (Rasey 1987; Adams 1979) |
| Fluoroerythronitroimidazole (FETNIM) | 0.17 | (Yang 1995) |
| Etanidazole (SR2508) | 0.046, 0.021 | (Brown 1982; Sasai 1989) |
| Fluoroetanidazole (FETA or EF1) | 0.16 | (Barthel 2004) |
| RP170 | 0.094 | (Sasai 1989) |
| HX4 | 0.20 | (Dubois 2011) |
| EF3 | 1.2 | (Koch 2002) |
| EF5 | 5.7 | (Evans 2003) |
Sugar-coupled 2-nitroimidazole derivatives provide an alternative way to increase water solubility. This approach was pioneered in Edmonton, with fluoro-azomycin arabino-furanoside, FAZA, having potential advantages over FMISO in terms of plasma clearance and image contrast. The P of FAZA was initially inferred from HPLC retention values compared to FMISO 77,78 but, for this review, our colleagues in Edmonton made a direct measurement using standard extraction methodology and found a value of P = 0.2779.
Two additional hydrophilic radiopharmaceuticals have been published and are listed in Table 2. RP170 is the most water-soluble nitroimidazole that has been evaluated as a potential radiosensitizer that should be less toxic than misonidazole 80. It has an open-ring sugar analog at the N1 position but has not been developed as an imaging agent. An alternative hydrophilic 2-nitroimidazole nucleoside called HX4 has been developed 81 with a 1,2,3-triazole ring between the imidazole and the 3-fluoropropan-1-ol. It was specifically designed to accelerate clearance and increase contrast. In a study of patients with lung cancer, the mean tumor/blood ratio at 2 and 4 hrs was equivalent to that for FMISO 82; contrast was not improved.
Table 2.
Potential mechanisms of action for various hypoxia targeted therapies. The number of stars (ranging from 1 star = least effect to 4 stars = most effect) represent the role and degree of each mechanistic process i.e indirect effect due to tissue oxygen level or direct effect on hypoxic cells.
| Approach | Oxygen Level | Hypoxic Cells |
|---|---|---|
| XRT | ** | * |
| Neutrons | **** | * |
| HBO, Carbogen | **** | * |
| Fractionation | *** | ? |
| Radiosensitizers | - | *** |
| Hypoxic Cell Cytotoxins | - | **** |
Other groups have suggested that an imaging agent should have a higher P, more lipophilic than FMISO, believing that diffusion of hydrophilic compounds into tumors might be limiting uptake and therefore imaging signal intensity. A new class of molecules based on larger side chains for etanidazole was developed, including compounds known as EF3 and EF5. In these molecules the –CH218F of FETA, also called EF1, was replaced with –CF3 and –CF2CF3 groups, respectively, resulting in a sequential increase in P. A few studies have compared EF3 and FMISO with the conclusion that they are equivalent in terms of hypoxia imaging contrast 83, 84. While EF3 has a P value closest to one in Table 2, it has not been pursued in clinical studies, perhaps because it is not labeled by simple nucleophilic displacement radiochemistry. However, specific antibodies have been developed against EF3 and EF5, allowing assay of hypoxia in biopsy specimens as well as by imaging 61. EF5 is by far the most lipophilic 2-nitroimidazole that has been evaluated and was developed to emphasize the importance of a uniform distribution in adequately oxygenated tissues. It has the further advantage that antibodies recognize EF5 adducts but not molecules that have not been reduced, so the background signal is eliminated in the immunohistochemical detection involving biopsy samples. However, EF5 presents the substantial disadvantage that it requires electrophilic fluorination in order to produce the imaging agent 85. This means that carrier fluorine is deliberately added, reducing specific activity of the radiopharmaceutical. Nevertheless, EF5 is finding a role in PET imaging of hypoxia.
Metabolism is potentially more important than toxicity for radiopharmaceuticals and the 5-alkyl substituents can lead to conjugation reaction products that alter the effective partition coefficient of the radiolabel 86. From a simple chemistry perspective, the more structure that is introduced in the alkyl side chain, the greater the potential for metabolism. However in practical terms none of the 2-nitroimidazoles in Table 2 are metabolized to an extent that interferes with imaging. Renal excretion is the dominant mechanism for elimination of all of the nitroimidazole-based hypoxia imaging agents. The blood clearance curve has a rapid component (T1/2 of minutes) and a slow component (T1/2 of hours) with only small differences between the individual molecules. Another advantage of FMISO is the ready and easy availability of F-18 for nucleophilic labeling at many academic institutions as well as commercial radiopharmacies that increases the opportunities for conducting clinical trials.
Narrow distribution of pixel uptake values (mean T:B ≈ 1.0) after ~ 90 min has led to a simple analysis of FMISO-PET images by scaling the pixel uptake to plasma concentration. The mean value for this ratio in all tissues is close to unity and almost all normoxic pixels have a value of <1.2. The magnitude of the intermediate radical anion product parallels nitroreductase levels, which vary only slightly between normoxic tissues, so this factor does not affect the imaging analysis of fractional hypoxic volume. The optimum time for imaging appears to be between 90 and 120 min and can be adjusted to fit the clinic schedule so that for the patient or the imaging technologist the procedure is very similar to that of a bone scan.
The Hypoxia - Glucose Metabolism connection
Increased glucose metabolism in cancer as a result of aerobic glucolysis, the ‘Warburg effect,’ is ubquitous and has a major role in clinical oncologic imaging using F-18 FDG PET tracer. Anerobic glycolysis can also occur and so FDG has also been suggested as an indirect marker for hypoxia.87 Because glucose metabolism is increased in cancer cells even in the presence of oxygen, FDG should not be as accurate as FMISO in reflecting the degree of tumor hypoxia. Since FMISO and FDG look at two associated but uniquely different biological procesees, the information from the two agents would give different perspectives in the evaluation of tumor hypoxia and may be considered as complementary. 88–90. Our analysis of the data on FDG and FMISO uptake i.e. glucose metabolism and hypoxia in a variety of tumors showed the wide variation between the two processes indicating that the two biological processes are not totally related and FDG cannot be an effective surrogate to study hypoxia and that specific hypoxia markers are needed for that purpose. 89 (Figure 2) For the same rationale, combinations of hypoxia, metabolism, and proliferation imaging obtained simultaneously may provide independent and comprehensive information about the different cellular mechanisms that can be used as treatment targets 90, 91.
Figure 2.

Hypothetical illustration with data from multiple cancers showing the possible scenarios in the correlation between hypoxia and glucose metabolism. Group I - low glucose metabolism and low hypoxia; Group II - low hypoxia and high glucose metabolism; Group III – high hypoxia and high glucose metabolism; Group IV – high hypoxia and low glucose metabolism. (Rajendran JG et al Clin Cancer Res 2004;10(7): 2245–52)
Robust quantification for clincal use
While the tumor-to-background ratio image does not show high contrast, this does not compromise image interpretation. Hypoxia images can be interpreted in several ways, both qualitatively or quantitatively. Qualitative interpretations have been used with a scoring system to grade the uptake in a tumor compared to adjacent normal tissue 41. After extensive validation studies, we have preferred a simple but accurate quantitation method using a venous blood sample drawn during the imaging sequence to calculate a tissue: blood ratio. Other studies have used tumor to muscle ratio (TMR) for this purpose 92. The latter can be challenging in some circumstances, for example in evaluating head and neck tumors because of the increased levels of FMISO uptake in the neck muscles. It has been our observation that higher level of FMISO uptake can be seen in the posterior muscles especially of the head and neck that will bias the TMR if caution is not taken in selecting the optimal site for the muscle region. However, considerable progress has been reported on image-based blood surrogates for quantification of FMISO ratio images.93 Eliminating a requirement for blood sampling will make FMISO PET more attractive for multicenter clinical trials.
The advantages of having some kind of semi-quantitative method in the evaluation are manifold and cannot be over estimated. These include the ability to define hypoxic sub-volume in a more accurate fashion than with a simple SUV and will help with the serial quantification of tissue hypoxia over the course of disease progression and treatment.
Both how much tissue is hypoxic and the magnitude of hypoxia are important and can be used for different purposes in managing patients. The former gives the extent of tumor hypoxia, determining the volume of hypoxic tissue that will help localize and define the hypoxic sub-volume (HV) for targeting XRT boost or tighter margins for IMRT, while the latter provides prognostic information about the tumor. Both parameters help select appropriate systemic hypoxia-directed therapies to complement local therapy. (Figure 3) The potential use of FMISO imaging in identifying candidate patients for boost radiotherapy to their HV has been described in the literature. 60, 94
Figure 3.
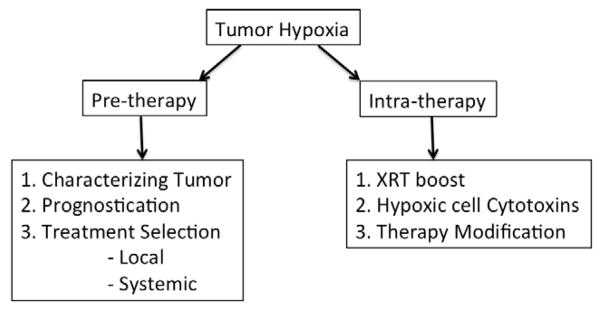
Possible approaches for utilizing information from tumor hypoxia imaging in the various phases in clinical management of solid tumors.
Fractional hypoxic volume (FHV), defined as the proportion of pixels within the imaged tumor volume having a ratio above some valid cut off value, is an extrapolation of a concept from radiobiology 95, but it requires accurate delineation of tumor margins to define the denominator and is also affected by the presence of necrotic areas within the tumor in order to be accurate 96. The imaging FHV is different from radiobiological hypoxic fraction as determined from analysis of cell survival curves. We prefer the use of tumor hypoxic volume (HV) as the parameter for extent of hypoxic tissue. It is defined as the total number of pixels with a T:B ≥ 1.2 and converted to units of mL. This parameter does not need a stringent demarcation of the tumor boundaries and does not include necrotic regions within the tumor because dead cells lack nitroreductase enzymes and so do not have increased FMISO uptake. This simple analysis is also unaffected by perfusion but only requires that the hypoxic cells are viable by exhibiting active electron transport.
Complex mathematical modeling methods that have been investigated for more detailed analysis of FMISO uptake are probably too complicated for practical routine clinical imaging 97, 98 but may have a research role in planning radiation treatment using dose painting methods. Due to heterogeneity in the distribution of hypoxia within a tumor, dose painting will play a key role in planning boost radiotherapy to hypoxic sub-volumes where parametric imaging is expected to play a key role in RT planning that will account for and take advantage of heterogeneity in hypoxia for a realistic radiation boost. 39, 99 Test -retest experiments using multiple FMISO PET studies in the same patient at different time points have clearly established the reproducibility of FMISO PET scans for a number of clinical situations. 100 FMISO has all the qualities of an ideal hypoxia tracer in imaging the tumor microenvironment.
Clinical applications of FMISO
After extensive pre-clinical and clinical trials, FMISO has remained as the most highly investigated and utilized PET tracer for the evaluation of tumor hypoxia. Pre-therapy hypoxia and FMISO uptake in predicting prognosis has been confirmed in several human studies - glioblastoma multiforme (GBM), head and neck cancer 58,53, 56, 101, 102, lung cancer,103, 104, breast cancer 105 pancreatic cancer,9 gynecologic cancers – cervical cancer106 and sarcoma 107 as demonstrated in the following images. (Figures 4 – 7)
Figure 4.

64 year old female patient with large base of tongue carcinoma with extension to anterior tongue. T:Bmax is 2.53 with HV of 110 cc.
Figure 7.

61 year old female patient with cancer of uterine cervix and a 7cm cervical mass – Solid arrow shows the tumor on CT image and dashed arrow shows areas of FMISO uptake within the tumor on PET image and fused image shows localization of hypoxic regions within the tumor. Max Tissue:Blood ratio = 2.00 with Hypoxic Volume 29.8cc.
Summary
Our ability to use molecular imaging to characterize therapeutic targets and apply this information for therapeutic interventions is growing rapidly42, 108, 109,40, 94. Evaluation of hypoxia and its biological ramifications to effectively plan appropriate therapy that can overcome the cure-limiting effects of hypoxia provides an objective means for treatment selection and planning. FMISO PET imaging of tumor hypoxia continues to be the lead radiopharmaceutical for the evaluation, prognostication and quantification of hypoxia, one of the key elements of the tumor microenvironment. FMISO is less confounded by blood flow and, although the images have less contrast than FDG PET, its uptake after 2 hours is an accurate reflection of inadequate regional Po2 at the time of radiopharmaceutical administration. The past decade has seen significant technological advances in investigating hypoxia imaging in radiation treatment planning and in providing us with the ability to individualize radiation delivery and target volume coverage. The presence of widespread hypoxia in the tumor can be effectively targeted with a systemic hypoxic cell cytotoxin or other agents that are more effective with diminished PO2, either alone or in combination45. Molecular imaging in general and hypoxia imaging in particular will likely become an important in vivo imaging biomarker of the future, complementing the traditional direct tissue sampling methods by providing a snap shot of a primary tumor and metastatic disease and in following treatment response and will serve as adjunct to personalized therapy.
Figure 5.
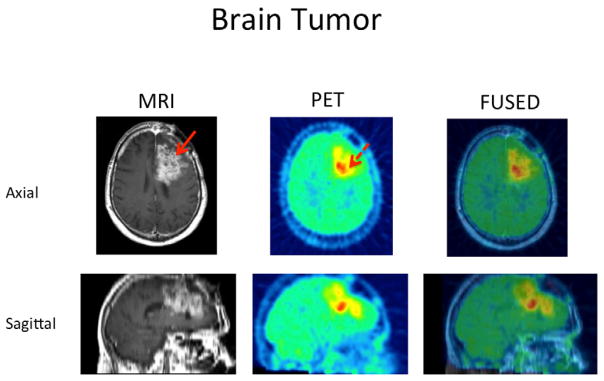
69 year old male patient with glioblastoma in the left superior frontal lobe. T2 MR image shows the extent of the whole tumor (Solid red arrow) and FMISO PET image shows a more focal uptake of FMISO predominantly in the posterior and inferior aspect of the tumor (dashed arrow). Fuse image shows localization of hypoxic region within the tumor. Tissue:Blood max of 2.57 and Hypoxic Volume of 35.4cc.
Figure 6.
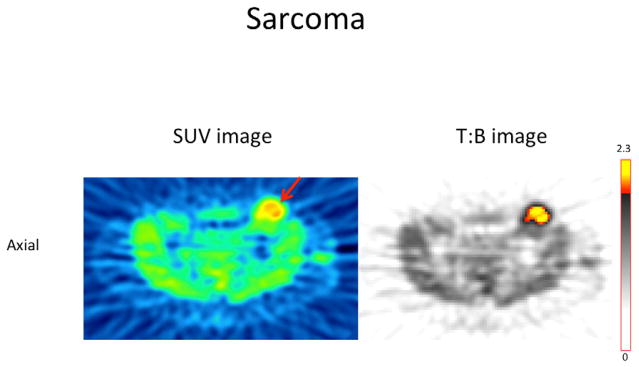
38 year old female patient with Angiosarcoma of the left inguinal region. Axial PET image based on SUV (left) and T:B ratio (right) show FMISO uptake in the tumor and T:B max = 2.3 with Hypoxic Volume = 17.5cc
Acknowledgments
This study was supported in part by P01 CA042045 and S10 RR17229.
We thank Ms. Lanell Peterson for her help in preparing this manuscript and numerous colleagues who have been active in developing hypoxia imaging.
Footnotes
Publisher's Disclaimer: This is a PDF file of an unedited manuscript that has been accepted for publication. As a service to our customers we are providing this early version of the manuscript. The manuscript will undergo copyediting, typesetting, and review of the resulting proof before it is published in its final citable form. Please note that during the production process errors may be discovered which could affect the content, and all legal disclaimers that apply to the journal pertain.
References
- 1.Nishino M, Jagannathan JP, Krajewski KM, et al. Personalized tumor response assessment in the era of molecular medicine: cancer-specific and therapy-specific response criteria to complement pitfalls of RECIST. AJR Am J Roentgenol. 2012;198(4):737–45. doi: 10.2214/AJR.11.7483. [DOI] [PMC free article] [PubMed] [Google Scholar]
- 2.Awada A, Aftimos PG. Targeted therapies of solid cancers: new options, new challenges. Curr Opin Oncol. 2013;25(3):296–304. doi: 10.1097/CCO.0b013e32835ff318. [DOI] [PubMed] [Google Scholar]
- 3.Thomlinson RH. Tumour anoxia and the response to radiation. Sci Basis Med Annu Rev. 1965:74–90. [PubMed] [Google Scholar]
- 4.Hanahan D, Weinberg RA. Hallmarks of cancer: the next generation. Cell. 2011;144(5):646–74. doi: 10.1016/j.cell.2011.02.013. [DOI] [PubMed] [Google Scholar]
- 5.Wijsman R, Kaanders JH, Oyen WJ, Bussink J. Hypoxia and tumor metabolism in radiation oncology: targets visualized by positron emission tomography. Q J Nucl Med Mol Imaging. 2013;57(3):244–56. [PubMed] [Google Scholar]
- 6.Wahl RL. Anatomolecular imaging with 2-deoxy-2-[18F]fluoro-D-glucose: bench to outpatient center. Mol Imaging Biol. 2003;5(2):49–56. doi: 10.1016/s1536-1632(03)00045-3. [DOI] [PubMed] [Google Scholar]
- 7.Herschman HR. Molecular imaging: looking at problems, seeing solutions. Science. 2003;302(5645):605–8. doi: 10.1126/science.1090585. [DOI] [PubMed] [Google Scholar]
- 8.Peters L, McKay M. Predictive assays: will they ever have a role in the clinic? Int J Radiat Oncol Biol Phys. 2001;49(2):501–4. doi: 10.1016/s0360-3016(00)01469-3. [DOI] [PubMed] [Google Scholar]
- 9.Segard T, Robins PD, Yusoff IF, et al. Detection of hypoxia with 18F-fluoromisonidazole (18F-FMISO) PET/CT in suspected or proven pancreatic cancer. Clin Nucl Med. 2013;38(1):1–6. doi: 10.1097/RLU.0b013e3182708777. [DOI] [PubMed] [Google Scholar]
- 10.Walsh JC, Lebedev A, Aten E, Madsen K, Marciano L, Kolb HC. The Clinical Importance of Assessing Tumor Hypoxia: Relationship of Tumor Hypoxia to Prognosis and Therapeutic Opportunities. Antioxid Redox Signal. 2014 doi: 10.1089/ars.2013.5378. [DOI] [PMC free article] [PubMed] [Google Scholar]
- 11.Vincent M. Cancer: a de-repression of a default survival program common to all cells?: a life-history perspective on the nature of cancer. Bioessays. 2012;34(1):72–82. doi: 10.1002/bies.201100049. [DOI] [PubMed] [Google Scholar]
- 12.Villaret DB, Wang T, Dillon D, et al. Identification of genes overexpressed in head and neck squamous cell carcinoma using a combination of complementary DNA subtraction and microarray analysis. Laryngoscope. 2000;110(3 Pt 1):374–81. doi: 10.1097/00005537-200003000-00008. [DOI] [PubMed] [Google Scholar]
- 13.Hockel M, Vaupel P. Biological consequences of tumor hypoxia. Semin Oncol. 2001;28(2 Suppl 8):36–41. [PubMed] [Google Scholar]
- 14.Dachs GU, Tozer GM. Hypoxia modulated gene expression: angiogenesis, metastasis and therapeutic exploitation. Eur J Cancer. 2000;36(13 Spec):1649–60. doi: 10.1016/s0959-8049(00)00159-3. [DOI] [PubMed] [Google Scholar]
- 15.Wellmann S, Guschmann M, Griethe W, et al. Activation of the HIF pathway in childhood ALL, prognostic implications of VEGF. Leukemia. 2004;18(5):926–33. doi: 10.1038/sj.leu.2403332. [DOI] [PubMed] [Google Scholar]
- 16.Kourkourakis MI, Giatromanolaki Cancer vascularization: implications in radiotherapy? Int J Radiat Oncol Biol Phys. 2000;48(2):545–53s. doi: 10.1016/s0360-3016(00)00677-5. [DOI] [PubMed] [Google Scholar]
- 17.DeClerck K, Elble RC. The role of hypoxia and acidosis in promoting metastasis and resistance to chemotherapy. Front Biosci (Landmark Ed) 2010;15:213–25. doi: 10.2741/3616. [DOI] [PubMed] [Google Scholar]
- 18.Lu X, Kang Y. Hypoxia and hypoxia-inducible factors: master regulators of metastasis. Clin Cancer Res. 2010;16(24):5928–35. doi: 10.1158/1078-0432.CCR-10-1360. [DOI] [PMC free article] [PubMed] [Google Scholar]
- 19.Ivan M, Kondo K, Yang H, et al. HIFalpha Targeted for VHL-Mediated Destruction by Proline Hydroxylation: Implications for O2 Sensing. Science. 2001;292(5516):464–68. doi: 10.1126/science.1059817. [DOI] [PubMed] [Google Scholar]
- 20.Ivan M, Kaelin WG., Jr The von Hippel-Lindau tumor suppressor protein. Curr Opin Genet Dev. 2001;11(1):27–34. doi: 10.1016/s0959-437x(00)00152-0. [DOI] [PubMed] [Google Scholar]
- 21.Huang LE, Arany Z, Livingston DM, Bunn HF. Activation of hypoxia-inducible transcription factor depends primarily upon redox-sensitive stabilization of its alpha subunit. J Biol Chem. 1996;271(50):32253–9. doi: 10.1074/jbc.271.50.32253. [DOI] [PubMed] [Google Scholar]
- 22.Greer SN, Metcalf JL, Wang Y, Ohh M. The updated biology of hypoxia-inducible factor. EMBO J. 2012;31(11):2448–60. doi: 10.1038/emboj.2012.125. [DOI] [PMC free article] [PubMed] [Google Scholar]
- 23.Kizaka-Kondoh S, Kuchimaru T, Kadonosono T. Pathophysiological response to hypoxia - from the molecular mechanisms of malady to drug discovery:hypoxia-inducible factor-1 (HIF-1)-active cells as a target for cancer therapy. J Pharmacol Sci. 2011;115(4):440–5. doi: 10.1254/jphs.10r20fm. [DOI] [PubMed] [Google Scholar]
- 24.Koh MY, Spivak-Kroizman TR, Powis G. HIF-1alpha and cancer therapy. Recent Results Cancer Res. 2010;180:15–34. doi: 10.1007/978-3-540-78281-0_3. [DOI] [PubMed] [Google Scholar]
- 25.Hall EJ. Radiobiology for the Radiologist. Philadelphia, PA: Lippincott Williams & Wilkins; 2000. [Google Scholar]
- 26.Evans SM, Koch CJ. Prognostic significance of tumor oxygenation in humans. Cancer Lett. 2003;195(1):1–16. doi: 10.1016/s0304-3835(03)00012-0. [DOI] [PubMed] [Google Scholar]
- 27.Koong AC, Denko NC, Hudson KM, et al. Candidate genes for the hypoxic tumor phenotype. Cancer Res. 2000;60(4):883–7. [PubMed] [Google Scholar]
- 28.Hockel M, Schlenger K, Hockel S, Vaupel P. Hypoxic cervical cancers with low apoptotic index are highly aggressive. Cancer Res. 1999;59(18):4525–8. [PubMed] [Google Scholar]
- 29.Cosse JP, Michiels C. Tumour hypoxia affects the responsiveness of cancer cells to chemotherapy and promotes cancer progression. Anticancer Agents Med Chem. 2008;8(7):790–7. doi: 10.2174/187152008785914798. [DOI] [PubMed] [Google Scholar]
- 30.Hernandez-Luna MA, Rocha-Zavaleta L, Vega MI, Huerta-Yepez S. Hypoxia inducible factor-1alpha induces chemoresistance phenotype in non-Hodgkin lymphoma cell line via up-regulation of Bcl-xL. Leuk Lymphoma. 2013;54(5):1048–55. doi: 10.3109/10428194.2012.733874. [DOI] [PubMed] [Google Scholar]
- 31.Chen J, Ding Z, Peng Y, et al. HIF-1alpha Inhibition Reverses Multidrug Resistance in Colon Cancer Cells via Downregulation of MDR1/P-Glycoprotein. PLoS One. 2014;9(6):e98882. doi: 10.1371/journal.pone.0098882. [DOI] [PMC free article] [PubMed] [Google Scholar]
- 32.Brown JM. Exploiting the hypoxic cancer cell: mechanisms and therapeutic strategies. Mol Med Today. 2000;6(4):157–62. doi: 10.1016/s1357-4310(00)01677-4. [DOI] [PubMed] [Google Scholar]
- 33.McKeage MJ, Jameson MB, Ramanathan RK, et al. PR-104 a bioreductive pre-prodrug combined with gemcitabine or docetaxel in a phase Ib study of patients with advanced solid tumours. BMC Cancer. 2012;12:496. doi: 10.1186/1471-2407-12-496. [DOI] [PMC free article] [PubMed] [Google Scholar]
- 34.Ahn GO, Brown M. Targeting tumors with hypoxia-activated cytotoxins. Front Biosci. 2007;12:3483–501. doi: 10.2741/2329. [DOI] [PubMed] [Google Scholar]
- 35.Rajendran JGMJ, Schwartz DL, Kinahan PE, Cheng P, Hummel SM, Lewellen B, Philips M, Krohn KA. Imaging with F-18 FMISO-PET permits hypoxia directed radiotherapy dose escalation for head and neck cancer. J Nucl Med. 2003;44:415, 127P. [Google Scholar]
- 36.Chao KS, Bosch WR, Mutic S, et al. A novel approach to overcome hypoxic tumor resistance: Cu-ATSM-guided intensity-modulated radiation therapy. Int J Radiat Oncol Biol Phys. 2001;49(4):1171–82. doi: 10.1016/s0360-3016(00)01433-4. [DOI] [PubMed] [Google Scholar]
- 37.Lee NY, Mechalakos JG, Nehmeh S, et al. Fluorine-18-labeled fluoromisonidazole positron emission and computed tomography-guided intensity-modulated radiotherapy for head and neck cancer: a feasibility study. Int J Radiat Oncol Biol Phys. 2008;70(1):2–13. doi: 10.1016/j.ijrobp.2007.06.039. [DOI] [PMC free article] [PubMed] [Google Scholar]
- 38.Chang JH, Wada M, Anderson NJ, et al. Hypoxia-targeted radiotherapy dose painting for head and neck cancer using (18)F-FMISO PET: A biological modeling study. Acta Oncol. 2013;52(8):1723–9. doi: 10.3109/0284186X.2012.759273. [DOI] [PubMed] [Google Scholar]
- 39.Thorwarth D, Eschmann SM, Paulsen F, Alber M. Hypoxia dose painting by numbers: a planning study. Int J Radiat Oncol Biol Phys. 2007;68(1):291–300. doi: 10.1016/j.ijrobp.2006.11.061. [DOI] [PubMed] [Google Scholar]
- 40.Hendrickson K, Phillips M, Smith W, Peterson L, Krohn K, Rajendran J. Hypoxia imaging with [F-18] FMISO-PET in head and neck cancer: potential for guiding intensity modulated radiation therapy in overcoming hypoxia-induced treatment resistance. Radiother Oncol. 2011;101(3):369–75. doi: 10.1016/j.radonc.2011.07.029. [DOI] [PMC free article] [PubMed] [Google Scholar]
- 41.Rischin D, Peters L, Hicks R, et al. Phase I trial of concurrent tirapazamine, cisplatin, and radiotherapy in patients with advanced head and neck cancer. J Clin Oncol. 2001;19(2):535–42. doi: 10.1200/JCO.2001.19.2.535. [DOI] [PubMed] [Google Scholar]
- 42.Guise CP, Mowday AM, Ashoorzadeh A, et al. Bioreductive prodrugs as cancer therapeutics: targeting tumor hypoxia. Chin J Cancer. 2014;33(2):80–6. doi: 10.5732/cjc.012.10285. [DOI] [PMC free article] [PubMed] [Google Scholar]
- 43.Kling J. Hypoxia-activated prodrugs forge ahead in cancer. Nat Biotechnol. 2012;30(5):381. doi: 10.1038/nbt0512-381. [DOI] [PubMed] [Google Scholar]
- 44.Zhan HW, Liu HB, Bao CK, Ye XJ, Zhang H, He GQ. Effect of carbogen on tumour oxygenation and 32P-colloid interstitial irradiation response. Med Sci Monit. 2010;16(1):BR11–6. [PubMed] [Google Scholar]
- 45.Janssens GO, Rademakers SE, Terhaard CH, et al. Improved recurrence-free survival with ARCON for anemic patients with laryngeal cancer. Clin Cancer Res. 2014;20(5):1345–54. doi: 10.1158/1078-0432.CCR-13-1730. [DOI] [PubMed] [Google Scholar]
- 46.Cardenas-Rodriguez J, Li Y, Galons JP, et al. Imaging biomarkers to monitor response to the hypoxia-activated prodrug TH-302 in the MiaPaCa2 flank xenograft model. Magn Reson Imaging. 2012;30(7):1002–9. doi: 10.1016/j.mri.2012.02.015. [DOI] [PMC free article] [PubMed] [Google Scholar]
- 47.Liu Q, Sun JD, Wang J, et al. TH-302, a hypoxia-activated prodrug with broad in vivo preclinical combination therapy efficacy: optimization of dosing regimens and schedules. Cancer Chemother Pharmacol. 2012;69(6):1487–98. doi: 10.1007/s00280-012-1852-8. [DOI] [PMC free article] [PubMed] [Google Scholar]
- 48.Sato J, Kitagawa Y, Yamazaki Y, et al. Advantage of FMISO-PET over FDG-PET for predicting histological response to preoperative chemotherapy in patients with oral squamous cell carcinoma. Eur J Nucl Med Mol Imaging. 2014 doi: 10.1007/s00259-014-2810-y. [DOI] [PubMed] [Google Scholar]
- 49.Ghattass K, Assah R, El-Sabban M, Gali-Muhtasib H. Targeting hypoxia for sensitization of tumors to radio- and chemotherapy. Curr Cancer Drug Targets. 2013;13(6):670–85. doi: 10.2174/15680096113139990004. [DOI] [PubMed] [Google Scholar]
- 50.Eschmann SM, Paulsen F, Bedeshem C, et al. Hypoxia-imaging with (18)F-Misonidazole and PET: changes of kinetics during radiotherapy of head-and-neck cancer. Radiother Oncol. 2007;83(3):406–10. doi: 10.1016/j.radonc.2007.05.014. [DOI] [PubMed] [Google Scholar]
- 51.Tachibana I, Nishimura Y, Shibata T, et al. A prospective clinical trial of tumor hypoxia imaging with 18F-fluoromisonidazole positron emission tomography and computed tomography (F-MISO PET/CT) before and during radiation therapy. J Radiat Res. 2013;54(6):1078–84. doi: 10.1093/jrr/rrt033. [DOI] [PMC free article] [PubMed] [Google Scholar]
- 52.Narita T, Aoyama H, Hirata K, et al. Reoxygenation of glioblastoma multiforme treated with fractionated radiotherapy concomitant with temozolomide: changes defined by 18F-fluoromisonidazole positron emission tomography: two case reports. Jpn J Clin Oncol. 2012;42(2):120–3. doi: 10.1093/jjco/hyr181. [DOI] [PubMed] [Google Scholar]
- 53.Rischin D, Hicks RJ, Fisher R, et al. Prognostic significance of [18F]-misonidazole positron emission tomography-detected tumor hypoxia in patients with advanced head and neck cancer randomly assigned to chemoradiation with or without tirapazamine: a substudy of Trans-Tasman Radiation Oncology Group Study 98. 02. J Clin Oncol. 2006;24(13):2098–104. doi: 10.1200/JCO.2005.05.2878. [DOI] [PubMed] [Google Scholar]
- 54.Saggar JK, Tannock IF. Activity of the hypoxia-activated pro-drug TH-302 in hypoxic and perivascular regions of solid tumors and its potential to enhance therapeutic effects of chemotherapy. Int J Cancer. 2014;134(11):2726–34. doi: 10.1002/ijc.28595. [DOI] [PubMed] [Google Scholar]
- 55.Peitzsch C, Perrin R, Hill RP, Dubrovska A, Kurth I. Hypoxia as a biomarker for radioresistant cancer stem cells. Int J Radiat Biol. 2014;90(8):636–52. doi: 10.3109/09553002.2014.916841. [DOI] [PubMed] [Google Scholar]
- 56.Kikuchi M, Yamane T, Shinohara S, et al. 18F-fluoromisonidazole positron emission tomography before treatment is a predictor of radiotherapy outcome and survival prognosis in patients with head and neck squamous cell carcinoma. Ann Nucl Med. 2011;25(9):625–33. doi: 10.1007/s12149-011-0508-9. [DOI] [PubMed] [Google Scholar]
- 57.Garcia C, Flamen P. Role of positron emission tomography in the management of head and neck cancer in the molecular therapy era. Curr Opin Oncol. 2008;20(3):275–9. doi: 10.1097/CCO.0b013e3282faa0cb. [DOI] [PubMed] [Google Scholar]
- 58.Rajendran JG, Schwartz DL, O’Sullivan J, et al. Tumor hypoxia imaging with [F-18] fluoromisonidazole positron emission tomography in head and neck cancer. Clin Cancer Res. 2006;12(18):5435–41. doi: 10.1158/1078-0432.CCR-05-1773. [DOI] [PMC free article] [PubMed] [Google Scholar]
- 59.Hockel M, Vaupel P. Tumor hypoxia: definitions and current clinical, biologic, and molecular aspects. J Natl Cancer Inst. 2001;93(4):266–76. doi: 10.1093/jnci/93.4.266. [DOI] [PubMed] [Google Scholar]
- 60.Zips D, Zophel K, Abolmaali N, et al. Exploratory prospective trial of hypoxia-specific PET imaging during radiochemotherapy in patients with locally advanced head-and-neck cancer. Radiother Oncol. 2012;105(1):21–8. doi: 10.1016/j.radonc.2012.08.019. [DOI] [PubMed] [Google Scholar]
- 61.Lord EM, Harwell L, Koch CJ. Detection of hypoxic cells by monoclonal antibody recognizing 2-nitroimidazole adducts. Cancer Res. 1993;53(23):5721–6. [PubMed] [Google Scholar]
- 62.Toma-Dasu I, Uhrdin J, Antonovic L, et al. Dose prescription and treatment planning based on FMISO-PET hypoxia. Acta Oncol. 2012;51(2):222–30. doi: 10.3109/0284186X.2011.599815. [DOI] [PubMed] [Google Scholar]
- 63.Mammar H, Kerrou K, Nataf V, et al. Positron emission tomography/computed tomography imaging of residual skull base chordoma before radiotherapy using fluoromisonidazole and fluorodeoxyglucose: potential consequences for dose painting. Int J Radiat Oncol Biol Phys. 2012;84(3):681–7. doi: 10.1016/j.ijrobp.2011.12.047. [DOI] [PubMed] [Google Scholar]
- 64.Denekamp J, Fowler JF, Dische S. The proportion of hypoxic cells in a human tumor. Int J Radiat Oncol Biol Phys. 1977;2(11–12):1227–8. doi: 10.1016/0360-3016(77)90140-7. [DOI] [PubMed] [Google Scholar]
- 65.Sutherland RM, Franko AJ. On the nature of the radiobiologically hypoxic fraction in tumors. Int J Radiat Oncol Biol Phys. 1980;6(1):117–20. doi: 10.1016/0360-3016(80)90215-1. [DOI] [PubMed] [Google Scholar]
- 66.Adams GE, Dische S, Fowler JF, Thomlinson RH. Hypoxic cell sensitisers in radiotherapy. Lancet. 1976;1(7952):186–8. doi: 10.1016/s0140-6736(76)91285-x. [DOI] [PubMed] [Google Scholar]
- 67.Chapman JD. Hypoxic sensitizers--implications for radiation therapy. N Engl J Med. 1979;301(26):1429–32. doi: 10.1056/NEJM197912273012606. [DOI] [PubMed] [Google Scholar]
- 68.Wardman P. Chemical radiosensitizers for use in radiotherapy. Clin Oncol (R Coll Radiol) 2007;19(6):397–417. doi: 10.1016/j.clon.2007.03.010. [DOI] [PubMed] [Google Scholar]
- 69.Wood PM. The potential diagram for oxygen at pH 7. Biochem J. 1988;253(1):287–9. doi: 10.1042/bj2530287. [DOI] [PMC free article] [PubMed] [Google Scholar]
- 70.Narayanan VL, Lee WW. Development of radiosensitizers: a medicinal chemistry perspective. Adv Pharmacol Chemother. 1982;19:155–205. doi: 10.1016/s1054-3589(08)60023-x. [DOI] [PubMed] [Google Scholar]
- 71.Brown DM, Yu NY, Brown JM, Lee WW. In vitro and in vivo radiosensitization by 2-nitroimidazoles more electron-affinic than misonidazole. Int J Radiat Oncol Biol Phys. 1982;8(3–4):435–8. doi: 10.1016/0360-3016(82)90655-1. [DOI] [PubMed] [Google Scholar]
- 72.Sakurada O, Kennedy C, Jehle J, Brown JD, Carbin GL, Sokoloff L. Measurement of local cerebral blood flow with iodo [14C] antipyrine. Am J Physiol. 1978;234(1):H59–66. doi: 10.1152/ajpheart.1978.234.1.H59. [DOI] [PubMed] [Google Scholar]
- 73.Pardridge WM, Triguero D, Yang J, Cancilla PA. Comparison of in vitro and in vivo models of drug transcytosis through the blood-brain barrier. J Pharmacol Exp Ther. 1990;253(2):884–91. [PubMed] [Google Scholar]
- 74.Krohn KA, Link JM, Mason RP. Molecular imaging of hypoxia. J Nucl Med. 2008;49 (Suppl 2):129S–48S. doi: 10.2967/jnumed.107.045914. [DOI] [PubMed] [Google Scholar]
- 75.Piert M, Machulla HJ, Picchio M, et al. Hypoxia-specific tumor imaging with 18F-fluoroazomycin arabinoside. J Nucl Med. 2005;46(1):106–13. [PubMed] [Google Scholar]
- 76.Brown JM, Workman P. Partition coefficient as a guide to the development of radiosensitizers which are less toxic than misonidazole. Radiat Res. 1980;82(1):171–90. [PubMed] [Google Scholar]
- 77.Kumar P, Stypinski D, Xia H, McEwan AJ, Machulla HJ, Wiebe K. Synthesis, 2H and 3H-labelling and preliminary biological evaluaation of a novel 2-nitroimidazole marker of tissue hypoxia. J Label Compd Radiopharm. 1999;42:3–16. [Google Scholar]
- 78.Sorger D, Patt M, Kumar P, et al. [18F]Fluoroazomycinarabinofuranoside (18FAZA) and [18F]Fluoromisonidazole (18FMISO): a comparative study of their selective uptake in hypoxic cells and PET imaging in experimental rat tumors. Nucl Med Biol. 2003;30(3):317–26. doi: 10.1016/s0969-8051(02)00442-0. [DOI] [PubMed] [Google Scholar]
- 79.Bacchu V, Kumar P, Wiebe L. Krohn K, editor. Personal Communication. 2014.
- 80.Sasai K, Shibamoto Y, Takahashi M, et al. A new, potent 2-nitroimidazole nucleoside hypoxic cell radiosensitizer, RP170. Jpn J Cancer Res. 1989;80(11):1113–8. doi: 10.1111/j.1349-7006.1989.tb02267.x. [DOI] [PMC free article] [PubMed] [Google Scholar]
- 81.Dubois LJ, Lieuwes NG, Janssen MH, et al. Preclinical evaluation and validation of [18F]HX4, a promising hypoxia marker for PET imaging. Proc Natl Acad Sci U S A. 2011;108(35):14620–5. doi: 10.1073/pnas.1102526108. [DOI] [PMC free article] [PubMed] [Google Scholar]
- 82.Zegers CM, van Elmpt W, Wierts R, et al. Hypoxia imaging with [(1)(8)F]HX4 PET in NSCLC patients: defining optimal imaging parameters. Radiother Oncol. 2013;109(1):58–64. doi: 10.1016/j.radonc.2013.08.031. [DOI] [PubMed] [Google Scholar]
- 83.Dubois L, Landuyt W, Cloetens L, et al. [18F]EF3 is not superior to [18F]FMISO for PET-based hypoxia evaluation as measured in a rat rhabdomyosarcoma tumour model. Eur J Nucl Med Mol Imaging. 2009;36(2):209–18. doi: 10.1007/s00259-008-0907-x. [DOI] [PubMed] [Google Scholar]
- 84.Mahy P, De Bast M, de Groot T, et al. Comparative pharmacokinetics, biodistribution, metabolism and hypoxia-dependent uptake of [18F]-EF3 and [18F]-MISO in rodent tumor models. Radiother Oncol. 2008;89(3):353–60. doi: 10.1016/j.radonc.2008.06.008. [DOI] [PubMed] [Google Scholar]
- 85.Chitneni SK, Bida GT, Yuan H, et al. 18F-EF5 PET imaging as an early response biomarker for the hypoxia-activated prodrug SN30000 combined with radiation treatment in a non-small cell lung cancer xenograft model. J Nucl Med. 2013;54(8):1339–46. doi: 10.2967/jnumed.112.116293. [DOI] [PMC free article] [PubMed] [Google Scholar]
- 86.Minn H, Gronroos TJ, Komar G, et al. Imaging of tumor hypoxia to predict treatment sensitivity. Curr Pharm Des. 2008;14(28):2932–42. doi: 10.2174/138161208786404380. [DOI] [PubMed] [Google Scholar]
- 87.Clavo AC, Brown RS, Wahl RL. Fluorodeoxyglucose uptake in human cancer cell lines is increased by hypoxia. J Nucl Med. 1995;36(9):1625–32. [PubMed] [Google Scholar]
- 88.Zimny M, Gagel B, DiMartino E, et al. FDG--a marker of tumour hypoxia? A comparison with [18F]fluoromisonidazole and pO2-polarography in metastatic head and neck cancer. Eur J Nucl Med Mol Imaging. 2006;33(12):1426–31. doi: 10.1007/s00259-006-0175-6. [DOI] [PubMed] [Google Scholar]
- 89.Rajendran JG, Mankoff DA, O’Sullivan F, et al. Hypoxia and glucose metabolism in malignant tumors: evaluation by [18F]fluoromisonidazole and [18F]fluorodeoxyglucose positron emission tomography imaging. Clin Cancer Res. 2004;10(7):2245–52. doi: 10.1158/1078-0432.ccr-0688-3. [DOI] [PubMed] [Google Scholar]
- 90.Thorwarth D, Eschmann SM, Holzner F, Paulsen F, Alber M. Combined uptake of [18F]FDG and [18F]FMISO correlates with radiation therapy outcome in head-and-neck cancer patients. Radiother Oncol. 2006;80(2):151–6. doi: 10.1016/j.radonc.2006.07.033. [DOI] [PubMed] [Google Scholar]
- 91.Vera P, Bohn P, Edet-Sanson A, et al. Simultaneous positron emission tomography (PET) assessment of metabolism with (1)(8)F-fluoro-2-deoxy-d-glucose (FDG), proliferation with (1)(8)F-fluoro-thymidine (FLT), and hypoxia with (1)(8)fluoro-misonidazole (F-miso) before and during radiotherapy in patients with non-small-cell lung cancer (NSCLC): a pilot study. Radiother Oncol. 2011;98(1):109–16. doi: 10.1016/j.radonc.2010.10.011. [DOI] [PubMed] [Google Scholar]
- 92.Yeh SH, Liu RS, Wu LC, et al. Fluorine-18 fluoromisonidazole tumour to muscle retention ratio for the detection of hypoxia in nasopharyngeal carcinoma. Eur J Nucl Med. 1996;23(10):1378–83. doi: 10.1007/BF01367595. [DOI] [PubMed] [Google Scholar]
- 93.Muzi M, Peterson L, Spence A, et al. Quantitative [F-18]fluoromisonidazole (FMISO) imaging of hypoxia using image-based blood surrogates. J Nuc Med. 2012 [Google Scholar]
- 94.Zygogianni A, Kyrgias G, Kouvaris J, Pistevou-Gompaki K, Kouloulias V. A new role of PET/CT for target delineation for radiotherapy treatment planning for head and neck carcinomas. Hell J Nucl Med. 2012;15(2):139–43. [PubMed] [Google Scholar]
- 95.Rasey JS, Koh WJ, Evans ML, et al. Quantifying regional hypoxia in human tumors with positron emission tomography of [18F]fluoromisonidazole: a pretherapy study of 37 patients. Int J Radiat Oncol Biol Phys. 1996;36(2):417–28. doi: 10.1016/s0360-3016(96)00325-2. [DOI] [PubMed] [Google Scholar]
- 96.Bollineni VR, Kerner GS, Pruim J, et al. PET imaging of tumor hypoxia using 18F-fluoroazomycin arabinoside in stage III–IV non-small cell lung cancer patients. J Nucl Med. 2013;54(8):1175–80. doi: 10.2967/jnumed.112.115014. [DOI] [PubMed] [Google Scholar]
- 97.Gu S, Chakraborty G, Champley K, et al. Applying a patient-specific biomathematical model of glioma growth to develop virtual [18F]-FMISO-PET images. Math Med Biol. 2012;29(1):31–48. doi: 10.1093/imammb/dqr002. [DOI] [PMC free article] [PubMed] [Google Scholar]
- 98.Swanson KR, Chakraborty G, Wang CH, et al. Complementary but distinct roles for MRI and 18F-fluoromisonidazole PET in the assessment of human glioblastomas. J Nucl Med. 2009;50(1):36–44. doi: 10.2967/jnumed.108.055467. [DOI] [PMC free article] [PubMed] [Google Scholar]
- 99.Bentzen SM, Gregoire V. Molecular imaging-based dose painting: a novel paradigm for radiation therapy prescription. Semin Radiat Oncol. 2011;21(2):101–10. doi: 10.1016/j.semradonc.2010.10.001. [DOI] [PMC free article] [PubMed] [Google Scholar]
- 100.Okamoto S, Shiga T, Yasuda K, et al. High reproducibility of tumor hypoxia evaluated by 18F-fluoromisonidazole PET for head and neck cancer. J Nucl Med. 2013;54(2):201–7. doi: 10.2967/jnumed.112.109330. [DOI] [PubMed] [Google Scholar]
- 101.Eschmann SM, Paulsen F, Reimold M, et al. Prognostic impact of hypoxia imaging with 18F-misonidazole PET in non-small cell lung cancer and head and neck cancer before radiotherapy. J Nucl Med. 2005;46(2):253–60. [PubMed] [Google Scholar]
- 102.Kobayashi H, Hirata K, Yamaguchi S, Terasaka S, Shiga T, Houkin K. Usefulness of FMISO-PET for Glioma Analysis. Neurol Med Chir (Tokyo) 2013 doi: 10.2176/nmc.ra2013-0256. [DOI] [PMC free article] [PubMed] [Google Scholar]
- 103.Koh WJ, Bergman KS, Rasey JS, et al. Evaluation of oxygenation status during fractionated radiotherapy in human nonsmall cell lung cancers using [F-18]fluoromisonidazole positron emission tomography. Int J Radiat Oncol Biol Phys. 1995;33(2):391–8. doi: 10.1016/0360-3016(95)00170-4. [DOI] [PubMed] [Google Scholar]
- 104.Askoxylakis V, Dinkel J, Eichinger M, et al. Multimodal hypoxia imaging and intensity modulated radiation therapy for unresectable non-small-cell lung cancer: the HIL trial. Radiat Oncol. 2012;7:157. doi: 10.1186/1748-717X-7-157. [DOI] [PMC free article] [PubMed] [Google Scholar]
- 105.Cheng J, Lei L, Xu J, et al. 18F-fluoromisonidazole PET/CT: a potential tool for predicting primary endocrine therapy resistance in breast cancer. J Nucl Med. 2013;54(3):333–40. doi: 10.2967/jnumed.112.111963. [DOI] [PubMed] [Google Scholar]
- 106.Kim BW, Cho H, Chung JY, et al. Prognostic assessment of hypoxia and metabolic markers in cervical cancer using automated digital image analysis of immunohistochemistry. J Transl Med. 2013;11:185. doi: 10.1186/1479-5876-11-185. [DOI] [PMC free article] [PubMed] [Google Scholar]
- 107.Eary JF, Link JM, Muzi M, et al. Multiagent PET for risk characterization in sarcoma. J Nucl Med. 2011;52(4):541–6. doi: 10.2967/jnumed.110.083717. [DOI] [PMC free article] [PubMed] [Google Scholar]
- 108.Wilson WR, Hay MP. Targeting hypoxia in cancer therapy. Nat Rev Cancer. 2011;11(6):393–410. doi: 10.1038/nrc3064. [DOI] [PubMed] [Google Scholar]
- 109.Koumenis C, Hammond E, Giaccia A. Tumor microenvironment and cellular stress: signaling, metabolism, imaging, and therapeutic targets. Preface Adv Exp Med Biol. 2014;772:v–viii. doi: 10.1007/978-1-4614-5915-6. [DOI] [PubMed] [Google Scholar]