

Abstract
The striatum is a major input site of the basal ganglia, which play an essential role in decision making. Previous studies have suggested that subareas of the striatum have distinct roles: the dorsolateral striatum (DLS) functions in habitual action, the dorsomedial striatum (DMS) in goal-directed actions, and the ventral striatum (VS) in motivation. To elucidate distinctive functions of subregions of the striatum in decision making, we systematically investigated information represented by phasically active neurons in DLS, DMS, and VS. Rats performed two types of choice tasks: fixed- and free-choice tasks. In both tasks, rats were required to perform nose poking to either the left or right hole after cue-tone presentation. A food pellet was delivered probabilistically depending on the presented cue and the selected action. The reward probability was fixed in fixed-choice task and varied in a block-wise manner in free-choice task. We found the following: (1) when rats began the tasks, a majority of VS neurons increased their firing rates and information regarding task type and state value was most strongly represented in VS; (2) during action selection, information of action and action values was most strongly represented in DMS; (3) action-command information (action representation before action selection) was stronger in the fixed-choice task than in the free-choice task in both DLS and DMS; and (4) action-command information was strongest in DLS, particularly when the same choice was repeated. We propose a hypothesis of hierarchical reinforcement learning in the basal ganglia to coherently explain these results.
Keywords: action value, basal ganglia, decision making, reinforcement learning, state value, striatum
Introduction
The basal ganglia are known to play an essential role in decision making. The striatum, the major input site of the basal ganglia, has a dorsolateral-ventromedial gradient in its input modality. That is, the dorsolateral striatum receives sensorimotor-related information and the ventromedial region receives associative and motivational information (Voorn et al., 2004; Samejima and Doya, 2007). This organization suggests different roles for different subareas of the striatum in decision making (Balleine et al., 2007; Wickens et al., 2007).
Lesion studies suggest that the dorsomedial striatum (DMS) and the dorsolateral striatum (DLS) contribute differently to goal-directed actions (DMS), and habitual actions (DLS), respectively (Yin et al., 2004, 2005a, b, Yin et al., 2006; Balleine et al., 2007; Balleine and O'Doherty, 2010). Lesion and recording studies of the ventral striatum (VS) suggested its role in motivation in response to reward-predicting cues (Berridge and Robinson, 1998; Cardinal et al., 2002; Nicola, 2010).
Based on reinforcement learning theory (Watkins and Dayan, 1992; Sutton and Barto, 1998), the actor-critic model hypothesizes that the patch compartment, dominant in VS, realizes the critic that learns reward prediction in the form of a “state value,” and the matrix compartment, dominant in the dorsal striatum (DS), implements the actor that learns action selection (Houk et al., 1995; Joel et al., 2002). A variant of the hypothesis is that matrix neurons learn “action values” of candidate actions (Doya, 1999, 2000). Theoretical models also suggested that model-based action selection, which can realize flexible, goal-directed action selection (Doya, 1999; Daw et al., 2005, 2011) occurs in the network linking the prefrontal cortex and the striatum.
To further clarify different roles of subregions of the striatum, however, it is essential to record from DLS, DMS, and VS during choice behaviors. Many previous recording studies have reported neural representations of state, action, reward, past action, past reward, reward expectation, action value, and chosen value within the striatum, but without systematic differences between the subregions (Samejima et al., 2005; Pasquereau et al., 2007; Lau and Glimcher, 2008; Hori et al., 2009; Ito and Doya, 2009; Kim et al., 2009; Kimchi and Laubach, 2009; Kimchi et al., 2009; Roesch et al., 2009; Wunderlich et al., 2009; Stalnaker et al., 2010; Gremel and Costa, 2013; Kim et al., 2013). A small number of studies have reported some regional differences: upcoming action in DS, but not in VS (Kim et al., 2009), upcoming state in VS, but not in DS (van der Meer et al., 2010), and stronger past-action information in DMS than in DLS (Kim et al., 2013).
In this study, we systematically analyzed neuronal activities from DLS, DMS, and VS of rats performing a nose-poke choice task consisting of fixed-choice and free-choice blocks. We specifically investigated two predictions: (1) representation of action values is strongest in DMS; and (2) action-command representation is stronger in fixed-choice blocks than in free-choice blocks in DLS and the opposite holds in DMS.
Materials and Methods
Subjects.
Male Long–Evans rats (n = 7; 250–350 g body weight; ∼14–29 weeks old) were housed individually under a reversed light/dark cycle (lights on at 20:00, off at 08:00). Experiments were performed during the dark phase. Food was provided after training and recording sessions so that body weights dipped no lower than 90% of initial levels. Water was supplied ad libitum. The Okinawa Institute of Science and Technology Animal Research Committee approved the study.
Apparatus.
All training and recording procedures were conducted in a 40 × 40 × 45 cm experimental chamber placed in a sound-attenuating box (O'Hara & Co.). The chamber was equipped with three nose-poke holes in one wall and a pellet dish on the opposite wall (see Fig. 1A). Each nose-poke hole was equipped with an infrared sensor to detect head entry, and the pellet dish was equipped with an infrared sensor to detect the presence of a sucrose pellet (25 mg) delivered by a pellet dispenser. The chamber top was open to allow connections between electrodes mounted on the rat's head and an amplifier. House lights, a video camera, and a speaker were placed above the chamber. A computer program written with LabVIEW (National Instrument) was used to control the speaker and the dispenser and to monitor states of the infrared sensors.
Figure 1.

Task design. A, Schematic illustration of the experimental chamber. The chamber was equipped with three holes for nose poking (L, left hole; C, center hole; R, right hole) and a pellet dish (D). B, Time sequence of choice tasks. After a rat poked its nose into the center hole, one of three cue tones was presented. The rat had to maintain the nose-poke in the center hole during presentation of the cue tone. After offset of the cue tone, the rat was required to perform a nose-poke in either the left or right hole and then either a reward tone or a no-reward tone was presented. The reward tone was followed by delivery of a sucrose pellet in the food dish. The reward probability was determined by the given cue tone and the chosen action. C, The reward probabilities for cue tones and actions. For the left tone, the reward probabilities were (left, right) = (50%, 0%). For the right tone, the probabilities were (left, right) = (0%, 50%). These probabilities were fixed throughout the experiments. For the choice tone, reward probabilities were varied: one of four pairs of reward probabilities [(left, right) = (90%, 50%), (50%, 90%), (50%, 10%), and (10%, 50%)] were used for each block.
Behavioral task.
Animals were trained to perform a free-choice task and a fixed-choice task using nose-poke responses. In either task, each trial started with a tone presentation (start tone: 2300 Hz, 1000 ms). When the rat performed a nose-poke in the center hole for 500–1000 ms, one of three cue tones (left tone: 900 Hz, 1000–2000 ms; right tone: 6500 Hz; 1000–2000 ms; and choice tone: white noise, 1000–2000 ms) was presented (see Fig. 1B). The left and right tones indicated which choices a rat should make to have the highest probability of a reward. In contrast, the choice tone offered no information, forcing the rat to make a choice. The rat had to maintain the nose-poke in the center hole during presentation of the cue tone. Otherwise, the trial was ended (a wait-error trial) with the presentation of an error tone (9500 Hz, 1000 ms). After offset of the cue tone, the rat was required to perform a nose-poke in either the left or right hole within 60 s (otherwise, the trial was ended as an error trial after the error tone) and then either a reward tone (500 Hz, 1000 ms) or a no-reward tone (500 Hz, 250 ms) was presented. The reward tone was followed by delivery of a sucrose pellet in the food dish. Reward probabilities were varied depending on the cue tone and the chosen action (see Fig. 1C). Reward probabilities were fixed for the left tone (50% chance of reward for the left hole choice, 0% for right hole choice) and the right tone (0%, 50%). Reward probabilities for the choice tone were varied in a block-wise manner among the four settings: (L90%, R50%), (50%, 90%), (50%, 10%), and (10%, 50%).
Surgery.
After rats mastered the free-choice task, they were anesthetized with pentobarbital sodium (50 mg/kg, i.p.) and placed in a stereotaxic frame. The skull was exposed and holes were drilled in the skull over the recording site. Three drivable electrode bundles were implanted into DLS in the left hemisphere (0.7 mm anterior, 3.8 mm lateral from bregma, 4.0 mm ventral from the brain surface), DMS in the left hemisphere (0.4 mm posterior, 2.0 mm lateral from bregma, 3.2 mm ventral from the brain surface), and VS in the right hemisphere (1.7 mm anterior, 1.7 mm lateral from bregma, 6.0 mm ventral from the brain surface). An electrode bundle was composed of eight Formvar-insulated, 25 μm bare diameter nichrome wires (A-M Systems) and was inserted into a stainless-steel guide cannula (0.3 mm outer diameter; Unique Medical). Tips of the microwires were cut with sharp surgical scissors so that ∼1.5 mm of each tip protruded from the cannula. Each tip was electroplated with gold to obtain an impedance of 100–200 kΩ at 1 kHz. Electrode bundles were advanced by 125 μm per recording day to acquire activity from new neurons.
Electrophysiological recording.
Recordings were made while rats performed fixed- and free-choice tasks. Neuronal signals were passed through a head amplifier at the head stage and then fed into the main amplifier through a shielded cable. Signals passed through a bandpass filter (50∼3000 Hz) to a data acquisition system (Power1401; CED), by which all waveforms that exceeded an amplitude threshold were time-stamped and saved at a sampling rate of 20 kHz. The threshold amplitude for each channel was adjusted so that action potential-like waveforms were not missed while minimizing noise. After a recording session, the following off-line spike sorting was performed using a template-matching algorithm and principal component analysis by Spike2 (Spike2; CED): recorded waveforms were classified into several groups based on their shapes, and a template waveform for each group was computed by averaging. Groups of waveforms that generated templates that appeared to be action potentials were accepted, and others were discarded. Then, to test whether accepted waveforms were recorded from multiple neurons, principal component analysis was applied to the waveforms. Clusters in principal component space were detected by fitting a mixture Gaussian model, and each cluster was identified as signals from a single neuron. This procedure was applied to each 50 min data segment; and if stable results were not obtained, the data were discarded.
Then, gathered spike data were refined by omitting data from neurons that satisfied at least one of the five following conditions: (1) The amplitude of waveforms increased >150% or decreased <50% during the recording session. (2) The amplitude of waveforms was <7× the SD of background noise. (3) The firing rate calculated by perievent time histograms (PETHs) (from −4.0 s to 4.0 s with 100 ms time bin based on the onset of cue tone, the exit of the center hole, or the entrance of the left or right hole) was <1.0 Hz for all time bins of all PSTHs. (4) The firing rate represented by EASHs (see below) with 10 ms time bins smoothed by Gaussian filter with σ = 10 ms (see Fig. 3D–I, black) was <1.0 Hz at any time bin. (5) The estimated recording site was considered to be outside the target. Furthermore, considering the possibility that the same neuron was recorded from different electrodes in the same bundle, we calculated cross-correlation histograms with 1 ms time bins for all pairs of neurons that were recorded from different electrodes in the same bundle. If the frequency at 0 ms was 10× larger than the mean frequency (from −200 ms to 200 ms, except the time bin at 0 ms) and their PETHs had similar shapes, either one of the pair was removed from the database. After this procedure, to extract phasically active neurons (PANs; putative medium spiny neurons), the proportion of time-spent intervals (ISIs) that was >1 s (PropISIs >1 s) was calculated for each neuron (Schmitzer-Torbert and Redish, 2004). Then, the neurons for which PropISIs >1 s was >0.4 were regarded as PANs.
Figure 3.

Representative activity patterns of phasic active neurons in the striatum. A, Tracks of accepted electrode bundles for all rats are indicated by rectangles. Neurons recorded from blue, green, or red rectangles were classified as DLS, DMS, and VS neurons, respectively. Each diagram represents a coronal section referenced to the bregma (Paxinos and Watson, 1998). B, A raster showing spikes of a DLS neuron and corresponding events in free-choice and forced-choice trials, which are aligned with the entry time into the center hole. Bottom, PETH with 10 ms bins for this neuron. C, A corrected raster plot and an event-aligned spike histogram (EASH) with 10 ms bins, derived by linearly scaling time intervals between task events in each trial to the average intervals across all trials. Numbers of spikes between events are preserved. D–I, EASHs for representative neurons from DLS (D, E), DMS (F, G), and VS (H, I). Top, Four different blue and red lines indicate the EASHs from four different pairs of selected actions and reward outcomes. Bottom, Purple and orange lines indicate EASHs for fixed-choice blocks and free-choice blocks, respectively. Black lines indicate averages of EASHs for all trials. All EASHs (10 ms bins) are smoothed by Gaussian kernel with 30 ms SD. D, Same neuron shown in B and C.
Histology.
After all experiments were completed, rats were anesthetized as described in the surgery section, and a 10 μA positive current was passed for 30 s through one or two recording electrodes of each bundle to mark the final recording positions. Rats were perfused with 10% formalin containing 3% potassium hexacyanoferrate (II), and brains were carefully removed so that the microwires would not cause tissue damage. Sections were cut at 60 μm on an electrofreeze microtome and stained with cresyl violet. Final positions of electrode bundles were confirmed using dots of Prussian blue. The position of each recorded neuron was estimated from the final position and the moved distance of the bundle of electrodes. If the position was outside DLS, DMS, or VS, recorded data were discarded.
Decision trees.
To estimate a decision tree for choice tones (see Fig. 2D), sequences of choice behavior in choice-tone trials were extracted. We denote the action in the tth choice trial as a(t) ∈ {L, R}, the reward as r(t) ∈ {0, 1}, and the experience as follows:
The conditional probability of making a left choice given the preceding sequence of experiences is estimated by the following:
 |
where NL(e(t − 1), e(t − 2),…, e(t − d)) and NR(e(t − 1), e(t − 2),…, e(t − d)) are the number of occurrence of the left (L) and right (R) actions, respectively, after the experience of (e(t − 1), e(t − 2),…, e(t − d)). d is the number of previous trials taken into consideration. In this study, conditional probabilities of left choices were calculated for all possible combinations for d = 1 and d = 2. In the same way, to estimate a decision tree for a left or right tone, sequences of choice behavior in left-tone- or right-tone-trials (both in single fixed-choice blocks and in double fixed-choice blocks) were used, respectively (for more detail, see Ito and Doya, 2009).
Figure 2.

Rat performance in fixed-choice and free-choice blocks. A, A representative example of a rat's performance. Blue, red, and orange vertical lines indicate individual choices for left, right, and choice tones, respectively. A sequence of blocks consisted of two single fixed-choice blocks (left- or right-tone trials), two double fixed-choice blocks (mix of left- and right-tone trials), and four free-choice blocks with different reward probabilities (choice-tone trials). Bottom, Blue, red, and orange represent the probability of a left choice for each tone (average of the last 20 trials). When the choice frequency of the action that was associated with higher reward probability reached 80%, the block was changed. “e” indicates an extinction test, consisting of 5 trials without reward delivery. This block sequence was repeated two or three times in one day recording sessions. B, The average left-choice probability during extinction tests (five unrewarded trials for each cue tone) with 95% confidence intervals (shaded bands). Left choice probabilities for left tones, right tones, and choice tones are plotted in blue, red, and orange colors, respectively. Left-choice probabilities for choice tone trials were separated by the optimal action in the previous free-choice block (the upper graph for left, the lower graph for right). C, Averages of left-choice probabilities over five extinction trials for left tone (blue), choice tone (orange), and right tone (red) with 95% confidence intervals. Top and bottom orange plots represent the average of the upper and lower orange graphs, respectively in B. ***p < 0.0001 (χ2 test). D, The decision tree for choice tones, the left choice probability for all possible experiences in one and two previous trials. Four types of experiences in one trial [left or right times rewarded (1) or no reward (0)] are represented by different colors and line types. For instance, left probability after L1 is indicated by the right edge of a blue solid line (green arrow), and left probability after L1 R0 (L1 and then R0) is indicated by the right edge of a red broken line connected to the blue solid line (brown arrow). Values of trials = 0 (x-axis) represent the left choice probability for all trials. Shaded bands indicate 95% confidence intervals. E, F, Decision trees for left tones and right tones, respectively. Conditional left choice probabilities for left-tone (E) and right-tone trials (F) in single- and double-fixed blocks are represented in the same manner as in D. G, Accuracy of each model in predicting rat choices. Prediction accuracy was defined by the normalized likelihood of test data. Free parameters of each model were determined by maximization of the likelihood of training data. Markov d stands for dth Markov model, a standard prediction model from the past d trials. Q, FQ, and DFQ indicate variations of reinforcement learning models. Numbers followed by the name of models indicate the numbers of free parameters of each model. “const” means that the parameters (α1, α2, κ1, and κ2) were assumed to be constant for all sessions, and “variable” means that the parameters were assumed to vary. **p < 0.01, significant difference from the prediction accuracy of FQ-learning (variable) (paired-sample Wilcoxon's signed rank tests). *p < 0.05, significant difference from the prediction accuracy of FQ-learning (variable) (paired-sample Wilcoxon's signed rank tests). H, An example of predictions of rat choices based on the FQ-model with time-varying parameters. Top, Green line indicates PL(t) = L), the probability that a rat would select left at trial t, estimated from the rat's past experiences e(1), e(2), …, e(t−1). Vertical line indicates the rat's actual choice in each trial. Top lines and bottom lines indicate left and right choices, respectively. Black and gray represent reward and no-reward trials, respectively. Middle, Estimated action values, QL and QR. Bottom, Estimated κ1 and κ2.
Evaluation of decision-making models.
Any decision-making models for a single stimulus (state) and binary choice (action) can be defined by the conditional probability of a current action, given past experiences as follows:
 |
where e(1:t − 1) is a simple description of e(1), e(2), …, e(t − 1). Behavioral data are composed of a set of sequences (sessions) of actions and rewards. If necessary, we use the index l for the index of sessions, for example, a{l}(t). The number of trials for session l is represented by Tl, and the number of sessions is L.
To fit the parameters to the choice data and evaluate the models, we used the likelihood criterion, which is the probability that the observed data were produced by the model. The likelihood can be normalized, so that it equals 0.5 when predictions are made with chance-level accuracy (PL(t) = 0.5 for all t). The normalized likelihood is defined by the following:
 |
where z{l}(t) is the likelihood for a single trial as follows:
 |
The (normalized) likelihood can be regarded as the prediction accuracy, namely, how accurately the model predicts actions using past experiences. Generally, models that have a larger number of free parameters can fit the data more accurately and show a higher likelihood. However, these models may not be able to fit new data due to overfitting. For a fair comparison of models, choice data were divided into training data (101 sessions) and test data (101 sessions). Free parameters of a model were determined by maximizing the likelihood of the training data. Then, the model was evaluated by the likelihood or the normalized likelihood of test data (holdout validation).
Markov models.
Markov models are the simplest nonparametric models. They predict an action from experiences in the past d trials. For all possible sequences of actions and rewards in d trials, different parameters defining an action probability were assigned as follows:
 |
where w represents the free parameters (for parameter search, see Ito and Doya, 2009). Markov models provide a useful measure to objectively evaluate other models.
DFQ-learning model.
The DFQ-learning model (Ito and Doya, 2009) is an extension of the Q-learning models. Action values Qi, which are estimates of the rewards from taking an action i ∈ {L, R}, are updated by the following:
 |
where α1 is the learning rate for the selected action, α2 is the forgetting rate for the action not chosen, κ1 represents the strength of reinforcement by reward, and κ2 represents the strength of the aversion resulting from the no-reward outcome. This set of equations can be reduced to standard Q-learning by setting α2 = 0 (no forgetting for actions not chosen) and κ2 = 0 (no aversion from a lack of reward). The FQ model is a version introducing the restriction α1 = α2. Using the action values, the prediction of the choice at trial t was given by the following:
 |
We considered cases of fixed and time-varying parameters. For fixed parameter models, a set of parameters α1, α2, κ1, and κ2 were free parameters, which were assumed to be constant for all sessions. For time-varying parameters, α1, α2, κ1, and κ2 were estimated in each trial, assumed to vary according to the following:
 |
where ζj and ξj are noise terms drawn independently from a Gaussian distribution N(0, σα2) and N(0, σκ2), respectively, and σα and σκ are free parameters that control the magnitude of change. The predictive distribution P(h(t)|e(1:t − 1)) of parameters h = [QL, QR, α1, α2, κ1, κ2] given past experiences e(1:t − 1) was estimated using a particle filter (Samejima et al., 2005; Ito and Doya, 2009). The action probability PL(t) was obtained from Equation 1 with the mean of the predictive distribution of QL(t) and QR(t). In this study, 5000 particles were used for the estimation.
Event-aligned spike histogram (EASH).
In our choice task, six task events were defined: entry into the center hole (E1), onset of the cue tone (E2), offset of the cue tone (E3), exit from the center hole (E4), entry into the left or right hole (E5), and exit from the left or right hole (E6). The interval between task events varied by trials. To align task event timings for all trials, EASHs were proposed. First, the average duration for each event interval was calculated; from E1 to E2 (Phase 2) = 0.75 s, E2 to E3 (Phase 3) = 1.50 s, E3 to E4 (Phase 4) = 0.54 s, E4 to E5 (Phase 5) = 0.76 s, and E5 to E6 (Phase 6) = 0.38 s. Then, spike timings during each event interval for each trial were linearly transformed into a corresponding averaged event interval. The number of spikes in each event interval was preserved. Furthermore, we defined time points E0 (2 s before E1) and E7 (2 s after E8) to define Phase 1 (from E0 to E1) and Phase 7 (from E6 to E7). The transformation described above was not applied to spike timings in Phases 1 and 7 because the durations of these Phases were not changed by trials. In this way, a regular raster plot (see Fig. 3B, top) was transformed into an event-aligned raster plot (see Fig. 3C, top). Then, by taking a time histogram with 10 ms bins of the transformed raster plot, EASH was obtained (see Fig. 3C, bottom).
Mutual information.
To elucidate when and how much information from each event, such as state, action, reward, was coded in neuronal activity, the mutual information shared between firing and each event was calculated using the method described by Ito and Doya (2009). For a certain time window in each trial, we defined a neuronal activity as F and a task event as X. F is a random variable taking f1, f2, f3, or f4 for each trial, which represents the level of firing rate. X is a random variable taking x1 or x2, corresponding to chosen action, left or right, respectively, for the action information (mutual information between firing rate and action). For the state information, x1 and x2 correspond to fixed-choice and free-choice blocks, and for the reward information, x1 and x2 correspond to rewarded and unrewarded choices, respectively. Mutual information shared by F and X is defined by the following:
 |
For each neuron, mutual information (bits/s) was estimated (for more detail, see Ito and Doya, 2009) for every 100 ms time bin of an EASH, using whole trials, including single fixed-, double fixed-, and free-choice blocks (see Fig. 5A,C,F). To test whether the averaged mutual information (see Fig. 5B,D,E,G) was significant, the threshold indicating significant information (p < 0.01) was obtained in the following manner. A binary event, x1 or x2, was generated randomly for each trial, and the mutual information between this random event and spikes was calculated for all neurons. Then the mutual information was averaged over each region. This calculation was repeated 100 times with new random events. Then the second largest mutual information for each time window was regarded as the threshold indicating significant information.
Figure 5.
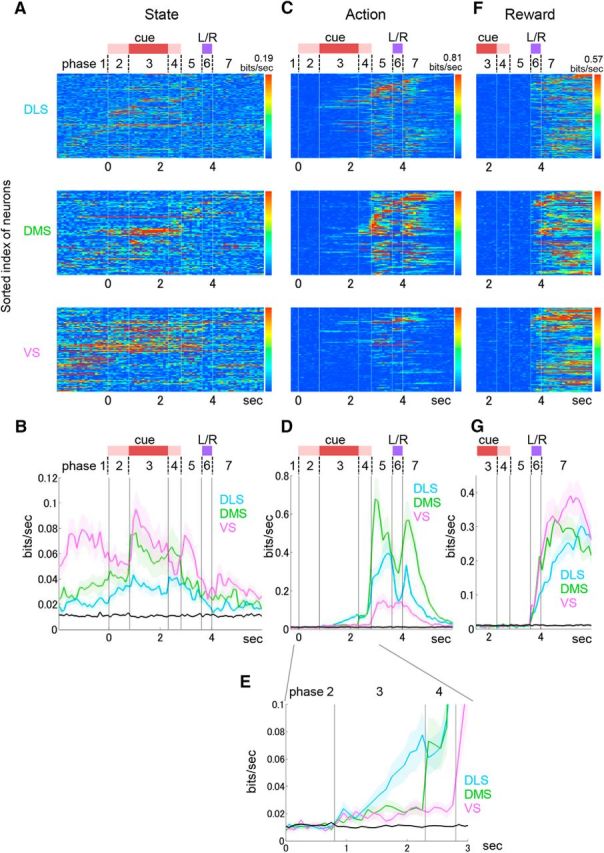
Information coding of state, action, and reward. A, State information coded in each neuron. Mutual information between firing rate for each 100 ms time bin of EASH and state (fixed-choice blocks or free-choice blocks) (bit/s) is shown by pseudocolor. Indices of neurons are the same as in Figure 4A. B, Averaged state information for the neurons in each subarea. C, Action information (left or right hole choice), calculated using both fixed- and free-choice blocks. D, Averaged action information over the neurons in each subarea. E, Action information before execution of action (close-up of D). F, Reward information (delivered or not), calculated using both fixed- and free-choice blocks. G, Averaged reward information over the neurons in each subarea. B, D, E, G, Black lines indicate thresholds with significant information (p < 0.01). Shaded bands represent SE.
Regression analysis.
We conducted multiple linear regression analysis to capture the information coded in neuronal firing. Because there are various candidates for explanatory variables, selecting a set of explanatory variables is an important issue. A fitting model using many parameters tends to show low fitting error but can result in overfitting. Furthermore, if some explanatory variables in a regression model are correlated, a regression analysis tends to fail to detect these variables, resulting in a Type II error. In the present study, we used the Bayesian information criterion (BIC) to select a set of explanatory variables from the full model (2) (described in Results). BIC can be regarded as a fitting measure taking into account the penalty for the number of parameters in the model. Assuming that the model errors ε(t) are independent and identically distributed according to a normal distribution, the BIC is given by the following:
 |
where N is the amount of data, k is a number of the parameters (the number of β), and σ̂2 is the error variance defined by the following:
 |
Here, ŷ(t) is a prediction from the model in which the parameters βi are tuned so that σ̂2 is minimized. If a model shows a smaller BIC, it means that the model is better. Because the full regression model (2) includes six variables (including the constant variable for β0), we can consider 26 models for all combinations, regardless of whether explanatory variables are included. We calculated the BIC for all combinations, and then we selected a set of explanatory variables that showed the smallest BIC. Then, we tested the statistical significance of each regression coefficient in the selected model using the regular regression analysis. If p < 0.01, the corresponding variable was regarded as being coded in the firing rate. This variable selection was conducted independently for each neuron and for each time bin.
Results
We recorded neuronal activity from DLS, DMS, and VS of rats (n = 7) performing fixed-choice and free-choice tasks in an experimental chamber (Fig. 1A). After a rat poked its nose into the center hole, one of three cue tones (left tone, right tone, and choice tone) was presented (Fig. 1B,C). Reward probabilities were varied depending on the cue tone and the chosen action (Fig. 1C). Reward probabilities were fixed for the left tone (50% for left choice, 0% for right choice) and the right tone (0%, 50%). Reward probabilities for the choice tone were varied in a block-wise manner out of the four settings: (90%, 50%), (50%, 90%), (50%, 10%), and (10%, 50%). In the first and second blocks, the left and right tones were presented, respectively (single fixed-choice block) (Fig. 2A). In the third and fourth blocks, the left and right tones were randomly presented upon each trial (double fixed-choice blocks). In the fifth to eighth blocks, only the choice tone was presented (free-choice blocks) (Fig. 2A). Four reward probability pairs (Fig. 1C) were randomly assigned to the four blocks. The same block was held until at least 20 choice trials were completed (40 trials for double fixed-choice blocks). A block was completed when the choice frequency of the action associated with the higher reward probability reached 80% during the last 20 trials (40 trials for both tones in double fixed-choice blocks) and a new block was started with no explicit cue presented to the rats. To assess sensitivity to the change of reward probability, an extinction test consisting of 5 trials with no reward was conducted for the left and right tones between the third and fourth double fixed-choice blocks and for the choice tone between sixth and seventh free-choice blocks. This block sequence was repeated two or three times in one day recording session.
Numbers of trials required to complete one block were 22.56 ± 8.70 for single fixed-choice blocks, 47.11 ± 20.29 for double fixed-choice blocks, and 41.10 ± 27.58 for free-choice blocks, (mean ± SD). Here, we report the results of all 78,107 trials in 86 recording sessions, performed by seven rats, consisting of 12,185 single fixed-choice trials (16.4%), 22,234 double fixed-choice trials (30.0%), 36,292 free-choice trials (48.9%), and 3505 extinction test trials (4.7%).
Behavioral performance
First, we tested whether action selection was sensitive to the reward omission in fixed-choice blocks and free-choice blocks. In the extinction tests (Fig. 2B,C), whereas the choice probabilities for the free-choice tone shifted toward 50% following the first nonrewarded trial (orange lines, Fig. 2B), choice probabilities for the left and right tones remained biased even after five no-reward trials (Fig. 2B, blue and red lines), suggesting a low sensitivity to the change in reward contingency. Choice probabilities during extinction tests were significantly different between the left and right tones and the choice tone (Fig. 2C; p < 0.0001, χ2 test).
Decision trees (Fig. 2D–F) indicate how choice probabilities changed with previous action and reward experiences. The decision tree for choice tones expands symmetrically (Fig. 2D), indicating that action selection was sensitive to past experiences, as in our previous study of free-choice trials (Ito and Doya, 2009). On the other hand, action probabilities for the left or right tones (in both single and double fixed-choice blocks) are biased toward 1 (Fig. 2E) or 0 (Fig. 2F), respectively, indicating insensitivity to past experiences.
These results suggest that the action selection in the free-choice blocks was more flexible and action selection in the fixed-choice blocks more inflexible. The action in the fixed-choice blocks might be related to habitual action (Barnes et al., 2005; Bayley et al., 2005; Broadbent et al., 2007). In recent years, the term “habitual action” is often used as a contrast of “goal-directed action”; and in this context, these actions are distinguished by outcome devaluation tests and/or contingency degradation tests (Yin et al., 2004, 2005a, b, 2006; Balleine et al., 2007; Balleine and O'Doherty, 2010). It requires further experiments to test whether the behaviors in the fixed- and free-choice blocks in the present task can be regarded as goal-directed and habitual actions, respectively.
We then analyzed choice sequences in the free-choice task using value-based reinforcement-learning models (Ito and Doya, 2009). We used DFQ-learning (Q-learning with differential forgetting) models, in which action values Qi(t) for i = {L or R} were updated by the previous action and reward with four parameters: the learning rate α1 for the action chosen, the forgetting rate α2 for the action not chosen, the strength of reinforcement κ1 of a reward, and the strength of aversion κ2 from no-reward. DFQ-learning models are experience based, model-free algorithms that cannot reproduce goal-directed behaviors.
We consider cases of fixed parameters and time-varying parameters. For fixed parameters, these were assumed to be constant for all sessions. For time-varying parameters, these were assumed to vary with drift-rate parameters σa and σk, and estimated along with time courses of action values by dynamic Bayesian inference (Ito and Doya, 2009). We tested six subtypes of DFQ models (Q-learning with α2 = κ 2 = 0, FQ-learning with α1 = α2, and full DFQ learning for fixed or time-varying parameters) and found that the FQ-learning model with time-varying parameters predicted rat behaviors best (Fig. 2G). Prediction accuracy was higher than that of Markov models (generic time-series prediction models). The dth Markov model is a purely descriptive model, which predicts an action from the past limited experiences in the d last trials. This model fitting result was almost the same as in our previous study (Ito and Doya, 2009). Rat actions were predicted by the FQ-model with time-varying parameters (κ1 and κ2; α is not shown), and estimated action values for left (QL) and right (QR) (Fig. 2H), which were used for the analysis of neuronal activity (see Figs. 7 and 8).
Figure 7.

Model-based analysis of action value and state value. A, A DLS neuron showing the correlation with the action value for left, QL. EASHs for trials with higher QL and lower QL are shown with green and gray lines, respectively (top left). Blue and red rectangles represent significant neuronal correlations with each variable (p < 0.01, t test) (bottom left). For QL and QR, blue and red colors represent positive and negative correlations, respectively. For action, blue and red represent higher activity in left- and right-selected trials, respectively. For reward, blue and red represent higher activity in rewarded and unrewarded trials. The firing rate in the yellow time bins for each trial (gray lines) was smoothed with a Gaussian filter (black lines) (top right). QL, estimated by the FQ model, is shown with gray lines, and the smoothed one is indicated with black lines (bottom right). B, A DMS neuron showing the negative correlation with QL. C, An action-independent, value-coding (state-value coding) neuron in VS, showing the negative correlation with both QL and QR.
Figure 8.

The proportion of neurons coding action, previous action, reward, previous reward, action value, and state value. Proportions of neurons showing significant correlation with each variable (p < 0.01, t test) are shown for DLS, DMS, and VS. These neurons were detected by multiple linear regression analysis, which was conducted for 500 ms before and after the seven trial events. Colored disks represent that the populations are significantly higher than the chance level (p < 0.01, binominal test). Colored dots in the upper area indicate significant differences in the proportions between subareas (p < 0.05, Mann–Whitney U test). A, Action-coding neurons. B, Neurons coding action in previous trials. C, Reward-coding neurons. D, Neurons coding rewards in previous trials. E, Action-value-coding neurons. Action-value-coding neurons are defined as neurons showing correlation with either QL or QR. F, Action-independent value-coding (state-value-coding) neurons. These neurons are defined as neurons showing correlation with both QL and QR having the same sign.
We also tested a regular actor-critic model with constant variables (Sutton and Barto, 1998), but the normalized likelihood of test data was close to the chance level (0.5080; data not shown). For actor-critic models, we can consider numerous variations of actor models; however, we could not find adequate actor-critic models that fit the rats' behavior better than the Q-learning models with constant variables.
Activity patterns of phasically active neurons
We recorded neuronal activity in DLS, DMS, and VS of rats performing fixed- and free-choice tasks. Each rat was wired with three bundles of eight microwires. Bundles were progressed by 125 μm between recording sessions so that data from new neurons were acquired in each session. Stable recordings were made from 260 neurons in DLS, 178 neurons in DMS, and 179 neurons in VS from seven rats (Fig. 3A) (see Materials and Methods). Among these, 190, 105, and 119 neurons from DLS, DMS, and VS, respectively, were classified as PANs (putative medial spiny projection neurons) based on statistics of interspike intervals (Schmitzer-Torbert and Redish, 2004) and waveforms (see Materials and Methods). Only data from these PANs were used for the following analyses.
Intervals of time between task events (the commencement of center hole poking, the onset of cue tone, the offset of cue tone, the termination of center hole poking, the start of L/R hole poking, and the end of L/R hole poking) varied across trials (Fig. 3B). To develop an overall neuronal activity profile despite this timing variability, we created event-aligned spike histograms (EASHs) (Fig. 3C). An EASH is derived by linearly scaling time intervals between task events in each trial to the average interval across all trials (see Materials and Methods). The peak at the start of L/R poking is clearer in the EASH than in the PETH aligned by the timing of center hole entry (Fig. 3B,C). We defined the intervals between task events as trial Phases 1 through 7 (Fig. 3C). DLS, DMS, and VS neurons were activated at different task events and phases, such as the start of center hole poking (Fig. 3D), and in different trial phases, such as between the exit from the center hole and the start of left or right hole poking (trial Phase 5, execution of action) (Fig. 3D,F,G). Most neurons changed their activity patterns depending on upcoming actions, selected actions, reward outcomes, and types of choice blocks. For instance, DLS neurons (Fig. 3D and 3E) changed their activities before action execution depending on whether the left or right hole was to be selected. Activities of DMS and VS neurons were modulated by both executed actions and reward outcomes (Fig. 3F,H). DMS and VS neurons (Fig. 3G and Fig. 3I, respectively) showed different activities in fixed-choice blocks and free-choice blocks. Interestingly, Roesch et al. (2009) conducted similar fixed- and free-choice tasks using odor stimuli, and reported that population activity pattern in VS was the same between these tasks. A possible reason for this difference is that Roesch et al. (2009) randomly selected fixed-choice and free-choice in every trial, while in our task these trials were separated in different blocks (Fig. 2A).
To develop an overview of neural activity profiles in DLS, DMS and VS, we visualized normalized EASHs of all PANs (Fig. 4A), where indices of neurons are sorted by their activation peaks. For each trial phase, we found neurons that increased their activity in all three subareas, but in different proportions (Fig. 4B). The proportion of neurons that increased their activity as a rat approached the center hole (trial Phase 1) was >60% in VS, significantly larger than in DLS and DMS (p = 0.0015 and p < 0.0001, respectively, χ2 test). After a rat's exit from the center hole until its entrance into the L/R hole (trial Phase 5), >60% of DMS neurons were activated, which was significantly larger than the proportions of DLS and VS (p = 0.00021 for DLS, p = 0.040 for VS, χ2 test). During the trial phase of receiving a sugar pellet (trial Phase 7), the proportion of activated neurons was significantly larger in VS than in DLS (p = 0.0040, χ2 test). Furthermore, VS neurons maintained activation longer (more than half of peak activity) than DLS (p < 0.0001, Mann–Whitney U test) and DMS neurons (p < 0.0001, Mann–Whitney U test), and DLS neurons had shorter durations of activation than VS neurons and DMS neurons (p < 0.0001 for VS, p = 0.040 for DMS, Mann–Whitney U test) (Fig. 4C).
Figure 4.

Activity pattern in the striatum. A, Normalized activity patterns of all recorded PANs from DLS (N = 190), DMS (N = 105), and VS (N = 119). An activity pattern for each neuron was normalized so that the maximum of the EASH was 1 and represented by pseudo-color (values from 0 to 1 are represented from blue to red). Indices of neurons were sorted based on the time that the normalized EASH first surpassed 0.5. Seven trial phases were defined based on task events. B, Preferred trial phases for each subarea. The proportion of neurons, the normalized EASHs of which reached 0.5 during each trial phase. **p < 0.01, *p < 0.05 (χ2 test). C, The averaged activity ratio of striatal neurons for each subarea. The activity ratio (the duration, in which the normalized EASH was >0.5, divided by the duration of the corresponding trial phase) was calculated for each trial phase. Then the proportions of the activity duration were averaged over the trial phases. **p < 0.01, *p < 0.05, (Mann–Whitney U test).
Information coding of state, action, and reward
To elucidate when and how much information about each task event was represented in each subarea of the striatum, the amount of mutual information between neuronal firing and each task event was calculated (Panzeri and Treves, 1996; Ito and Doya, 2009).
State information (fixed- or free-choice block) was strongest in VS, especially, during the approach to the center hole (trial Phase 1) (p < 0.0001 for DLS, p = 0.022 for DMS, Mann–Whitney U tests) (Fig. 5A,B). During this phase more than 60% of VS neurons were activated (trial Phase 1, Fig. 4A,B). Action information (left or right hole choice) started increasing during the tone presentation (trial Phase 3) specifically in DLS (Fig. 5C–E).
Regarding action information, Kim et al. (2009) reported that slight, but significant upcoming-action signals were represented in DS but not in VS. In this study, we found consistent and more detailed action representations. Action information during the 100 ms before the offset of the cue tone was significantly higher in DLS than in DMS and VS (p = 0.0175 for DMS, p = 0.00091 for VS, Mann–Whitney U tests). Immediately after the offset of the cue tone (trial Phase 4) action information in DMS rapidly increased and became higher than that in DLS and VS during the 100 ms before the offset from the center hole, while information in VS was weakest (p = 0.16 for DLS, p = 0.0027 for VS, p < 0.0001 for DLS vs VS, Mann–Whitney U tests) (Fig. 5D,E). During action execution (trial Phase 5), the action information was the highest in DMS (p < 0.0001 for DLS, p < 0.0001 for VS, p < 0.0001 for DLS vs VS, Mann–Whitney U tests) (Fig. 5D).
Reward information (delivered or not) started rising simultaneously in all subareas after the start of L/R poking, when the reward or no-reward tone was presented (trial Phase 6, Fig. 5G). Reward information was strongest in VS, followed by DMS, and reward information in DLS was significantly less than that in VS and DMS (p = 0.012 for DLS vs DMS, p < 0.0001 for DLS vs VS, p = 0.13 for DMS vs VS, Mann–Whitney U tests). We also found similar patterns in the proportion of event-coding neurons, namely, how many neurons changed their firing rates for selected actions, reward outcomes, and the different choice blocks (states) (Fig. 6). For instance, the proportion of state-coding neurons during cue presentation (trial Phase 3) was the largest in VS, and the proportion of action-coding neurons was the largest in DLS before action execution and in DMS during action execution. The proportion of reward-coding neurons was the largest in VS during the L/R poking (Fig. 6D). These proportions in the population were similar in fixed-choice and free-choice blocks (Fig. 6B,C).
Figure 6.
Percentages of neurons coding state, action, and reward. A, Time bins during which neuronal activities were compared for each event. B, C, Percentages of neurons that showed significant selectivity (Mann–Whitney U test, p < 0.01) for each event in fixed-choice blocks (B) and free-choice blocks (C). Action command (AC) and action-coding neurons are defined as neurons that show significantly different firing rates in left- and right-selected trials for 500 ms before or after action execution (offset of center-hole poking), respectively. Reward1 and Reward2 are reward-coding neurons that show reward selectivity for 500 ms before and after offset of L/R poking, respectively. D, Percentages of event-coding neurons detected by whole trials. State-coding neurons are defined as neurons that showed different firing rates in fixed- and free-choice blocks. B–D, All populations are significantly larger than the chance level (binomial test, p < 0.01). **p < 0.01, *p < 0.05, significant differences in percentages between subareas (χ2 test). E, The tendency of preferences of event-coding neurons shown in D. Percentages of neurons that showed higher activity in fixed-choice than in free-choice, in left-selected trials than in right-selected trials, or in rewarded trials than in unrewarded trials, respectively, among each event-coding neuron. **p < 0.01, *p < 0.05, significant difference from 0 (Wilcoxon signed-rank test).
Model-based analysis of action value and state value coding
We then conducted a model-based analysis of neural coding (Corrado and Doya, 2007; O'Doherty et al., 2007) using the FQ-learning model with time-varying parameters that best fit rat behaviors during free-choice blocks (Fig. 2G,H) (Ito and Doya, 2009). We conducted multiple linear regression analysis using the following regression model:
 |
where y(t) is the number of spikes in trial t at a certain time bin. βi is the regression coefficient, a(t) is actions (1 for left, 2 for right), and r(t) is reward (1 for reward, 0 for no-reward). a(t − 1) and r(t − 1) are action and reward in the previous trials, respectively. QL(t) and QR(t) are action values estimated using FQ-learning model, and ε(t) is an error term. The second term, βLt, was inserted to absorb any increasing or decreasing trend in the firing rate during a session. How to select a set of explanatory variables is an important issue in regression analyses. In this analysis, for each neuron and for each time bin, we chose the set of explanatory variables from the full model (2) so that the BIC was minimized (see Materials and Methods).
The firing rate of a DLS neuron (Fig. 7A) was significantly correlated with the left action value QL during cue presentation before action onset (trial Phase 3). Firing of DMS neurons (Fig. 7B) showed a negative significant correlation with the left action value QL during action execution (trial Phase 5). VS neurons that had negatively correlated firing with both left and right action values during the approach to the center hole (trial Phase 1), suggested state-value coding (Fig. 7C). Firing of neurons in these 100 ms time bins changed in a remarkably similar manner to the time courses of action values and state values estimated from animal behavior (Fig. 7A–C).
Substantial proportions of neurons in DLS, DMS, and VS coded actions before and after action execution (Fig. 8A). Kim et al. (2013) reported that action in the previous trial was strongly coded in DMS through the entire trial period; and in our experiment, although the previous action signal in DMS seemed to be relatively weak, a significant proportion of DMS neurons coded previous actions during action execution (trial Phase 5; Fig. 8B). Substantial proportions of neurons in all subareas coded rewards after the start of L/R hole poking (Fig. 8C), and rewards in the previous trial were also strongly coded in all trial phases in all striatal regions (Fig. 8D), consistent with previous studies (Ito and Doya, 2009; Kim et al., 2009, 2013).
Action-value coding neurons are defined as neurons with activities significantly correlated with either action value, left (QL) or right (QR). Although significant proportions of neurons in each subarea had action-value coding in all trial phases, the proportion of action-value coding neurons was highest in DMS during action execution (Fig. 8E; p = 0.00058 for DLS, p = 0.081 for VS, Mann–Whitney U test). The majority of these action value-coding neurons in DMS represented QR, the action value for right hole choice, and the proportion of neurons coding QR during action execution was significant larger in DMS than in DLS (p = 0.00017, Mann–Whitney U test), both of which were recorded from the left hemisphere.
The strongest action value representation in DMS is consistent with our prediction (I). We also found action-independent value-coding neurons (state-value coding neurons), which are defined as neurons with activities significantly correlated with both action values with the same sign. The proportion of state-value coding neurons was the highest in VS in all trial phases, especially in starting phase (trial Phase 1) and action initiation phase (trial Phase 4), the proportion was significantly larger in VS than in DLS and DMS (p = 0.039 for DMS and p = 0.0027 for DLS, in trial Phase 1; p = 0.024 for DMS and p = 0.0045 for DLS, first half of Phase 4; Mann–Whitney U test) (Fig. 7F). We did not find significant numbers of policy-coding neurons (those with significant correlations with both action values with opposite signs), in any subarea or in any time bin (data not shown).
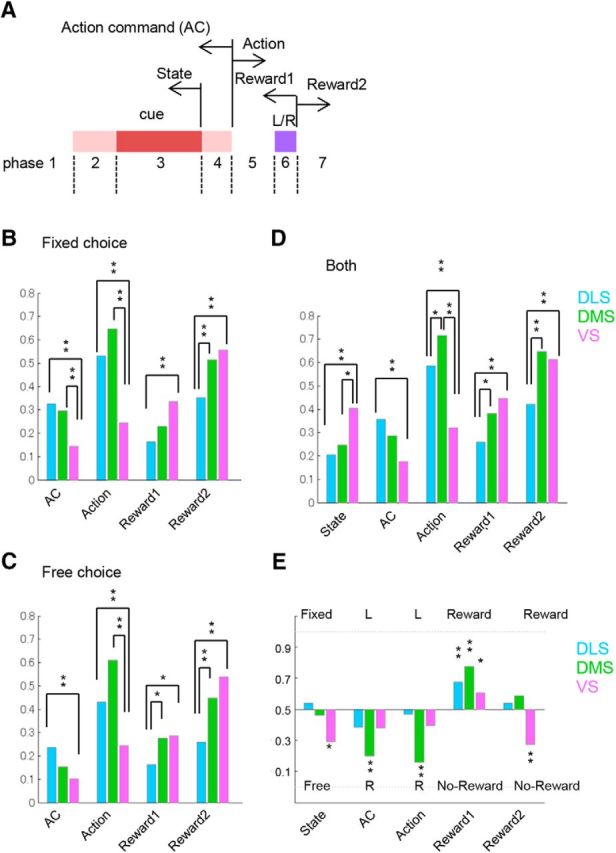
Action-command information in fixed- and free-choice blocks
To assess the roles of different subareas in the striatum in fixed- and free-choice blocks, we compared action command coding in the three subareas separately for four different task blocks; the single fixed-choice block, the double fixed-choice block, the free-choice block with higher reward probabilities [(L = 90%, R = 50%) and (50%, 90%)], and the free-choice block with lower reward probabilities [(L = 50%, R = 10%) and (10%, 50%)] (Fig. 9). We calculated action information from the last 20 trials in each block so that the estimation bias of the mutual information was identical for all types of blocks. Action information in the single and double fixed-choice blocks started to rise first in DLS during cue presentation and then in DMS after cue offset (trial Phase 4), and finally in VS after onset of action execution (trial Phase 5) (Fig. 9A,B). Contrary to expectation, this temporal pattern of action information was seen also in free-choice blocks (Fig. 9C,D). There were no conditions in which the action command in DMS was stronger than in DLS.
Figure 9.

Action-command information in fixed- and free-choice blocks. Mutual information per seconds between action (upcoming action for Phases 2–4, executing action for Phases 5 and 6), and firing in the last 20 trials of four different blocks. A, Single fixed-choice blocks. B, Double fixed-choice blocks. C, Free-choice blocks with higher reward probabilities [(L = 90%, R = 50%) and (50%, 90%)]. D, Free-choice blocks with lower reward probabilities [(L = 50%, R = 10%) and (10%, 50%)]. The plot of action information starts from a triangle indicating the time when the value surpassed the significance level (p < 0.01). Action information was calculated using a sliding time window of the preceding 500 ms (step size, 50 ms) to clarify after which task event the action command signal increased.
We also compared the strength of action coding in different blocks for each subarea (Fig. 10). In DLS, the action information in single and double fixed-choice blocks started increasing immediately after the onset of cue presentation (Fig. 10A). Action information in free-choice blocks with higher rewards increased more slowly than that in fixed-choice blocks, and action information in free-choice blocks with lower rewards appeared later and was weaker. There were significant differences in action information between fixed-choice blocks and free-choice blocks in trial Phase 3 (during the 500 ms before cue presentation) and trial Phase 4 (during the 500 ms before center hole exit) (p = 0.00047 and p = 0.00037, respectively, paired-Mann–Whitney U test). In DMS, action information was stronger in single and double fixed-choice blocks than in free-choice blocks (Fig. 10B), similar to that in DLS, with significant differences in trial Phases 3 and 4 (p = 0.040 for Phase 3, p = 0.0029 for Phase 4, paired-Mann–Whitney U test). Action information in VS had a transient peak during cue presentation only in single, fixed-choice blocks and remained low until the onset of action execution (Fig. 10C) with no significant differences between fixed- and free-choice blocks in trial Phases 3 and 4 (p = 0.23 and p = 0.28, respectively, paired-Mann–Whitney U test). While stronger action information coding in fixed-choice blocks by DLS neurons is consistent with our prediction (II), the same stronger action information in fixed-choice blocks found also in DMS neurons is contrary to our prediction (II).
Figure 10.

Action-command information in DLS, DMS, and VS. A–C, Action information during single fixed-choice blocks (SF), double fixed-choice blocks (DF), the free-choice block with higher reward probabilities (FH), and the free-choice block with lower reward probabilities (FL) averaged for DLS (A), DMS (B), and VS (C). D–F, Action information during free-choice blocks when the action was the same as in the previous trials (stay), or when the action was switched from the previous action (switch). The plot of action information starts from a triangle indicating the time when the value surpassed the significance level (p < 0.01). Action information in this figure was calculated using a sliding time window of the preceding 500 ms (step size, 50 ms) to clarify after which task event the action command signal was increased.
We further analyzed the action command in free-choice blocks depending on whether the action was the same as in the previous trial (stay trials) or different (switch trials) (Fig. 10D–F). In DLS, action information was stronger in stay trials than in switch trials in trial Phase 3 (during the 500 ms before cue presentation) (p = 0.019, Mann–Whitney U test). In DMS, however, we could not find any difference in the action-command signal between switch and stay trials.
Discussion
To clarify the distinct roles of DLS, DMS, and VS in decision making, we recorded neuronal activity from these portions of the striatum of rats performing a fixed-choice task and a free-choice task. The analysis of phasically active neurons, which are thought to be medial spiny neurons, revealed differences in the temporal profiles of firing and information coding. When rats began the tasks by approaching the center hole, more than half of VS neurons increased their firing (Fig. 4A,B), and activities coded the information of the task condition (fixed- or free-choice blocks) (Figs. 5B and 6D) and a state value (Fig. 8F). When presentation of the cue tone started, action information began to rise only in DLS (Fig. 5E). Then, immediately after offset of the cue tone, action information in DMS sharply increased (Fig. 5D,E). When rats started moving to the left or right hole, action information became higher in DMS than in DLS and VS, and the proportion of action-value coding neurons increased specifically in DMS (Fig. 8C).
Clear peaks of action-value information during action execution in DMS and state-value representation in VS are consistent with our prediction (I). Contrary to our prediction (II), action information before action execution was stronger in fixed-choice blocks than in free-choice blocks in both DLS and DMS (Figs. 9 and 10). However, further analysis of free-choice blocks revealed that action-command coding was stronger in stay trials than in switch trials in DLS, although there was no significant difference in DMS (Fig. 10D,E). This suggests relatively stronger involvement of DLS in repetitive behaviors.
Action value and state value coding
Although neuronal correlation with action values has been reported mainly in DS (Samejima et al., 2005; Pasquereau et al., 2007; Lau and Glimcher, 2008; Hori et al., 2009; Kim et al., 2009; Wunderlich et al., 2009), clear differences in action-value representation among the subregions of the striatum have not been detected (Kim et al., 2009, 2013; Stalnaker et al., 2010). In support of the prediction (I), our analysis revealed that the highest signal of action values occurred in DMS during action execution (Fig. 8E). This is consistent with the role of action values in realizing flexible action selection. Regarding state values, consistent with previous suggestions (O'Doherty et al., 2004; Atallah et al., 2007; Takahashi et al., 2007, 2008), we observed neuronal correlation with a state-value signal most strongly in VS. A significant proportion of state-coding VS neurons were observed from the approaching period (trial Phase 1) to the action-initiation period (trial Phase 4) (Fig. 8F), supporting the idea that VS plays the role of the critic (Joel et al., 2002).
Different dynamics of action command in DLS and DMS
The information of upcoming action, namely, action command, has been found in DS of monkeys performing a choice task (Pasupathy and Miller, 2005; Samejima et al., 2005; Pasquereau et al., 2007). By contrast, in rodent studies, it has been reported that the action-command signal in DS was relatively weak or not represented in spatial choice tasks (Kim et al., 2009, 2013; Thorn et al., 2010; van der Meer et al., 2010). By contrast, Stalnaker et al. (2010) reported clear action-command signal in DLS and DMS, similar to our results. In both tasks, rats were required to keep nosepoking during the cue presentation before action selection. This immobile phase might be important to capture the action-command signal.
In our task, the rat had to maintain its nose-poke in the center hole until the offset of a cue tone before moving to the left or right hole; otherwise, the trial was ended as an error trial without a reward. Thus, this task required two processes. One was to wait until the offset of the cue and the other was to select either left or right hole for the given cue. Considering the temporal profile of action-command coding (Fig. 5D,E), DLS and DMS appear to be involved in parallel and competitive decision modules. DLS might belong to an elementary decision module that rapidly selects an action responding to the given cue, ignoring the waiting process. DMS might belong to a comprehensive decision module, which can take into account both waiting and selecting. We speculate that a decision module related to DMS attempted to maintain nosepoking, whereas another decision module related to DLS attempted to respond. The action was realized when both modules agreed after offset of the cue tone in successful trials (no wait-error trials).
Action command in fixed- and free-choice blocks
In fixed-choice blocks, the rats kept responding to the same action for each tone cue regardless of the outcome, whereas in free-choice tasks the rats showed high sensitivity to reward omission and past experiences (Fig. 2B–F). From this result, we expected that action-command representation in DLS, which is involved in habitual action, would be stronger in fixed-choice blocks than in free-choice blocks, and this relation would be reversed in DMS, which is involved in flexible, goal-directed action.
However, in both DLS and DMS, the action-command signal was significantly stronger in fixed-choice blocks than in free-choice blocks (Fig. 10A,B). Stalnaker et al. (2010) conducted similar tasks using odor cues and also reported that the action command of DMS was stronger in forced-choice trials than in free-choice trials. Furthermore, temporal patterns of action-command signals of all subareas (Fig. 5D,E) were preserved when these were calculated separately for fixed- and free-choice blocks (Fig. 9). When we compared the action-command signal in stay trials and switch trials in free-choice blocks, while action-command coding was stronger in stay trials than in switch trials in DLS, we could not find stronger action-command coding in switch trials in DMS (Fig. 10D,E).
These results suggest that DLS or DMS becomes dominantly active in fixed- or free-choice tasks, respectively, is not correct. Our results show that the computations in DLS and DMS are not mutually exclusive but performed in parallel both in fixed- and free-choice tasks. The downstream network might select the final output depending on the task condition (Thorn et al., 2010).
Hierarchical reinforcement learning model
Summarizing previous findings, the roles of the three striatal subareas could be described as a “two actors-one critic” model. The DLS is involved in simple state-action or stimulus–response association (inflexible, habitual action), whereas the DMS performs action based on an action-outcome association (flexible, goal-directed action). The VS might help the learning of these two actors via a dopaminergic response. However, dissociation of DLS and DMS functions solely on the basis of habitual versus goal-directed actions could not explain our results (Figs. 4, 5, 6, 7, and 8).
An alternative model is that a hierarchical reinforcement learning system is realized across the dorsolateral-ventromedial axis of the basal ganglia (Samejima and Doya, 2007; Ito and Doya, 2011). In the present task, a rat needs to perform multiple motor actions to complete a single trial: approaching the center hole, sticking its nose into the hole, maintaining the nose-poke in the hole, and so on. It is reasonable to conclude that the stratum is also involved in these detailed actions. We proposed a working hypothesis that VS, DMS, and DLS are hierarchical learning modules in charge of actions at different physical and temporal scales (Ito and Doya, 2011). VS is the coarsest module governing actions of the whole animal, such as aiming for a goal, avoiding a danger, or just taking a rest. DMS is the middle module in charge of abstract actions, such as turn left, turn right, or go straight, by taking into account contextual information. DLS is the module in charge of the finest control of physical actions, such as the control of each limb. Consistent with this hypothesis, the averaged firing duration of VS neurons was the longest among three subareas, that of DMS neurons was the second, and DLS neurons showed the shortest firing duration (Fig. 4C).
A large majority of VS neurons was activated at the time that rats started the tasks (Fig. 4B). This might be interpreted to mean that VS is involved in higher-order decisions to initiate tasks, or as a signal to promote the flexible approach proposed by Nicola (2010). With regard to DMS, most neurons were activated during execution of the action selection (Fig. 4B), and at that time, action information was strongly represented (Fig. 5D). A similar DMS activation during action selection was also reported by Thorn et al. (2010). These findings suggest that DMS is the site most likely to be involved in decisions regarding abstract actions, such as “select the left hole” or “select the right hole.” Activity peaks of DLS neurons were not only sharper than those of DMS and VS (Fig. 4C) but also uniformly distributed compared with DMS and VS, in the absence of specific preferred task events (Fig. 4B). Each activity peak might help to control the body and limbs during a brief time window, as proposed by Ito and Doya (2011).
Footnotes
This work was supported by Ministry of Education, Culture, Sports, Science and Technology KAKENHI Grants 23120007 and 26120729, Japan Society for the Promotion of Science KAKENHI Grant 25430017, and Okinawa Institute of Science and Technology Graduate University research support to K.D. We thank anonymous reviewers, whose comments and criticisms greatly improved the manuscript; and Steven D. Aird, technical editor of Okinawa Institute of Science and Technology Graduate University, for thorough editing and proofreading.
The authors declare no competing financial interests.
References
- Atallah HE, Lopez-Paniagua D, Rudy JW, O'Reilly RC. Separate neural substrates for skill learning and performance in the ventral and dorsal striatum. Nat Neurosci. 2007;10:126–131. doi: 10.1038/nn1817. [DOI] [PubMed] [Google Scholar]
- Balleine BW, O'Doherty JP. Human and rodent homologies in action control: corticostriatal determinants of goal-directed and habitual action. Neuropsychopharmacology. 2010;35:48–69. doi: 10.1038/npp.2009.131. [DOI] [PMC free article] [PubMed] [Google Scholar]
- Balleine BW, Delgado MR, Hikosaka O. The role of the dorsal striatum in reward and decision-making. J Neurosci. 2007;27:8161–8165. doi: 10.1523/JNEUROSCI.1554-07.2007. [DOI] [PMC free article] [PubMed] [Google Scholar]
- Barnes TD, Kubota Y, Hu D, Jin DZ, Graybiel AM. Activity of striatal neurons reflects dynamic encoding and recoding of procedural memories. Nature. 2005;437:1158–1161. doi: 10.1038/nature04053. [DOI] [PubMed] [Google Scholar]
- Bayley PJ, Frascino JC, Squire LR. Robust habit learning in the absence of awareness and independent of the medial temporal lobe. Nature. 2005;436:550–553. doi: 10.1038/nature03857. [DOI] [PMC free article] [PubMed] [Google Scholar]
- Berridge KC, Robinson TE. What is the role of dopamine in reward: hedonic impact, reward learning, or incentive salience? Brain Res Rev. 1998;28:309–369. doi: 10.1016/S0165-0173(98)00019-8. [DOI] [PubMed] [Google Scholar]
- Broadbent NJ, Squire LR, Clark RE. Rats depend on habit memory for discrimination learning and retention. Learn Mem. 2007;14:145–151. doi: 10.1101/lm.455607. [DOI] [PMC free article] [PubMed] [Google Scholar]
- Cardinal RN, Parkinson JA, Hall J, Everitt BJ. Emotion and motivation: the role of the amygdala, ventral striatum, and prefrontal cortex. Neurosci Biobehav Rev. 2002;26:321–352. doi: 10.1016/S0149-7634(02)00007-6. [DOI] [PubMed] [Google Scholar]
- Corrado G, Doya K. Understanding neural coding through the model-based analysis of decision making. J Neurosci. 2007;27:8178–8180. doi: 10.1523/JNEUROSCI.1590-07.2007. [DOI] [PMC free article] [PubMed] [Google Scholar]
- Daw ND, Niv Y, Dayan P. Uncertainty-based competition between prefrontal and dorsolateral striatal systems for behavioral control. Nat Neurosci. 2005;8:1704–1711. doi: 10.1038/nn1560. [DOI] [PubMed] [Google Scholar]
- Daw ND, Gershman SJ, Seymour B, Dayan P, Dolan RJ. Model-based influences on humans' choices and striatal prediction errors. Neuron. 2011;69:1204–1215. doi: 10.1016/j.neuron.2011.02.027. [DOI] [PMC free article] [PubMed] [Google Scholar]
- Doya K. What are the computations of the cerebellum, the basal ganglia and the cerebral cortex? Neural Netw. 1999;12:961–974. doi: 10.1016/S0893-6080(99)00046-5. [DOI] [PubMed] [Google Scholar]
- Doya K. Complementary roles of basal ganglia and cerebellum in learning and motor control. Curr Opin Neurobiol. 2000;10:732–739. doi: 10.1016/S0959-4388(00)00153-7. [DOI] [PubMed] [Google Scholar]
- Gremel CM, Costa RM. Orbitofrontal and striatal circuits dynamically encode the shift between goal-directed and habitual actions. Nat Commun. 2013;4:2264. doi: 10.1038/ncomms3264. [DOI] [PMC free article] [PubMed] [Google Scholar]
- Hori Y, Minamimoto T, Kimura M. Neuronal encoding of reward value and direction of actions in the primate putamen. J Neurophysiol. 2009;102:3530–3543. doi: 10.1152/jn.00104.2009. [DOI] [PubMed] [Google Scholar]
- Houk JC, Adams JL, Barto AG. A model of how the basal ganglia generate and use neural signals that predict reinforcement. In: Houk JC, Davis JL, Beiser DG, editors. Models of information processing in the basal ganglia. Cambridge, MA: Massachusetts Institute of Technology; 1995. [Google Scholar]
- Ito M, Doya K. Validation of decision-making models and analysis of decision variables in the rat basal ganglia. J Neurosci. 2009;29:9861–9874. doi: 10.1523/JNEUROSCI.6157-08.2009. [DOI] [PMC free article] [PubMed] [Google Scholar]
- Ito M, Doya K. Multiple representations and algorithms for reinforcement learning in the cortico-basal ganglia circuit. Curr Opin Neurobiol. 2011;21:368–373. doi: 10.1016/j.conb.2011.04.001. [DOI] [PubMed] [Google Scholar]
- Joel D, Niv Y, Ruppin E. Actor-critic models of the basal ganglia: new anatomical and computational perspectives. Neural Netw. 2002;15:535–547. doi: 10.1016/S0893-6080(02)00047-3. [DOI] [PubMed] [Google Scholar]
- Kim H, Sul JH, Huh N, Lee D, Jung MW. Role of striatum in updating values of chosen actions. J Neurosci. 2009;29:14701–14712. doi: 10.1523/JNEUROSCI.2728-09.2009. [DOI] [PMC free article] [PubMed] [Google Scholar]
- Kim H, Lee D, Jung MW. Signals for previous goal choice persist in the dorsomedial, but not dorsolateral striatum of rats. J Neurosci. 2013;33:52–63. doi: 10.1523/JNEUROSCI.2422-12.2013. [DOI] [PMC free article] [PubMed] [Google Scholar]
- Kimchi EY, Laubach M. The dorsomedial striatum reflects response bias during learning. J Neurosci. 2009;29:14891–14902. doi: 10.1523/JNEUROSCI.4060-09.2009. [DOI] [PMC free article] [PubMed] [Google Scholar]
- Kimchi EY, Torregrossa MM, Taylor JR, Laubach M. Neuronal correlates of instrumental learning in the dorsal striatum. J Neurophysiol. 2009;102:475–489. doi: 10.1152/jn.00262.2009. [DOI] [PMC free article] [PubMed] [Google Scholar]
- Lau B, Glimcher PW. Value representations in the primate striatum during matching behavior. Neuron. 2008;58:451–463. doi: 10.1016/j.neuron.2008.02.021. [DOI] [PMC free article] [PubMed] [Google Scholar]
- Nicola SM. The flexible approach hypothesis: unification of effort and cue-responding hypotheses for the role of nucleus accumbens dopamine in the activation of reward-seeking behavior. J Neurosci. 2010;30:16585–16600. doi: 10.1523/JNEUROSCI.3958-10.2010. [DOI] [PMC free article] [PubMed] [Google Scholar]
- O'Doherty JP, Hampton A, Kim H. Model-based fMRI and its application to reward learning and decision making. Ann N Y Acad Sci. 2007;1104:35–53. doi: 10.1196/annals.1390.022. [DOI] [PubMed] [Google Scholar]
- O'Doherty J, Dayan P, Schultz J, Deichmann R, Friston K, Dolan RJ. Dissociable roles of ventral and dorsal striatum in instrumental conditioning. Science. 2004;304:452–454. doi: 10.1126/science.1094285. [DOI] [PubMed] [Google Scholar]
- Panzeri S, Treves A. Analytical estimates of limited sampling biases in different information measures. Network. 1996;7:87–107. doi: 10.1088/0954-898X/7/1/006. [DOI] [PubMed] [Google Scholar]
- Pasquereau B, Nadjar A, Arkadir D, Bezard E, Goillandeau M, Bioulac B, Gross CE, Boraud T. Shaping of motor responses by incentive values through the basal ganglia. J Neurosci. 2007;27:1176–1183. doi: 10.1523/JNEUROSCI.3745-06.2007. [DOI] [PMC free article] [PubMed] [Google Scholar]
- Pasupathy A, Miller EK. Different time courses of learning-related activity in the prefrontal cortex and striatum. Nature. 2005;433:873–876. doi: 10.1038/nature03287. [DOI] [PubMed] [Google Scholar]
- Paxinos G, Watson C. The rat brain stereotaxic coordinates. Ed 4. San Diego: Academic; 1998. [Google Scholar]
- Roesch MR, Singh T, Brown PL, Mullins SE, Schoenbaum G. Ventral striatal neurons encode the value of the chosen action in rats deciding between differently delayed or sized rewards. J Neurosci. 2009;29:13365–13376. doi: 10.1523/JNEUROSCI.2572-09.2009. [DOI] [PMC free article] [PubMed] [Google Scholar]
- Samejima K, Doya K. Multiple representations of belief states and action values in corticobasal ganglia loops. Ann N Y Acad Sci. 2007;1104:213–228. doi: 10.1196/annals.1390.024. [DOI] [PubMed] [Google Scholar]
- Samejima K, Ueda Y, Doya K, Kimura M. Representation of action-specific reward values in the striatum. Science. 2005;310:1337–1340. doi: 10.1126/science.1115270. [DOI] [PubMed] [Google Scholar]
- Schmitzer-Torbert N, Redish AD. Neuronal activity in the rodent dorsal striatum in sequential navigation: separation of spatial and reward responses on the multiple T task. J Neurophysiol. 2004;91:2259–2272. doi: 10.1152/jn.00687.2003. [DOI] [PubMed] [Google Scholar]
- Stalnaker TA, Calhoon GG, Ogawa M, Roesch MR, Schoenbaum G. Neural correlates of stimulus–response and response-outcome associations in dorsolateral versus dorsomedial striatum. Front Integr Neurosci. 2010;4:12. doi: 10.3389/fnint.2010.00012. [DOI] [PMC free article] [PubMed] [Google Scholar]
- Sutton RS, Barto AG. Reinforcement learning. Cambridge, MA: Massachusetts Institute of Technology; 1998. [Google Scholar]
- Takahashi Y, Roesch MR, Stalnaker TA, Schoenbaum G. Cocaine exposure shifts the balance of associative encoding from ventral to dorsolateral striatum. Front Integr Neurosci. 2007;1:11. doi: 10.3389/neuro.07.011.2007. [DOI] [PMC free article] [PubMed] [Google Scholar]
- Takahashi Y, Schoenbaum G, Niv Y. Silencing the critics: understanding the effects of cocaine sensitization on dorsolateral and ventral striatum in the context of an actor/critic model. Front Neurosci. 2008;2:86–99. doi: 10.3389/neuro.01.014.2008. [DOI] [PMC free article] [PubMed] [Google Scholar]
- Thorn CA, Atallah H, Howe M, Graybiel AM. Differential dynamics of activity changes in dorsolateral and dorsomedial striatal loops during learning. Neuron. 2010;66:781–795. doi: 10.1016/j.neuron.2010.04.036. [DOI] [PMC free article] [PubMed] [Google Scholar]
- van der Meer MA, Johnson A, Schmitzer-Torbert NC, Redish AD. Triple dissociation of information processing in dorsal striatum, ventral striatum, and hippocampus on a learned spatial decision task. Neuron. 2010;67:25–32. doi: 10.1016/j.neuron.2010.06.023. [DOI] [PMC free article] [PubMed] [Google Scholar]
- Voorn P, Vanderschuren LJ, Groenewegen HJ, Robbins TW, Pennartz CM. Putting a spin on the dorsal-ventral divide of the striatum. Trends Neurosci. 2004;27:468–474. doi: 10.1016/j.tins.2004.06.006. [DOI] [PubMed] [Google Scholar]
- Watkins CJCH, Dayan P. Q-learning. Machine Learning. 1992;8:279–292. doi: 10.1007/BF00992698. [DOI] [Google Scholar]
- Wickens JR, Budd CS, Hyland BI, Arbuthnott GW. Striatal contributions to reward and decision making: making sense of regional variations in a reiterated processing matrix. Ann N Y Acad Sci. 2007;1104:192–212. doi: 10.1196/annals.1390.016. [DOI] [PubMed] [Google Scholar]
- Wunderlich K, Rangel A, O'Doherty JP. Neural computations underlying action-based decision making in the human brain. Proc Natl Acad Sci U S A. 2009;106:17199–17204. doi: 10.1073/pnas.0901077106. [DOI] [PMC free article] [PubMed] [Google Scholar]
- Yin HH, Knowlton BJ, Balleine BW. Lesions of dorsolateral striatum preserve outcome expectancy but disrupt habit formation in instrumental learning. Eur J Neurosci. 2004;19:181–189. doi: 10.1111/j.1460-9568.2004.03095.x. [DOI] [PubMed] [Google Scholar]
- Yin HH, Knowlton BJ, Balleine BW. Blockade of NMDA receptors in the dorsomedial striatum prevents action-outcome learning in instrumental conditioning. Eur J Neurosci. 2005a;22:505–512. doi: 10.1111/j.1460-9568.2005.04219.x. [DOI] [PubMed] [Google Scholar]
- Yin HH, Ostlund SB, Knowlton BJ, Balleine BW. The role of the dorsomedial striatum in instrumental conditioning. Eur J Neurosci. 2005b;22:513–523. doi: 10.1111/j.1460-9568.2005.04218.x. [DOI] [PubMed] [Google Scholar]
- Yin HH, Knowlton BJ, Balleine BW. Inactivation of dorsolateral striatum enhances sensitivity to changes in the action-outcome contingency in instrumental conditioning. Behav Brain Res. 2006;166:189–196. doi: 10.1016/j.bbr.2005.07.012. [DOI] [PubMed] [Google Scholar]