

Abstract
Information processing in neuronal networks relies on the precise synchronization of ensembles of neurons, coordinated by the diverse family of inhibitory interneurons. Cortical interneurons can be usefully parsed by embryonic origin, with the vast majority arising from either the caudal or medial ganglionic eminences (CGE and MGE). Here, we examine the activity of hippocampal interneurons during gamma oscillations in mouse CA1, using an in vitro model where brief epochs of rhythmic activity were evoked by local application of kainate. We found that this CA1 KA-evoked gamma oscillation was faster than that in CA3 and, crucially, did not appear to require the involvement of fast-spiking basket cells. In contrast to CA3, we also found that optogenetic inhibition of pyramidal cells in CA1 did not significantly affect the power of the oscillation, suggesting that excitation may not be essential for gamma genesis in this region. We found that MGE-derived interneurons were generally more active than CGE interneurons during CA1 gamma, although a group of CGE-derived interneurons, putative trilaminar cells, were strongly phase-locked with gamma oscillations and, together with MGE-derived axo-axonic and bistratified cells, provide attractive candidates for being the driver of this locally generated, predominantly interneuron-driven model of gamma oscillations.
Keywords: axo-axonic, basket, gamma, interneurons, oscillation, trilaminar
Introduction
Information processing in neuronal networks relies on the precise synchronization of ensembles of neurons. Inhibitory interneurons are a diverse group of neurons that, although forming only a small percentage of all cortical neurons, are critical in orchestrating coordinated network activity. Different interneuron subtypes, through their unique structural and electrophysiological specializations, differentially modulate multiple brain rhythms (Freund and Buzsáki, 1996; McBain and Fisahn, 2001; Somogyi and Klausberger, 2005).
Interneuron subtypes have traditionally been categorized based on common features, such as morphology and firing patterns and, more recently, by embryonic origin (Lee et al., 2010). In the embryonic brain, interneurons destined to populate the hippocampus arise from progenitors in the medial and caudal ganglionic eminences (MGE and CGE), migrate tangentially through the developing cortex, and begin forming hippocampal circuits before birth. The MGE gives rise to parvalbumin-, somatostatin-, and NPY-positive interneurons, such as axo-axonic cells, fast-spiking basket cells, and Ivy cells, whereas the CGE gives rise to VIP-, calretinin-, reelin-, and cholecystokinin-positive interneurons, such as non–fast-spiking basket cells, trilaminar cells, and some neurogliaform cells (Tricoire et al., 2011). Interneuron characteristics, such as glutamate receptor subunit composition, vary predictably with embryonic origin (Matta et al., 2013), and we recently demonstrated that the apparently uniform group of hippocampal interneurons, the oriens-lacunosum moleculare (O-LM) projecting interneurons, actually consisted of two distinct subtypes of near-identical cells, separated by embryonic origin (Chittajallu et al., 2013). Surprisingly, MGE-derived O-LM cells were far more active during hippocampal gamma oscillations than their CGE-derived counterparts. Given that perisomatic targeting interneurons, thought to drive gamma oscillations (Hájos and Paulsen, 2009), are of MGE origin, this raises the possibility that MGE interneurons generally play a more prominent role in shaping network oscillations. To test this hypothesis, we examined the spiking behavior of both MGE- and CGE-derived interneurons in CA1 during gamma oscillations.
Gamma oscillations, thought to be essential for working memory (Lisman, 2010), can theoretically be generated purely through networks of mutually connected inhibitory interneurons (interneuron network gamma oscillations, ING model) or through networks of reciprocally connected excitatory pyramidal and inhibitory interneurons (pyramidal-interneuron network gamma oscillations, PING model) (Whittington et al., 2000). Hippocampal gamma oscillations are observed using in vitro slice preparations by bath-applying carbachol (Fisahn et al., 1998) or kainate (KA) (Traub et al., 2003), both resulting in a PING type oscillation ∼40 Hz, observed in CA3. Brief epochs of gamma oscillations can also be evoked through pressure application of KA above stratum radiatum in CA3 (Gloveli et al., 2005; Dugladze et al., 2012). Previously, we used this latter approach to evoke gamma oscillations in CA1 where, curiously, the gamma oscillations appeared to occur at high frequency (Chittajallu et al., 2013). In the present study, we further explored the cellular mechanisms generating gamma oscillations in CA1. We found that the oscillation arose from a local generator in CA1 and, surprisingly, did not appear to depend upon the participation of either fast-spiking basket cells or pyramidal cells, consistent with an ING model.
Materials and Methods
Animals.
All experiments were conducted in accordance with animal protocols approved by the National Institutes of Health. We used Nkx2–1-cre:RCE and Htr3a-GFP mice to target interneurons of MGE or CGE origin, respectively. As reported previously, there is no difference in CA1 KA-evoked gamma oscillations between these two strains (Chittajallu et al., 2013). For optogenetic inhibition of pyramidal cells, we crossed the Emx1-cre (Gorski et al., 2002) (Jackson Laboratory strain 005628) with Cre-dependent Arch-GFP mouse (Madisen et al., 2012) (The Jackson Laboratory, strain 012735).
Drugs and chemicals.
KA was purchased from Tocris Bioscience and all other chemicals from Sigma-Aldrich.
Slice preparation and electrophysiology.
Horizontal slices (400 μm) containing the hippocampus were prepared from postnatal 14–21 mice of both sexes after decapitation under deep isoflurane-induced anesthesia. Slices were cut in ice-cold (<4°C) high magnesium artificial CSF (aCSF) containing the following (in mm): 130 NaCl, 3 KCl, 1.25 NaH2PO4, 5 MgCl2, 1 CaCl2, 10 glucose, 26 NaHCO3, and were incubated in standard aCSF containing equivalent MgCl2 and CaCl2 (2 mm) for 30 min at 34°C in a submerged chamber and at least a further 30 min at room temperature before recording. Slices were then mounted on a coverslip (coated with 0.1% poly-l-lysine) and transferred to a submerged-style recording chamber where they were superfused with standard aCSF at 3–5 ml/min at 32°C–34°C. For extracellular field potentials, an electrode pulled from standard borosilicate glass (4–8 mΩ), filled with aCSF, was placed in stratum radiatum. One or two whole-cell patch-clamp recordings were made in stratum oriens, pyramidale, or the border of pyramidale and radiatum, in current-clamp mode with electrodes (4–8 mΩ), filled with an intracellular solution containing the following (in mm): 150 potassium gluconate, 3 MgCl2, 0.5 EGTA, 0.3 Na2-GTP, 2 Mg-ATP, 10 HEPES, and 2 mg/ml biocytin. Brief epochs of gamma oscillations were evoked by pressure application (Picospritzer III, Parker Instruments) of 1 mm KA above stratum radiatum as described previously in either CA3 (Gloveli et al., 2005; Dugladze et al., 2012) or CA1 (Chittajallu et al., 2013). Extracellular field recordings were low-pass filtered at 2 kHz and acquired using an Axon Axopatch 2D amplifier (Molecular Devices). Patch-clamp recordings were low-pass filtered at 4 kHz acquired using an Axon Multiclamp 700B amplifier. All recordings were digitized at 10 kHz using an Axon Digidata 1440A on a PC running pClamp 10 (Molecular Devices). All recordings were imported into Igor Pro (Wavemetrics) using NeuroMatic (ThinkRandom) for further analysis. In some cases, a Hum Bug (Quest Scientific) was used to eliminate 60 Hz line noise from the field recordings. After whole-cell recordings, slices containing cells filled with biocytin were fixed in 4% PFA and the tissue was processed and imaged as described previously (Chittajallu et al., 2013). Neuronal reconstructions were made using Neurolucida (Microbrightfield). For the optogenetic experiments, we used whole-field illumination with 580 nm light with a CoolLED pE-4000 (CoolLED).
Data analysis.
To determine the peak frequency of gamma oscillations, we calculated the wavelet transform of the raw, unfiltered field recording and detected the peak frequency of the initial period of KA-evoked gamma oscillations (up to 10 s) in 50 ms bins, rejecting any bins where the magnitude of the wavelet transform was <2 SDs higher than the baseline value. We averaged the peak frequency detected across all bins to determine the peak gamma frequency for each slice and created histograms of these bins to allow quantification of the amount of time each slice spent in slow (32–60 Hz) or fast (62–100 Hz) gamma. Gamma oscillations in the local field potential, and the phase of neuronal spiking during the oscillation, were automatically detected using custom-written procedures in Igor Pro as described previously (Chittajallu et al., 2013). Spike phase histograms were generated by binning action potential times relative to the gamma phase into 20° bins, typically for 3 sweeps of 200–1500 gamma cycles. The histograms presented are averages of all neurons for a particular subtype and so represent the overall group firing. Polar plots were produced in Igor Pro, and the average firing vector was calculated using circular statistics. The firing of individual cells was tested using Rayleigh's test for uniformity to determine whether the firing was phase-locked or not, and group firing was examined using Moore's second-order version of Rayleigh's test, using the vector of the preferred phase and firing probability at that phase for each cell. When comparing the distribution of preferred firing vectors between cell types, we used a nonparametric second-order two-sample circular version of Watson U2 test unless otherwise specified. All circular statistics were performed as described previously (Fisher, 1993; Zar, 2010), using either built-in or custom-written procedures in Igor Pro. Noncircular data were tested for normality using the D'Agostino and Pearson test and subsequently analyzed by parametric or nonparametric tests as appropriate. Unless otherwise stated, all values are mean ± SEM. All statistical analyses were performed using Igor Pro or Prism (GraphPad).
Results
Brief epochs of gamma oscillations were evoked by pressure application of 1 mm KA to stratum radiatum of either CA3 or CA1. This reliably allowed gamma oscillations to be observed using a field electrode in stratum radiatum in CA3 (Fig. 1A) or CA1 (Fig. 1B) for periods of 10–20 s. Power spectra of field recordings taken from CA3 revealed that gamma oscillations had a sharp peak ∼40 Hz, as expected (Gloveli et al., 2005), whereas those from CA1 had a broad peak between 60 and 80 Hz (Fig. 1C). The peak power of gamma oscillations was significantly higher in CA3 than CA1, and isolating CA1 from the rest of the hippocampal circuit had no effect on the peak power (Fig. 1D). Occasionally, the CA1 recordings were biphasic, with both slow and fast components evident. To account for the broad peak(s) in the CA1 power spectrum, we determined the peak gamma frequency from wavelet transforms of the unfiltered field recordings (see Materials and Methods). In intact slices, gamma oscillations were significantly faster in CA1 than in CA3 (63 ± 0.87 Hz vs 52 ± 1.2 Hz; Fig. 1E) and the oscillation persisted in CA1 when both CA3 and the subiculum were disconnected from the circuit, implying a local generator. Interestingly, CA1 gamma was significantly faster in isolated CA1 than in the intact slice, raising the possibility that the low-frequency gamma component observed in CA1 originated from CA3 (Fig. 1E). However, examining percentage of time spent dominated by lower frequency gamma oscillations, we found no significant differences in CA1 between intact or isolated slices (Fig. 1F).
Figure 1.

Example local field potentials and corresponding wavelet transforms of epochs of gamma oscillations evoked by local application of KA, recorded from stratum radiatum of CA3 (A) and CA1 (B). Regions in red box shown on an expanded time scale. C, Power density spectra averaged over 3 sweeps from same slices as in A and B. D, Peak gamma power varied significantly between CA3 (1.2 ± 0.40 μV2/Hz, n = 20), CA1 in intact slices (0.067 ± 0.018 μV2/Hz, n = 146), or CA1 with either CA3 (0.027 ± 0.010 μV2/Hz, n = 6) or CA3 and subiculum disconnected (0.033 ± 0.013 μV2/Hz, n = 13). p < 0.0001 (Kruskal–Wallis Test). E, The peak gamma oscillation frequency varied significantly between CA3 (52 ± 1.2 Hz), CA1 in intact slices (63 ± 0.87 Hz), or CA1 with either CA3 (63 ± 4.8 Hz) or CA3 and subiculum disconnected (71 ± 2.1 Hz). p < 0.0001 (one-way ANOVA). F, Histogram of peak gamma frequencies detected using wavelet transforms, in 50 ms bins, for initial period of KA-evoked gamma for all recordings and conditions in D. Inset, Significant differences between CA3 and CA1 in cumulative time spent in “slow” (32–60 Hz) or “fast” (62–100 Hz) gamma. p < 0.0001 (two-way ANOVA). Post hoc multiple-comparisons: *p < 0.05 versus CA3; **p < 0.01 versus CA3; ***p < 0.001 versus CA3; ****p < 0.0001 versus CA3; +p < 0.05 versus CA1 (intact).
Using Nkx2–1-cre:RCE mice and Htr3a-GFP mice to target MGE- and CGE-derived interneurons, respectively, we examined the roles of different interneuron classes during CA1 KA-evoked gamma. Perisomatic inhibition is thought to be essential for genesis of gamma oscillations with MGE-derived, parvalbumin-containing, fast-spiking basket cells playing a prominent role (Buzsáki and Wang, 2012). Consistent with this model, we found that MGE-derived basket cells in CA3 were very active during KA-evoked gamma (Fig. 2A,D) with their firing significantly phase-locked (Table 1) and showing a phase preference for peak of the oscillation (Fig. 2E). Surprisingly, however, we found that MGE-derived basket cells were significantly less likely to fire during CA1 gamma (MGE basket cell firing probability, CA3 gamma, n = 4; vs CA1 gamma, n = 10: 0.34 ± 0.10 vs 0.12 ± 0.033, p = 0.0240, Mann–Whitney test; Figure 2B,F), and the distribution of preferred firing vectors was significantly different (p = 0.0409). Furthermore, as a population, MGE-derived basket cells did not display significantly phase-locking to the gamma oscillation (Fig. 2G; Table 1). Indeed, MGE-derived basket cells were no more likely to participate in CA1 fast gamma oscillations than CGE-derived, CCK-positive basket cells (gamma firing probability, MGE basket, n = 10; vs CGE basket, n = 12: 0.12 ± 0.033 vs 0.069 ± 0.027, p = 0.280, Student's t test; see Figure 5C) and the distribution of preferred firing vectors did not differ between MGE- and CGE-derived basket cells (p = 0.318). Unexpectedly, only 47% of pyramidal cells (n = 15; see Fig. 5B) were active during CA1 fast gamma (Fig. 2C,H); and even of those that were active, only 1 cell displayed a nonuniform, phase-locked firing pattern (Table 1), with the overall behavior of pyramidal cells being to weakly follow the phase of the oscillation (Fig. 2I).
Figure 2.

Neurolucida reconstruction of MGE basket cells in CA3 (A), CA1 (B), and CA1 pyramidal cell (C), with example whole-cell current-clamp recording and local field potential with corresponding wavelet transform in D, F, and H, respectively. E, G, I, Top, Corresponding polar plots show preferred firing phase and magnitude of individual cells (gray dots) with a vector displaying the averages (red arrow). Bottom, Firing probabilities averaged across all cells for each phase of the gamma oscillation (20° bins). In CA3, MGE basket cells were strongly phase-locked to the peak of the gamma oscillation, but those in CA1 were not.
Table 1.
Firing properties of all anatomically identified neurons during KA-evoked gamma oscillationsa
| Cell type | Firing probability | Depth of modulation | Depth of modulation × firing probability | Preferred phase (°) | Firing at preferred phase | No. of significantly phase-locked cells (Rayleigh p < 0.01) | Group firing significantly nonuniform (Moore's p < 0.05) |
|---|---|---|---|---|---|---|---|
| Pyramidal cells | 0.119 ± 0.042 | 0.188 ± 0.084 | 0.014 ± 0.005 | 111 | 0.011 | 1/15 | No |
| Back-projecting | 0.128 ± 0.012 | 0.113 ± 0.017 | 0.014 ± 0.002 | 214 | 0.024 | 3/3 | Yes |
| Basket cells (CGE) | 0.069 ± 0.027 | 0.226 ± 0.058 | 0.016 ± 0.008 | 188 | 0.010 | 3/12 | No |
| O-LM cells (CGE) | 0.034 ± 0.007 | 0.257 ± 0.030 | 0.008 ± 0.002 | 224 | 0.005 | 17/44 | No |
| Trilaminar cells | 0.315 ± 0.057 | 0.359 ± 0.055 | 0.112 ± 0.023 | 184 | 0.037 | 6/7 | Yes |
| Axo-axonic cells | 0.354 ± 0.134 | 0.159 ± 0.062 | 0.040 ± 0.006 | 143 | 0.126 | 3/3 | Yes |
| Basket cells (MGE) | 0.116 ± 0.033 | 0.258 ± 0.063 | 0.032 ± 0.014 | 241 | 0.014 | 7/10 | No |
| Bistratified cells | 0.240 ± 0.143 | 0.205 ± 0.055 | 0.072 ± 0.057 | 169 | 0.055 | 4/4 | Yes |
| Ivy cells | 0.072 ± 0.039 | 0.229 ± 0.062 | 0.018 ± 0.011 | 201 | 0.013 | 1/5 | No |
| O-LM cells (MGE) | 0.153 ± 0.025 | 0.171 ± 0.026 | 0.027 ± 0.007 | 175 | 0.021 | 5/22 | Yes |
| CA3 MGE basket cell | 0.346 ± 0.101 | 0.362 ± 0.140 | 0.091 ± 0.043 | 174 | 0.062 | 4/4 | Yes |
aAll neurons are from CA1 unless otherwise stated.
Figure 5.

A, MGE-derived interneurons had a significantly higher firing probability than CGE-derived interneurons during CA1 gamma oscillations. Unidentified CGE- and MGE-derived interneurons were included in these counts. B, Cumulative probability plot of firing probabilities for all cell types during CA1 fast gamma. C, Firing probabilities of anatomically confirmed interneuron subtypes and CA1 pyramidal cells during fast gamma. Significant differences existed between cell types (p < 0.0001, Kruskal–Wallis Test). D, Depth of gamma modulation varied significantly between cell types (p < 0.0001, Kruskal–Wallis Test). *p < 0.05. **p < 0.01. ****p < 0.0001. Some O-LM cells reported previously (Chittajallu et al., 2013) were included in these counts.
Given that fast-spiking basket cells and pyramidal cells did not appear to drive CA1 fast gamma oscillations, we studied the activity of both CGE and MGE oriens and pyramidale interneurons during the oscillation. We used the Rayleigh test of uniformity to assess the phase-locking of each neuron, and we saw at least one significantly nonuniformly firing cell (i.e., phase-locked) in each group (Table 1). To determine whether populations of interneurons displayed consistent behavior during KA-evoked gamma oscillations, we also used Moore's second-order version of the Rayleigh test, using the preferred firing of each cell. Of the CGE cohort, two subtypes of interneuron were significantly phase-locked: the first of these, we termed putative trilaminar cells as they resembled those described previously (Sik et al., 1995), with a soma in stratum oriens and a dense axonal arbor spanning strata oriens, pyramidale, and radiatum, with a prominent projection toward subiculum (Fig. 3A). Trilaminar cells were active during CA1 gamma (Fig. 3C), with a mean firing probability of 0.31 ± 0.057 (n = 7). Their firing was strongly phase-locked, with a preferred phase at the peak of the oscillation (Fig. 3D; Table 1). The other group of CGE interneurons with phase-locked firing during CA1 fast gamma oscillations were those we termed back-projecting interneurons (Sik et al., 1995), as they sent axonal processes either toward or that penetrated CA3 (Fig. 3B,E), with their sparse arborization also reminiscent of septal-projecting cells (Jinno et al., 2007). They had a mean firing probability of 0.13 ± 0.012 (n = 3), and their firing probability had a sharp spike at the peak of the oscillation (Fig. 3F; Table 1).
Figure 3.

Neurolucida reconstruction of a CGE-derived trilaminar cell (A) and back-projecting cell (B). Example whole-cell current-clamp recording and local field potential with corresponding wavelet transform in C and E, respectively. D, F, Top, Corresponding polar plots show preferred firing phase and magnitude of individual cells (gray dots) with a vector displaying the averages (red arrow). Bottom, Firing probabilities averaged across all cells for each phase of the gamma oscillation (20° bins). Trilaminar and back-projecting cells both fired around the peak of the oscillation.
From the MGE-derived cohort of interneurons, the group with the most striking firing pattern during CA1 gamma was axo-axonic cells, which we distinguished from basket cells by the presence of prominent cartridges formed by their axon terminals (Fig. 4A,C). Axo-axonic cells had a mean gamma firing probability of 0.35 ± 0.13 (n = 3), and they had a biphasic phase preference, with a sharp drop in firing probability immediately after the peak of the oscillation; these cells would often fire more than once during a single gamma cycle (Fig. 4D), contrasting with fast-spiking basket cells, which had a lower firing probability with no clear phase preference. The other group of MGE-derived interneurons with a significantly phase-locked firing pattern were bistratified cells (Fig. 4B,E), which had a mean firing probability of 0.24 ± 0.14 (n = 4) and a phase-preference at the peak of the field oscillation (Fig. 4F).
Figure 4.

A, Neurolucida reconstruction of an MGE-derived axo-axonic cell. Inset, Axonal cartridges typical of this cell type (Hardwick et al., 2005). B, Bistratified cell. Inset, Firing pattern in response to depolarizing current steps. Example whole-cell current-clamp recording and local field potential with corresponding wavelet transform in C and E, respectively. D, F, Top, Corresponding polar plots show preferred firing phase and magnitude of individual cells (gray dots) with a vector displaying the averages (red arrow). Bottom, Firing probabilities averaged across all cells for each phase of the gamma oscillation (20° bins). Axo-axonic cells had a biphasic firing pattern, whereas bistratified cells fired toward the peak of the field oscillation. Only the first peak was plotted on the polar plot for the axo-axonic cells.
Overall, CGE-derived interneurons were significantly less active than their MGE-derived counterparts during KA-evoked gamma oscillations in CA1, with pyramidal cells displaying an intermediate firing probability (gamma firing probability, CGE interneurons, n = 122; vs MGE interneurons, n = 63, vs pyramidal cells, n = 15: 0.067 ± 0.009 vs 0.16 ± 0.020 vs 0.12 ± 0.042; Kruskal–Wallis test with Dunn's Multiple-Comparisons test; p < 0.0001, Dunn's Multiple-Comparisons Test; Figure 5A). Comparing cumulative firing probabilities, 45% of all CGE interneurons had a firing probability between 0 and 0.05, compared with just 13% of MGE interneurons (Fig. 5B). The firing probabilities of all anatomically confirmed interneurons, grouped by subtype, and CA1 pyramidal cells are shown in Figure 5C and Table 1. We also calculated the depth of gamma modulation for each of the different cell types; in vivo analyses typically calculate this by summing all spike time phases as a unitary vector and normalizing by the number of spikes (e.g., Tukker et al., 2007; Varga et al., 2012). However, this method was less reliable in vitro because some neurons fire fewer spikes than in vivo, so a cell firing a single action potential would appear to be perfectly phase-locked, leading to large variability in the depth of modulation and revealing no significant differences between cell types (p = 0.1632, Kruskal–Wallis Test; Table 1). To account for the lower firing rates seen in vitro, we multiplied the depth of modulation by the gamma firing probability for each cell, revealing that trilaminar cells were the most strongly gamma-modulated cell type from the entire group (Fig. 5D; Table 1).
These initial experiments suggested that the gamma oscillation that we observed in CA1 stratum radiatum does not depend on either fast-spiking basket cells or pyramidal cells, raising the possibility that it is an inhibition-based ING model of gamma oscillation (Whittington et al., 2000). To test this hypothesis, in a final series of experiments, we used mice expressing an Arch-GFP fusion protein under the expression of Emx1 (see Materials and Methods) to allow selective optogenetic inhibition of pyramidal cells. In CA3, where the dominant form of gamma observed in vitro is the PING type, we found that optogenetic silencing of pyramidal cells led to a very strong reduction in the peak gamma power (light off vs light on: 0.279 ± 0.084 μV2/Hz vs 0.039 ± 0.015 μV2/Hz; n = 6, p = 0.049, paired t test; Fig. 6A,C). In contrast to CA3, optogenetic inhibition of pyramidal cells in CA1 did not produce any significant change in the peak power of gamma oscillations (light off vs light on: 0.048 ± 0.012 μV2/Hz vs 0.043 ± 0.015 μV2/Hz, n = 9, p = 0.734, paired t test; Fig. 6B,D–E). Of the residual gamma oscillation remaining in CA3, we observed a significant increase in the peak frequency (light off vs light on: 55.4 ± 1.4 Hz vs 65.4 ± 2.7 Hz; p = 0.0076, paired t test; Fig. 6F). Interestingly, even though optogenetic inhibition of pyramidal cells in CA1 did not lead to a reduction in gamma power, we also saw a small but significant increase in the peak frequency of the oscillation (light off vs light on: 65.2 ± 3.0 Hz vs 70.7 ± 2.7 Hz; p = 0.0282, paired t test; Fig. 6G). The percentage increase in peak frequency was not significantly different between CA3 and CA1 (frequency, percentage of baseline, CA3 vs CA1: 118 ± 4.1% vs 109 ± 3.5; p = 0.1248, Student's t test; Fig. 6H).
Figure 6.
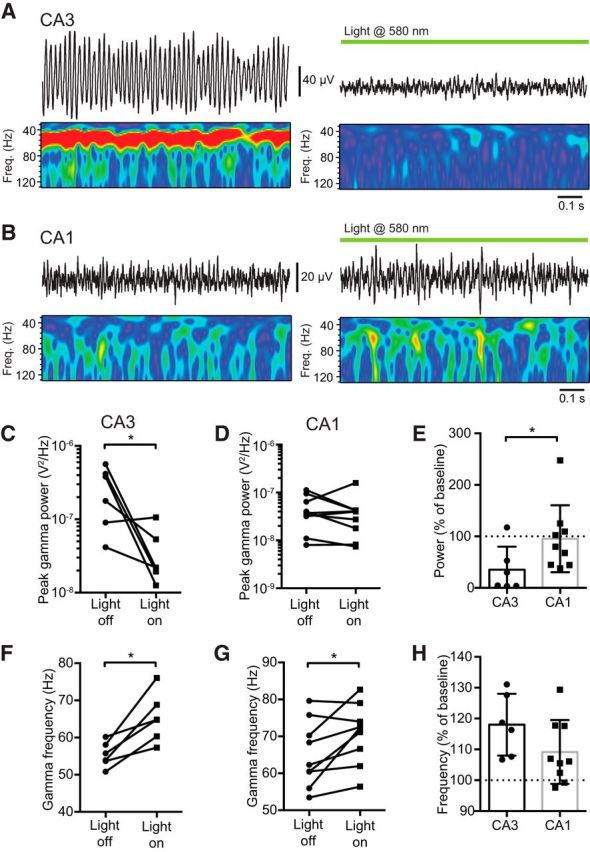
Example traces and corresponding wavelet transforms of KA-evoked gamma oscillations recorded from CA3 (A) and CA1 (B) in mice expressing Arch-GFP in pyramidal cells under baseline conditions (left) and during illumination with 580 nm light (right). Optogenetic silencing of pyramidal cells significantly reduced the peak power of gamma oscillations in CA3 (C) but not CA1 (D). E, Peak power during light activation as a percentage of baseline for both CA3 and CA1. Optogenetic silencing of pyramidal cells increased the peak frequency of gamma oscillations in both CA3 (F) and CA1 (G). H, The increase in frequency was not significantly different between CA3 and CA1. *p < 0.05.
Discussion
Here, we show that pressure application of KA activates a local generator of gamma oscillations in CA1, which oscillates at a higher frequency than CA3 and, most unexpectedly, appears to be generated without the involvement of fast-spiking basket cells or pyramidal cells. We found that, as a general rule, interneurons of MGE origin are more likely to participate in the oscillation, but that the CGE-derived trilaminar and back-projecting cells were interesting exceptions.
CA1 as a generator of gamma oscillations
Although there are many reports of gamma oscillations being observed in CA1, it was thought that slow gamma was driven by CA3 whereas fast gamma was driven by the entorhinal cortex (Colgin et al., 2009). However, in vitro models show that CA1 itself can generate gamma rhythms (e.g., Whittington et al., 1995; Pietersen et al., 2014), and our approach of using focal application of KA to drive the oscillation allows us to study the phenomenon using intact, submerged slices without tonic application of drugs. We found that intrinsic CA1 gamma was ∼11 Hz faster than that generated by CA3, replicating previous findings by others (Middleton et al., 2008; Pietersen et al., 2014). Disconnecting CA3 from CA1 did not affect the frequency of gamma oscillations in our experiments, consistent with focal KA application only activating local circuits and not all of the hippocampus. Interestingly, also disconnecting the subiculum moderately increased the gamma frequency in CA1, perhaps due to removal of an inhibitory feedback mechanism from the subiculum to CA1 (Sun et al., 2014).
When all fast excitatory neurotransmission is blocked, interneurons in CA1 alone are capable of generating a gamma rhythm in vitro when the network is activated by mGluRs (Whittington et al., 1995), and a study using an isolated hippocampus found that fast, but not slow, gamma persisted in the absence of fast glutamatergic transmission (Jackson et al., 2011). We found that >50% of pyramidal cells were inactive in CA1 gamma; although pyramidal cells have low firing rates during gamma oscillations, both in vitro (Fisahn et al., 1998; Hájos et al., 2004; Gloveli et al., 2005) and in vivo (Csicsvari et al., 2003; Senior et al., 2008), they are generally reported to be phase-locked. Of the pyramidal cells active during CA1 gamma oscillations, we only observed one cell with significant phase-locking. Using optogenetic silencing of pyramidal cells in CA1 did not significantly affect the power of KA-evoked gamma oscillations but strongly attenuated them in CA3, leading us to conclude that activity of pyramidal cells is not critical for genesis of the CA1 gamma that we observed, suggesting a predominantly ING type of oscillation (Whittington et al., 2000). Modeling studies show that sparsely connected networks of interneurons are sufficient to generate gamma oscillations (Wang and Buzsáki, 1996), the frequency of which is affected by GABAA receptor synaptic properties, interneuronal connectivity, and driving current onto the interneurons (Traub et al., 1996). However, when stimulated by KA, activity in the isolated axons of principal cells can, in the absence of the soma, provide high-frequency oscillatory inputs that allow interneuron networks to resonate at gamma frequencies (Traub et al., 2003), so this mechanism could allow principal cells to provide excitatory input to interneurons while still being consistent with our observation of little or no somatic firing. Optogenetic perturbation of pyramidal cell function led to significant changes in gamma oscillation frequency in CA1 as well as CA3, so both ING and PING mechanisms may be active: increased NMDA receptor activation on interneurons can increase interneuron synchrony and gamma oscillation frequency (Mann and Mody, 2010).
Perisomatic-targeting interneurons and CA1 gamma
Fast-spiking basket cells play a key role in generating both KA- and carbachol-evoked gamma rhythms when these agonists are bath-applied in vitro (e.g., Fisahn et al., 2004; Mann et al., 2005), but their contribution in vivo is more controversial: a recent study in CA1 found that MGE basket cells drove the gamma oscillation only around stratum pyramidale and not in higher hippocampal layers (Lasztóczi and Klausberger, 2014). Additionally, an in vitro model of gamma oscillations in the entorhinal cortex found that basket cells mediate slow but not faster gamma (Middleton et al., 2008). In this context, our finding that basket cells are not involved in local KA-induced CA1 gamma is less controversial. In vivo, gamma oscillations can be observed at a number of different frequencies, each presumably with independent generators (Buzsáki and Wang, 2012), consistent with the circuit activated in our study being different from the 40 Hz oscillator generally seen using in vitro CA3 hippocampal preparations.
Although MGE basket cells did not contribute to CA1 gamma in our study, the other class of MGE-derived perisomatic-targeting interneurons, axo-axonic cells, were strongly active. We found that axo-axonic cells had a biphasic firing pattern, with their firing probability dropping sharply at both the peak and the trough of the oscillation. An in vitro study of perisomatic-targeting interneurons in CA3 found that axo-axonic cells fired at a faster rate than the oscillation, preventing ectopic action potentials in the axon from invading the soma (Dugladze et al., 2012). This phenomenon could explain the activity of axo-axonic cells in our study, although it is not clear whether these cells are driving or following the oscillation. Given that axo-axonic cells primarily target pyramidal cells, which do not appear to contribute significantly to CA1 gamma, we would suspect the latter. Unfortunately, this hypothesis is difficult to test experimentally because both axo-axonic and fast-spiking basket cells express parvalbumin, and optogenetically driving parvalbumin-positive interneurons is sufficient to generate gamma rhythms (Cardin et al., 2009; Sohal et al., 2009).
Embryonic origin of interneurons
Overall, we found that MGE-derived interneurons had a higher firing probability than CGE-derived interneurons during CA1 fast gamma. CGE-derived interneurons are also reported to be silent in an in vitro model of the slow oscillation (Tahvildari et al., 2012), so low participation in network oscillations may be a general trait of CGE interneurons. In contrast, the two types of CGE interneurons that were strongly active in CA1 fast gamma were trilaminar cells and back-projecting cells, so an alternative interpretation of our data could be that MGE-derived neurons are active in local circuits but that CGE-derived interneurons are important for entraining the network to inputs arriving from elsewhere, and for transmitting information about the local network state to other regions. CGE interneurons express 5HT3A receptors (Lee et al., 2010), the median raphe nucleus targets hippocampal interneurons (Halasy et al., 1992), and serotonin facilitates GABAergic transmission in CA1 (Ropert and Guy, 1991), so the relative inactivity of CGE-derived interneurons observed using in vitro models may simply be an artifact of a reduced preparation with no subcortical inputs. Although bath application of 5HT decreases gamma frequency (Bibbig et al., 2007), this manipulation would activate metabotropic 5HT receptors, which can suppress gamma oscillations (Johnston et al., 2014). Application of 5HT3A receptor-specific agonists can actually increase gamma power (Schulz et al., 2012), and we recently demonstrated that CGE-derived, but not MGE-derived, O-LM cells increased their firing during network oscillations when 5HT3A receptors were pharmacologically activated (Chittajallu et al., 2013).
Both CGE-derived trilaminar and MGE-derived bistratified cells are attractive candidates for driving the CA1 fast gamma oscillation, as they are dendrite-, and presumably also interneuron-targeting, so could pace other interneurons if the oscillation is indeed ING type. In CA3, trilaminar cells are very active during in vitro gamma oscillations (Gloveli et al., 2005), and in CA1 bistratified cells have the strongest depth of gamma modulation in vivo (Tukker et al., 2007). CA1 oriens trilaminar interneurons have been studied relatively little since they were first described (Sik et al., 1995), although in vivo studies reveal that they are mGluR8-positive, project to the subiculum, and are active during theta and sharp-wave/ripple oscillations (Ferraguti et al., 2005; Jinno et al., 2007). Given that they had the strongest depth of modulation by the gamma oscillation in our study and that we are proposing CA1 gamma to be an ING type oscillation, it is tempting to claim that trilaminar cells are driving the oscillation. Their extensive axonal arborization almost entirely excludes stratum lacunosum-moleculare, so these interneurons are well placed to shunt inputs coming from CA3 to create a permissive environment for the entrainment of the CA1 network to the faster gamma rhythm being driven by extrahippocampal inputs.
In conclusion, we have described an in vitro model of fast gamma oscillations in CA1 that bears the hallmarks of an ING model (Whittington et al., 2000; Buzsáki and Wang, 2012). Although both pyramidal cells and fast-spiking basket cells appear not to drive this oscillation, three classes of interneurons (axo-axonic cells, bistratified cells, and trilaminar cells) are attractive candidates for coordinating this system. Future work would be greatly facilitated by creation of Cre driver lines to allow specific optogenetic manipulation of these interneurons and could provide insights into the mechanisms by which inputs from outside CA1 can switch the dominant network rhythm between slow or fast gamma oscillations.
Footnotes
This work was supported a Eunice Kennedy Shriver National Institute of Child Health and Human Development Intramural Award to C.J.M.
The authors declare no competing financial interests.
References
- Bibbig A, Middleton S, Racca C, Gillies MJ, Garner H, Lebeau FE, Davies CH, Whittington MA. Beta rhythms (15–20 Hz) generated by nonreciprocal communication in hippocampus. J Neurophysiol. 2007;97:2812–2823. doi: 10.1152/jn.01105.2006. [DOI] [PubMed] [Google Scholar]
- Buzsáki G, Wang XJ. Mechanisms of gamma oscillations. Annu Rev Neurosci. 2012;35:203–225. doi: 10.1146/annurev-neuro-062111-150444. [DOI] [PMC free article] [PubMed] [Google Scholar]
- Cardin JA, Carlén M, Meletis K, Knoblich U, Zhang F, Deisseroth K, Tsai LH, Moore CI. Driving fast-spiking cells induces gamma rhythm and controls sensory responses. Nature. 2009;459:663–667. doi: 10.1038/nature08002. [DOI] [PMC free article] [PubMed] [Google Scholar]
- Chittajallu R, Craig MT, McFarland A, Yuan X, Gerfen S, Tricoire L, Erkkila B, Barron SC, Lopez CM, Liang BJ, Jeffries BW, Pelkey KA, McBain CJ. Dual origins of functionally distinct O-LM interneurons revealed by differential 5-HT3AR expression. Nat Neurosci. 2013;16:1598–1607. doi: 10.1038/nn.3538. [DOI] [PMC free article] [PubMed] [Google Scholar]
- Colgin LL, Denninger T, Fyhn M, Hafting T, Bonnevie T, Jensen O, Moser MB, Moser EI. Frequency of gamma oscillations routes flow of information in the hippocampus. Nature. 2009;462:353–357. doi: 10.1038/nature08573. [DOI] [PubMed] [Google Scholar]
- Csicsvari J, Jamieson B, Wise KD, Buzsáki G. Mechanisms of gamma oscillations in the hippocampus of the behaving rat. Neuron. 2003;37:311–322. doi: 10.1016/S0896-6273(02)01169-8. [DOI] [PubMed] [Google Scholar]
- Dugladze T, Schmitz D, Whittington MA, Vida I, Gloveli T. Segregation of axonal and somatic activity during fast network oscillations. Science. 2012;336:1458–1461. doi: 10.1126/science.1222017. [DOI] [PubMed] [Google Scholar]
- Ferraguti F, Klausberger T, Cobden P, Baude A, Roberts JD, Szucs P, Kinoshita A, Shigemoto R, Somogyi P, Dalezios Y. Metabotropic glutamate receptor 8-expressing nerve terminals target subsets of GABAergic neurons in the hippocampus. J Neurosci. 2005;25:10520–10536. doi: 10.1523/JNEUROSCI.2547-05.2005. [DOI] [PMC free article] [PubMed] [Google Scholar]
- Fisahn A, Pike FG, Buhl EH, Paulsen O. Cholinergic induction of network oscillations at 40 Hz in the hippocampus in vitro. Nature. 1998;394:186–189. doi: 10.1038/28179. [DOI] [PubMed] [Google Scholar]
- Fisahn A, Contractor A, Traub RD, Buhl EH, Heinemann SF, McBain CJ. Distinct roles for the kainate receptor subunits GluR5 and GluR6 in kainate-induced hippocampal gamma oscillations. J Neurosci. 2004;24:9658–9668. doi: 10.1523/JNEUROSCI.2973-04.2004. [DOI] [PMC free article] [PubMed] [Google Scholar]
- Fisher NI. Statistical analysis of circular data. Cambridge, England: Cambridge UP; 1993. [Google Scholar]
- Freund TF, Buzsáki G. Interneurons of the hippocampus. Hippocampus. 1996;6:347–470. doi: 10.1002/(SICI)1098-1063(1996)6:4<347::AID-HIPO1>3.0.CO;2-I. [DOI] [PubMed] [Google Scholar]
- Gloveli T, Dugladze T, Saha S, Monyer H, Heinemann U, Traub RD, Whittington MA, Buhl EH. Differential involvement of oriens/pyramidale interneurones in hippocampal network oscillations in vitro. J Physiol. 2005;562:131–147. doi: 10.1113/jphysiol.2004.073007. [DOI] [PMC free article] [PubMed] [Google Scholar]
- Gorski JA, Talley T, Qiu M, Puelles L, Rubenstein JL, Jones KR. Cortical excitatory neurons and glia, but not GABAergic neurons, are produced in the Emx1-expressing lineage. J Neurosci. 2002;22:6309–6314. doi: 10.1523/JNEUROSCI.22-15-06309.2002. [DOI] [PMC free article] [PubMed] [Google Scholar]
- Hájos N, Paulsen O. Network mechanisms of gamma oscillations in the CA3 region of the hippocampus. Neural Netw. 2009;22:1113–1119. doi: 10.1016/j.neunet.2009.07.024. [DOI] [PubMed] [Google Scholar]
- Hájos N, Pálhalmi J, Mann EO, Németh B, Paulsen O, Freund TF. Spike timing of distinct types of GABAergic interneuron during hippocampal gamma oscillations in vitro. J Neurosci. 2004;24:9127–9137. doi: 10.1523/JNEUROSCI.2113-04.2004. [DOI] [PMC free article] [PubMed] [Google Scholar]
- Halasy K, Miettinen R, Szabat E, Freund TF. GABAergic interneurons are the major postsynaptic targets of median raphe afferents in the rat dentate gyrus. Eur J Neurosci. 1992;4:144–153. doi: 10.1111/j.1460-9568.1992.tb00861.x. [DOI] [PubMed] [Google Scholar]
- Hardwick C, French SJ, Southam E, Totterdell S. A comparison of possible markers for chandelier cartridges in rat medial prefrontal cortex and hippocampus. Brain Res. 2005;1031:238–244. doi: 10.1016/j.brainres.2004.10.047. [DOI] [PubMed] [Google Scholar]
- Jackson J, Goutagny R, Williams S. Fast and slow gamma rhythms are intrinsically and independently generated in the subiculum. J Neurosci. 2011;31:12104–12117. doi: 10.1523/JNEUROSCI.1370-11.2011. [DOI] [PMC free article] [PubMed] [Google Scholar]
- Jinno S, Klausberger T, Marton LF, Dalezios Y, Roberts JD, Fuentealba P, Bushong EA, Henze D, Buzsáki G, Somogyi P. Neuronal diversity in GABAergic long-range projections from the hippocampus. J Neurosci. 2007;27:8790–8804. doi: 10.1523/JNEUROSCI.1847-07.2007. [DOI] [PMC free article] [PubMed] [Google Scholar]
- Johnston A, McBain CJ, Fisahn A. 5-Hydroxytryptamine1A receptor-activation hyperpolarizes pyramidal cells and suppresses hippocampal gamma oscillations via Kir3 channel activation. J Physiol. 2014;592:4187–4199. doi: 10.1113/jphysiol.2014.279083. [DOI] [PMC free article] [PubMed] [Google Scholar]
- Lasztóczi B, Klausberger T. Layer-specific GABAergic control of distinct gamma oscillations in the CA1 hippocampus. Neuron. 2014;81:1126–1139. doi: 10.1016/j.neuron.2014.01.021. [DOI] [PubMed] [Google Scholar]
- Lee S, Hjerling-Leffler J, Zagha E, Fishell G, Rudy B. The largest group of superficial neocortical GABAergic interneurons expresses ionotropic serotonin receptors. J Neurosci. 2010;30:16796–16808. doi: 10.1523/JNEUROSCI.1869-10.2010. [DOI] [PMC free article] [PubMed] [Google Scholar]
- Lisman J. Working memory: the importance of theta and gamma oscillations. Curr Biol. 2010;20:R490–R492. doi: 10.1016/j.cub.2010.04.011. [DOI] [PubMed] [Google Scholar]
- Madisen L, Mao T, Koch H, Zhuo JM, Berenyi A, Fujisawa S, Hsu YW, Garcia AJ, 3rd, Gu X, Zanella S, Kidney J, Gu H, Mao Y, Hooks BM, Boyden ES, Buzsáki G, Ramirez JM, Jones AR, Svoboda K, Han X, et al. A toolbox of Cre-dependent optogenetic transgenic mice for light-induced activation and silencing. Nat Neurosci. 2012;15:793–802. doi: 10.1038/nn.3078. [DOI] [PMC free article] [PubMed] [Google Scholar]
- Mann EO, Mody I. Control of hippocampal gamma oscillation frequency by tonic inhibition and excitation of interneurons. Nat Neurosci. 2010;13:205–212. doi: 10.1038/nn.2464. [DOI] [PMC free article] [PubMed] [Google Scholar]
- Mann EO, Radcliffe CA, Paulsen O. Hippocampal gamma-frequency oscillations: from interneurones to pyramidal cells, and back. J Physiol. 2005;562:55–63. doi: 10.1113/jphysiol.2004.078758. [DOI] [PMC free article] [PubMed] [Google Scholar]
- Matta JA, Pelkey KA, Craig MT, Chittajallu R, Jeffries BW, McBain CJ. Developmental origin dictates interneuron AMPA and NMDA receptor subunit composition and plasticity. Nat Neurosci. 2013;16:1032–1041. doi: 10.1038/nn.3459. [DOI] [PMC free article] [PubMed] [Google Scholar]
- McBain CJ, Fisahn A. Interneurons unbound. Nat Rev Neurosci. 2001;2:11–23. doi: 10.1038/35049047. [DOI] [PubMed] [Google Scholar]
- Middleton S, Jalics J, Kispersky T, Lebeau FE, Roopun AK, Kopell NJ, Whittington MA, Cunningham MO. NMDA receptor-dependent switching between different gamma rhythm-generating microcircuits in entorhinal cortex. Proc Natl Acad Sci U S A. 2008;105:18572–18577. doi: 10.1073/pnas.0809302105. [DOI] [PMC free article] [PubMed] [Google Scholar]
- Pietersen AN, Ward PD, Hagger-Vaughan N, Wiggins J, Jefferys JG, Vreugdenhil M. Transition between fast and slow gamma modes in rat hippocampus area CA1 in vitro is modulated by slow CA3 gamma oscillations. J Physiol. 2014;592:605–620. doi: 10.1113/jphysiol.2013.263889. [DOI] [PMC free article] [PubMed] [Google Scholar]
- Ropert N, Guy N. Serotonin facilitates GABAergic transmission in the CA1 region of rat hippocampus in vitro. J Physiol. 1991;441:121–136. doi: 10.1113/jphysiol.1991.sp018742. [DOI] [PMC free article] [PubMed] [Google Scholar]
- Schulz SB, Heidmann KE, Mike A, Klaft ZJ, Heinemann U, Gerevich Z. First and second generation antipsychotics influence hippocampal gamma oscillations by interactions with 5-HT3 and D3 receptors. Br J Pharmacol. 2012;167:1480–1491. doi: 10.1111/j.1476-5381.2012.02107.x. [DOI] [PMC free article] [PubMed] [Google Scholar]
- Senior TJ, Huxter JR, Allen K, O'Neill J, Csicsvari J. Gamma oscillatory firing reveals distinct populations of pyramidal cells in the CA1 region of the hippocampus. J Neurosci. 2008;28:2274–2286. doi: 10.1523/JNEUROSCI.4669-07.2008. [DOI] [PMC free article] [PubMed] [Google Scholar]
- Sik A, Penttonen M, Ylinen A, Buzsáki G. Hippocampal CA1 interneurons: an in vivo intracellular labeling study. J Neurosci. 1995;15:6651–6665. doi: 10.1523/JNEUROSCI.15-10-06651.1995. [DOI] [PMC free article] [PubMed] [Google Scholar]
- Sohal VS, Zhang F, Yizhar O, Deisseroth K. Parvalbumin neurons and gamma rhythms enhance cortical circuit performance. Nature. 2009;459:698–702. doi: 10.1038/nature07991. [DOI] [PMC free article] [PubMed] [Google Scholar]
- Somogyi P, Klausberger T. Defined types of cortical interneurone structure space and spike timing in the hippocampus. J Physiol. 2005;562:9–26. doi: 10.1113/jphysiol.2004.078915. [DOI] [PMC free article] [PubMed] [Google Scholar]
- Sun Y, Nguyen AQ, Nguyen JP, Le L, Saur D, Choi J, Callaway EM, Xu X. Cell-type-specific circuit connectivity of hippocampal CA1 revealed through Cre-dependent rabies tracing. Cell Rep. 2014;7:269–280. doi: 10.1016/j.celrep.2014.02.030. [DOI] [PMC free article] [PubMed] [Google Scholar]
- Tahvildari B, Wölfel M, Duque A, McCormick DA. Selective functional interactions between excitatory and inhibitory cortical neurons and differential contribution to persistent activity of the slow oscillation. J Neurosci. 2012;32:12165–12179. doi: 10.1523/JNEUROSCI.1181-12.2012. [DOI] [PMC free article] [PubMed] [Google Scholar]
- Traub RD, Whittington MA, Colling SB, Buzsáki G, Jefferys JG. Analysis of gamma rhythms in the rat hippocampus in vitro and in vivo. J Physiol. 1996;493:471–484. doi: 10.1113/jphysiol.1996.sp021397. [DOI] [PMC free article] [PubMed] [Google Scholar]
- Traub RD, Cunningham MO, Gloveli T, LeBeau FE, Bibbig A, Buhl EH, Whittington MA. GABA-enhanced collective behavior in neuronal axons underlies persistent gamma-frequency oscillations. Proc Natl Acad Sci U S A. 2003;100:11047–11052. doi: 10.1073/pnas.1934854100. [DOI] [PMC free article] [PubMed] [Google Scholar]
- Tricoire L, Pelkey KA, Erkkila BE, Jeffries BW, Yuan X, McBain CJ. A blueprint for the spatiotemporal origins of mouse hippocampal interneuron diversity. J Neurosci. 2011;31:10948–10970. doi: 10.1523/JNEUROSCI.0323-11.2011. [DOI] [PMC free article] [PubMed] [Google Scholar]
- Tukker JJ, Fuentealba P, Hartwich K, Somogyi P, Klausberger T. Cell type-specific tuning of hippocampal interneuron firing during gamma oscillations in vivo. J Neurosci. 2007;27:8184–8189. doi: 10.1523/JNEUROSCI.1685-07.2007. [DOI] [PMC free article] [PubMed] [Google Scholar]
- Varga C, Golshani P, Soltesz I. Frequency-invariant temporal ordering of interneuronal discharges during hippocampal oscillations in awake mice. Proc Natl Acad Sci U S A. 2012;109:E2726–E2734. doi: 10.1073/pnas.1210929109. [DOI] [PMC free article] [PubMed] [Google Scholar]
- Wang XJ, Buzsáki G. Gamma oscillation by synaptic inhibition in a hippocampal interneuronal network model. J Neurosci. 1996;16:6402–6413. doi: 10.1523/JNEUROSCI.16-20-06402.1996. [DOI] [PMC free article] [PubMed] [Google Scholar]
- Whittington MA, Traub RD, Jefferys JG. Synchronized oscillations in interneuron networks driven by metabotropic glutamate receptor activation. Nature. 1995;373:612–615. doi: 10.1038/373612a0. [DOI] [PubMed] [Google Scholar]
- Whittington MA, Traub RD, Kopell N, Ermentrout B, Buhl EH. Inhibition-based rhythms: experimental and mathematical observations on network dynamics. Int J Psychophysiol. 2000;38:315–336. doi: 10.1016/S0167-8760(00)00173-2. [DOI] [PubMed] [Google Scholar]
- Zar JH. Biostatistical analysis. Ed 5. Upper Saddle River, NJ: Pearson; 2010. International Edition. [Google Scholar]