

Abstract
Speaking is one of the most complex motor behaviors developed to facilitate human communication. The underlying neural mechanisms of speech involve sensory-motor interactions that incorporate feedback information for online monitoring and control of produced speech sounds. In the present study, we adopted an auditory feedback pitch perturbation paradigm and combined it with functional magnetic resonance imaging (fMRI) recordings in order to identify brain areas involved in speech production and motor control. Subjects underwent fMRI scanning while they produced a steady vowel sound /a/ (speaking) or listened to the playback of their own vowel production (playback). During each condition, the auditory feedback from vowel production was either normal (no perturbation) or perturbed by an upward (+600 cents) pitch shift stimulus randomly. Analysis of BOLD responses during speaking (with and without shift) vs. rest revealed activation of a complex network including bilateral superior temporal gyrus (STG), Heschl's gyrus, precentral gyrus, supplementary motor area (SMA), Rolandic operculum, postcentral gyrus and right inferior frontal gyrus (IFG). Performance correlation analysis showed that the subjects produced compensatory vocal responses that significantly correlated with BOLD response increases in bilateral STG and left precentral gyrus. However, during playback, the activation network was limited to cortical auditory areas including bilateral STG and Heschl's gyrus. Moreover, the contrast between speaking vs. playback highlighted a distinct functional network that included bilateral precentral gyrus, SMA, IFG, postcentral gyrus and insula. These findings suggest that speech motor control involves feedback error detection in sensory (e.g. auditory) cortices that subsequently activate motor-related areas for the adjustment of speech parameters during speaking.
Keywords: Speech Motor Control, Auditory Feedback, Sensory-Motor Integration, Pitch Perturbation, fMRI
Introduction
During speaking, the brain coordinates the movement of respiratory, laryngeal, articulatory and facial muscles in order to produce speech sounds. This task requires the involvement of feedforward mechanisms that mediate speech production and motor control for effective communication (Guenther et al., 2006). However, questions remain as to how the brain monitors speech production to ensure performance accuracy. Evidence provided by several studies shows that sensory feedback information (e.g. auditory and somatosensory) plays a critical role during speech production (Houde, 1998; Lametti et al., 2012; Larson, 1998). The brain continuously monitors feedback information in order to correct for unwanted production errors and update the state of the sensory-motor networks to accomplish current and future speech production goals. Our knowledge of these critically important networks and the underlying neural mechanisms that incorporate sensory feedback to optimize human speech motor behavior are poorly understood.
A well-accepted theory has proposed that the brain manages to produce and monitor speech by comparing the incoming sensory feedback information with an internal representation of the predicted feedback (Hickok et al., 2011; Rauschecker and Scott, 2009). These internal predictions are hypothesized to be generated by an internal forward model (Wolpert et al., 2011) that transmits efference copies of the speech motor commands to sensory modalities in order to characterize and detect disparities (errors) between intended and actual speech feedback. In case of a mismatch between the predicted and actual sensory feedback information, the output of this comparative process will result in generation of an error signal that is projected back from the sensory to motor systems such that speech motor parameters are adjusted to improve production accuracy.
A widely-used experimental strategy to examine the interactions between sensory-motor mechanisms of speech is to apply a perturbation to the auditory feedback while human subjects speak. This technique allows experimenters to externally induce a mismatch between internally-predicted and actual sensory feedback information to understand how the brain detects feedback errors and uses them for speech production and motor control. From a behavioral standpoint, studies have shown that auditory feedback perturbation elicits compensatory vocal reactions that change speech parameters (e.g. pitch, formant, loudness or timing) in the opposite direction of the applied perturbation (Cai et al., 2011; Chen et al., 2007; Larson, 1998; Villacorta et al., 2007). This evidence demonstrates that the brain continuously monitors speech and operates like a feedback-based controller that uses auditory information for speech motor control.
The neural bases of such sensory-motor mechanisms and behavioral compensation have been studied by quantifying the neurophysiological correlates (e.g. EEG, MEG, ECoG) of speech production and motor control in an auditory feedback perturbation paradigm (Behroozmand and Larson, 2011; Behroozmand et al., 2011, 2009; Chang et al., 2013; Flinker et al., 2010; Greenlee et al., 2013, 2011; Heinks-Maldonado et al., 2006, 2005; Houde et al., 2002; Sitek et al., 2013). Results of these studies showed that the motor act of speaking modulates speech sound processing in auditory cortical areas. This modulatory effect was examined by comparing neural responses to perturbed speech feedback during both speaking and passive listening to the playback of self-produced speech. The major findings indicated that neural activity in auditory cortex was largely suppressed during speaking compared with playback conditions (Behroozmand and Larson, 2011; Chang et al., 2013; Flinker et al., 2010; Greenlee et al., 2011; Heinks-Maldonado et al., 2006, 2005; Houde et al., 2002; Sitek et al., 2013) and suppression was maximum when predicted and actual speech feedback were closely matched (i.e. no or small feedback error) (Behroozmand and Larson, 2011). However, when feedback was briefly perturbed in the middle of speech, neural responses within auditory cortex were increased during speaking (Behroozmand et al., 2009; Chang et al., 2013; Greenlee et al., 2013; Liu et al., 2010). It is hypothesized that such response modulation underlies detection of feedback changes and correction of unintended speech errors during speaking. Studies in non-human primates using a similar experimental task during vocal production yielded similar results that were consistent with the findings in the human brain (Eliades and Wang, 2008).
A recent functional magnetic resonance imaging (fMRI) study adopted the feedback perturbation paradigm to identify brain areas involved in speech motor control using perturbed auditory feedback (Parkinson et al., 2012). In that study, Parkinson et al. (Parkinson et al., 2012) examined the fMRI correlates of speech feedback processing during an active speaking task with and without pitch perturbation in the auditory feedback. Results revealed a complex sensory-motor network involved in speech feedback processing including superior temporal gyrus (STG), precentral gyrus, postcentral gyrus, supplementary motor area (SMA), inferior frontal gyrus (IFG), inferior parietal lobule (IPL) and insula. In the present study, we used a similar approach but with the addition of the playback condition under which subjects listened to the playback of their own perturbed and unperturbed speech feedback. This combined approach creates new experimental contrasts for comparing speaking vs. playback conditions in order to isolate sensory-motor networks of speech and study them independently. Furthermore, since the contrast between perturbed and unperturbed auditory feedback for small perturbations (+/-100 cents) in Parkinson et al.'s study (Parkinson et al., 2012) did not yield significant differences, we increased the magnitude of the pitch perturbations to +600 cents in order to identify brain areas involved in feedback error processing during speech. It has previously been shown that increasing the pitch shift stimulus magnitude elicits larger ERP responses, suggesting that the brain generates a larger error signal in response to increased degree of mismatch between one's own voice pitch and its auditory feedback (Behroozmand et al., 2009). Based on this evidence, we used a +600 cents pitch shift stimulus to elicit greater activation of BOLD responses in order to improve signal to noise ratio compared to Parkinson et al.'s study (Parkinson et al., 2012). We hypothesized that larger pitch shift stimulus magnitudes will enable us to highlight functional neural mechanisms of feedback error processing during vocal pitch monitoring and motor control.
Materials and Methods
Subjects
We have previously used the feedback pitch perturbation paradigm in both speaking and playback conditions in human subjects undergoing the neurosurgical treatment of epilepsy. By recording electrocorticograms (ECoG) in those subjects, we have described auditory cortical responses after perturbed and unperturbed feedback states and reported neural response changes and the correlation of those changes with vocal behavior (i.e. compensation) in response to pitch shifts (Greenlee et al., 2013). Because ECoG provides limited anatomic sampling of only portions of an individual brain, we have begun using fMRI to provide greater anatomic sampling to supplement the insights gained from ECoG Recordings.
Eight right-handed subjects (7 male and 1 female, mean age: 38 years) participated in this fMRI study days prior to surgery for subdural electrode implantation as part of a standard clinical treatment protocol for medically-intractable epilepsy. Formal neuropsychological testing was performed in all subjects before surgery and all had normal speech and language function. Audiometry was normal in all subjects. All subjects required pre-operative sodium amobarbital (i.e. Wada) testing of language dominance, and all were found to have left hemisphere dominance. The results of inpatient video-EEG monitoring demonstrated epileptic foci in the left hemisphere in five subjects, and in the right in three subjects. Patients were observed during fMRI scanning to ensure there were was no seizure events while they performed the experimental tasks in the scanner. All experimental procedures were approved by the University of Iowa Institutional Review Board.
Speech Stimuli and Experimental Design
An event-related design was used to measure blood-oxygen-level dependent (BOLD) activation during speech with and without auditory feedback alteration. The experiment was carried out in one block during which subjects were instructed to either produce and maintain the steady vowel sound /a/ following the onset of a visual cue (speaking condition) or passively listen to the playback of their own self-production (playback condition). Subjects were instructed to hold their head still and minimize their movement during both speaking and playback tasks. Subjects' performance was monitored by the experimenters to ensure the minimal movement and consistency of the vocal production task during the whole recording session and proper feedback was given whenever it was necessary.
A visual cue projected onto a screen behind the scanner and visualized by the subject through a mirror was used to control the tasks and their timing. During speaking trials, the visual cue to speak consisted of a transition from a circle to a square icon. Subjects were instructed to continue their vowel production as long as the square was present on the screen (5 seconds). While the circle was presented, subjects were instructed to remain silent and listen to the playback of their own speech. An intermittent “Rest” condition was randomly included during which the circle was present on the screen and no speech was played back to the subjects. We chose to use simple circle and square cues to reduce the amount of BOLD signal activation resulting from the subjects reading written visual cues.
The speaking and playback conditions were interleaved in such a way that each speaking trial was recorded and immediately played back in the next trial (Figure 1). Rest trials were randomly placed in between consecutive speaking-playback trials. During speaking trials, there was either no mismatch between speech and its auditory feedback (no shift condition) or a brief (200 ms) upward pitch shift stimulus at +600 cents was introduced to perturb speech feedback 750-1250 ms (randomized) after the onset of vowel sound production (shift condition). Pitch shift stimuli were delivered to subjects' voice auditory feedback via an Eventide harmonizer (Eclipse, Eventide, Little Ferry, NJ). The timing, magnitude, direction and order of the pitch shift stimuli was controlled by a custom-made program in Max (Cycling'74, San Francisco, CA). The Max program also controlled and randomized the order of shift and no shift trials during the speaking and playback conditions, and it also generated TTL pulses to mark the onset of each event during the recording session. Therefore, with the inclusion of rest, the experiment consisted of 5 randomly ordered conditions: 1- Speaking with shift, 2- Playback with shift, 3-Speaking with no shift, 4- Playback with no shift and 5- Rest. Subjects' voice signal and its auditory feedback along with the generated TTL pulses were sampled at 24 KHz and recorded on a laboratory computer using a TDT system (System3, Tucker Davis Technologies, Alachua, FL).
Figure 1.

Experimental design for a single trial of volume acquisition using sparse-sampling method during a) speaking and b) playback pitch shift conditions. During speaking, subjects were instructed to maintain a steady production of the vowel sound /a/ following the onset of a visual cue lasting for 5 s. In a randomized order, speech feedback across trials was either unaltered or altered by a pitch shift stimulus beginning 750 ms following the speaking onset. Each speaking trial was immediately followed by playback of the same speech produced in the previous trial. fMRI volumes were acquired 5 s after the onset of visual cues in each trial with parameters TR=10000 ms, TE=30 ms and TA=2650 ms.
fMRI Data Acquisition
All structural and functional MRI data were acquired on a Siemens Trio 3T Scanner. The structural images were acquired using a multi-echo MPRAGE protocol with scan parameters TE={1.74,3.60,5.46,7.32} ms, TR=2530 ms, TI=1260 ms, FA=10 degree, FOV=256 mm and voxel size 1×1×1 mm. Two T1-weighted images were combined to create an average structural image for each subject. Functional images were collected using gradient-echo EPI sequence with sparse sampling technique with the parameters TR = 10000 ms, TE = 30 ms, TA = 2650 ms, flip angle= 90 degree, FOV= 205 mm, 41 transversal slices and voxel size = 3×3×3.5 mm. All experimental data was collected in a single session lasting approximately 35 minutes. A total number of 200 fMRI volumes were collected during each session, yielding approximately 40 volumes for each experimental condition including rest.
Figure 1 shows an example of the experimental design for a single volume acquisition during a speaking and playback trial. For each speaking trial, the visual cue appeared at time 0 and remained on the screen for 5 s, during which subjects maintained the vowel sound production. We used a custom-made Max/Msp program (Cycling 74, v.5.0) to present visual cues, detect speech onsets and deliver the pitch shift stimulus through an Eventide Eclipse Harmonizer. Vocal production was captured with a FOMRI II dual channel MRI microphone (MAGMEDIX Inc., Fitchburg, MA) and was playback using Electrostatic headphones (Koss ESP950). Sound pressure level of auditory feedback was equalized at 70-75 dB between speaking and playback. The Max/Msp program generated signals to externally trigger the scanner for fMRI volume acquisition 5 s after the onset of the visual cue in each condition.
fMRI Data Analysis
Matlab (Mathworks, Natick, MA) was used to extract the sequence of conditions within blocks. The different conditions were manually sorted and matched with the correct scan numbers and time of acquisition. The recorded sound files from subjects' voice were examined on a trial-by-trial basis and trials with missing or inconsistent vocalizations (e.g. largely-unstable voice) were excluded from analysis. SPM8 (UCL, London, UK) was used for pre-processing and voxel-based analysis of the data for task-related effects assessment. Functional images were first corrected for motion across trials and then co-registered to the average structural image. The realigned functional images were spatially normalized to a template in Montreal Neurological Institute (MNI) space and then smoothed using an isotropic Gaussian kernel with full width at half-maximum (FWHM) of 8 mm.
Data from individual subjects were analyzed using a generalized linear model (GLM) approach in which BOLD responses were modeled with a single-bin finite impulse response (FIR) basis function in a window length spanning the time of volume acquisition (2.65 s) for each condition. Even though subjects were instructed to minimize their head movements during the recording session, small movements, specifically those related to head vibrations during speaking, could not be completely eliminated. Therefore, in order to account for the effect of head movement artifacts in data analysis, the motion parameters were included in the GLM as covariates of non-interest in the study design during model estimation. Random-effects group analysis was performed using a full-factorial model with factors including condition (speaking vs. playback) and stimulus (shift vs. no shift). The positive effect of each factor along with their interactions is reported in the following section. In addition, we also present the results of the contrasts between each individual condition and rest. Unless otherwise stated, the group parametric maps are presented with a family-wise error (FWE) corrected p-value of 0.05.
Analysis of vocal responses to pitch-shift stimuli
The pitch frequency of the recorded voice signals was extracted in Praat (Boersma and Weenink, 2001) using an autocorrelation method and then exported to MATLAB for further processing. The extracted pitch frequencies were segmented into epochs ranging from −100 ms before to 600 ms after the onset of TTL pulses that marked pitch-shift stimulus onset. For vocalization trials with no pitch shift, epochs were similarly extracted and segmented with respect to the onset of the generated TTL pulses. Pitch frequencies were then converted from Hertz to Cents scale to calculate vocal compensation in response to the pitch shift stimulus using the following formula:
Here, F is the post-stimulus pitch frequency and FBaseline is the baseline pitch frequency from −100 to 0 ms pre-stimulus. The magnitude of the individual vocal responses were then averaged across all 8 subjects to obtain the magnitude of the grand-averaged vocal responses during shift and no shift conditions, separately.
Results
Behavioral vocal responses to pitch shift stimulus
Figure 2a shows the overlaid time course of the grand-averaged vocal responses to pitch shift and no shift during the speaking condition. As can be seen in this figure, the onset of the +600 cents pitch shift elicited compensatory vocal responses that opposed the direction of stimulus in the auditory feedback. However, no vocal compensation was elicited in the absence of pitch shift stimulus (no shift condition). Vocal responses during shift and no shift conditions were compared within 1 ms time bins in a post-stimulus time window from 0-600 ms using a paired t-test with Bonferroni's correction for multiple comparison. Results showed that vocal responses to pitch shift stimulus were significantly (p<0.05) larger (more negative) than those in response to no shift in a time window from 58-600 ms post-stimulus. Analysis of the absolute value of the mean of post-stimulus (0-600 ms) vocal responses also revealed a significant difference between shift vs. no shift conditions, with larger vocal responses to pitch shift compared with no shift condition. These results are summarized in the bar plots shown in figure 2b.
Figure 2.

a) Overlaid time course of the magnitude of the grand-averaged vocal responses to no shift (red line) and +600 cents pitch shift stimuli (black line). Solid lines and highlighted areas show the mean and standard error of the vocal responses, respectively. b) Bar plot representation of the absolute value of the mean of the grand-averaged vocal response magnitudes during no shift and pitch shift stimulus conditions.
Analysis of BOLD responses
Analysis of the BOLD responses using the random effects group analysis revealed a functional network of auditory and speech motor areas that showed a significantly greater activation during speaking compared to rest, with closely similar activation patterns for shift and no shift (Figure 3, top panels). This network included bilateral STG, Heschl's gyrus, precentral gyrus, SMA, Rolandic operculum, postcentral gyrus and right IFG. In contrast, during the playback condition compared with the rest, the network of significantly greater activation involved only auditory areas including bilateral STG and Heschl's gyri for both shift and no shift (Figure 3, bottom panels). Areas demonstrating significant BOLD activations during each of the individual conditions vs. rest are presented in figure 3 and table 1.
Figure 3.

BOLD responses for contrasts between four different experimental conditions compared with rest. Responses are shown for the group (n = 8) from a random effects analysis (p<0.05, FWE corrected). The color map corresponds to the calculated T-values.
Table 1.
Peak voxel responses for the contrast of interest reported in MNI space. The results are presented for clusters with significant BOLD increase during each individual condition compared with rest with activation thresholds at p<0.05 (FWE corrected for multiple comparisons).
| Region | Speaking | Play back | ||||||||||||||
|---|---|---|---|---|---|---|---|---|---|---|---|---|---|---|---|---|
|
| ||||||||||||||||
| Shift | No Shift | Shift | No Shift | |||||||||||||
|
| ||||||||||||||||
| Voxel (MNI) | Voxel (MNI) | Voxel (MNI) | Voxel (MNI) | |||||||||||||
|
| ||||||||||||||||
| x | y | z | T | X | y | z | T | x | y | z | T | x | Y | z | T | |
|
|
||||||||||||||||
| Left Superior Temporal Gyrus | -44 | -24 | +4 | 8.49 | -42 | -26 | +6 | 6.36 | -40 | -30 | +12 | 6.78 | -42 | -24 | +6 | 5.61 |
| Right Superior Temporal Gyrus | +62 | -24 | +2 | 11.45 | +62 | -24 | +2 | 8.93 | +60 | -24 | +2 | 9.49 | +60 | -24 | +2 | 7.20 |
| Left Heschl's Gyrus | -34 | -26 | +9 | 6.33 | -33 | -26 | +11 | 6.15 | -39 | -24 | +7 | 5.39 | ||||
| Right Heschl's Gyrus | +38 | -24 | +12 | 7.85 | +38 | -22 | +12 | 6.76 | +42 | -22 | +8 | 5.72 | ||||
| Left Precentral Gyrus | -49 | -2 | +40 | 6.09 | -49 | -2 | +41 | 5.66 | ||||||||
| Right Precentral Gyrus | +52 | -4 | +46 | 7.78 | +52 | -4 | +44 | 7.39 | ||||||||
| Left Supplementary Motor Area | -2 | +4 | +58 | 5.68 | ||||||||||||
| Right Supplementary Motor Area | +4 | +8 | +60 | 5.76 | ||||||||||||
| Right Inferior Frontal Gyrus | +46 | +12 | +28 | 5.95 | +60 | +10 | +20 | 6.63 | ||||||||
| Left Rolandic Operculum | -40 | -30 | +14 | 9.08 | -40 | -30 | +14 | 7.98 | ||||||||
| Right Rolandic Operculum | +52 | -4 | +10 | 5.95 | ||||||||||||
| Left Postcentral Gyrus | -46 | -12 | +38 | 8.00 | -46 | -12 | +38 | 8.12 | ||||||||
| Right Postcentral Gyrus | +42 | -12 | +34 | 7.32 | +42 | -14 | +34 | 7.30 | ||||||||
| Left Insula | -38 | +11 | +6 | 6.13 | -38 | +11 | +5 | 5.96 | ||||||||
| Right Insula | +40 | +19 | -2 | 6.55 | +39 | +22 | -3 | 6.22 | ||||||||
A full factorial model was used to investigate the main effects of condition (speaking vs. playback), stimulus (pitch shift vs. no shift) and their interactions on the BOLD responses. Analysis of BOLD activation for speaking vs. playback contrast revealed a positive effect of condition for pitch shift stimulus, with significant BOLD response increases during speaking compared with playback (speaking > playback) in bilateral precentral gyrus, SMA, IFG, postcentral gyrus and insula (Figure 4a and table 2). A similar pattern of BOLD activation was also revealed for speaking > playback contrast in the absence of pitch shift stimulus (no shift) (Figure 4b and table 2). However, no significant effect was found for the reverse contrast (playback > speaking) for shift and no shift.
Figure 4.

BOLD responses for the positive effect of condition (speaking > playback) for shift (a and b) and no shift (c and d). Responses are shown for the group (n = 8) from a random effects analysis (p<0.05, FWE-corrected). The color map corresponds to the calculated T-values.
Table 2.
Peak voxel responses for the positive effect of condition reported in MNI space. The results are presented for clusters with significant BOLD increase during speaking compared with playback conditions (speaking>playback) for shift and no shift, with activation thresholds at p<0.05 (FWE corrected for multiple comparisons).
| Region | Positive Effect of Condition for Shift (Speaking > Playback) |
Positive Effect of Condition for No Shift (Speaking > Playback) |
||||||
|---|---|---|---|---|---|---|---|---|
|
| ||||||||
| Voxel (MNI) | Voxel (MNI) | |||||||
|
| ||||||||
| x | y | z | T | x | y | z | T | |
| Left Precentral Gyrus | -47 | -4 | +41 | 6.16 | -49 | -5 | +41 | 6.12 |
| Right Precentral Gyrus | +50 | -4 | +46 | 6.82 | +52 | -4 | +44 | 6.77 |
| +54 | -8 | +42 | 6.49 | +52 | -10 | +40 | 6.76 | |
| Left Supplementary Motor Area | -6 | +6 | +46 | 6.90 | -6 | +6 | +48 | 6.89 |
| Right Supplementary Motor Area | +8 | -2 | +68 | 5.78 | +8 | -4 | +68 | 5.77 |
| Left Inferior Frontal Gyrus | -55 | +6 | +9 | 6.17 | -53 | +6 | +10 | 5.98 |
| Right Inferior Frontal Gyrus | +57 | +8 | +9 | 6.68 | +57 | +8 | +9 | 6.80 |
| Left Postcentral Gyrus | -44 | -14 | +38 | 7.79 | -44 | -12 | +38 | 7.97 |
| -60 | -2 | +16 | 7.49 | -60 | -2 | +16 | 7.49 | |
| Right Postcentral Gyrus | +42 | -12 | +34 | 6.99 | +44 | -10 | +34 | 7.14 |
| +48 | -6 | +34 | 6.64 | +48 | -8 | +34 | 7.07 | |
| Left Insula | -38 | +10 | +4 | 6.41 | -38 | +10 | +6 | 6.03 |
| Right Insula | +36 | +22 | -2 | 6.87 | +38 | +22 | -2 | 6.60 |
Moreover, analysis of BOLD responses for shift vs. no shift revealed a pattern of greater activation (p<0.001 uncorrected) only for the positive effect of stimulus (shift > no shift) in auditory areas including bilateral STG and Heschl's gyri during speaking and playback conditions (Figure 5). As can be seen in figure 5, the increase in BOLD activation during pitch shift encompassed areas within postero-medial Heschl's gyrus (see transverse slices) and middle and posterior STG regions. Results of our analysis did not reveal a significant condition × stimulus interaction.
Figure 5.

BOLD responses for the positive effect of stimulus (shift > no shift) for a) speaking and b) playback condition. Responses are shown for the patient group subjects (n = 8) from a random effects analysis (p<0.001, uncorrected). The color map corresponds to the calculated T-values.
Since the whole brain voxel-based analysis of BOLD responses for the stimulus main effect did not yield significant results for FWE-corrected tests, a region of interest (ROI) analysis was performed to achieve greater statistical power for comparing BOLD activations during shift vs. no shift condition for a reduced set of voxels within specific clusters. Based on the functionally-activated map of clusters for shift vs. rest and no shift vs. rest contrasts during speaking, eight candidate anatomical areas including bilateral Heschl's gyrus, STG, precentral gyrus, postcentral gyrus, IFG, SMA, Rolandic operculum and insula were selected and submitted to ROI analysis. For each candidate area, data was analyzed by including voxels within a 10 mm sphere centered on the peak of activation within each cluster. The MNI coordinates of the cluster centers for the selected ROIs are listed in table 3.
Table 3.
MNI coordinates of the center voxel of the selected clusters for the region of interest (ROI) analysis of BOLD activations during shift vs. no shift condition. BOLD activations within each cluster were analyzed for a 10 mm sphere centered at the center voxel.
| Region of Interest (ROI) | Cluster Center Voxel (MNI) | ||
|---|---|---|---|
|
| |||
| x | y | z | |
|
|
|||
| Left Superior Temporal Gyrus | -44 | -24 | +6 |
| Right Superior Temporal Gyrus | +62 | -24 | +2 |
| Left Heschl's Gyrus | -36 | -28 | +10 |
| Right Heschl's Gyrus | +38 | -22 | +12 |
| Left Precentral Gyrus | -49 | -2 | +40 |
| Right Precentral Gyrus | +52 | -4 | +44 |
| Left Supplementary Motor Area | -2 | +4 | +58 |
| Right Supplementary Motor Area | +2 | +6 | +60 |
| Left Inferior Frontal Gyrus | -58 | +10 | +22 |
| Right Inferior Frontal Gyrus | +60 | +10 | +20 |
| Left Rolandic Operculum | -40 | -30 | +14 |
| Right Rolandic Operculum | +56 | -6 | +8 |
| Left Postcentral Gyrus | -46 | -12 | +38 |
| Right Postcentral Gyrus | +42 | -12 | +34 |
| Left Insula | -38 | +8 | +4 |
| Right Insula | +40 | +21 | -4 |
Results of the ROI analysis showed significant BOLD response increases (FWE-corrected, p<0.05) for the positive effect of stimulus (shift > no shift) during speaking in bilateral STG and right postero-medial Heschl's gyrus (area TE 1.1). For the positive effect of stimulus (shift > no shift) during playback, results only indicated significant BOLD response increases in bilateral STG. The details of the findings for the ROI analysis are summarized in Table 4.
Table 4.
Results of the ROI analysis for positive effect of stimulus (shift > no shift) for speaking and playback conditions. The results are presented for clusters with significant BOLD increase with activation thresholds at p<0.05 (FWE corrected for multiple comparisons). Peak voxel responses for the positive effect of stimulus are reported in MNI space.
| Positive Effect of Stimulus (Shift > No Shift) for Speaking | ||||||||
|---|---|---|---|---|---|---|---|---|
|
| ||||||||
| Region | Cluster Level | Peak Level | Peak Voxel (MNI) | |||||
|
| ||||||||
| pFWE-corr | puncorr | pFWE-corr | puncorr | T | x | y | z | |
| L Superior Temporal Gyrus | 0.015 | 0.477 | 0.015 | 0.000 | 3.76 | -54 | -18 | 2 |
| R Superior Temporal Gyrus | 0.025 | 0.826 | 0.026 | 0.001 | 3.49 | 54 | -24 | 4 |
| R Heschl's Gyrus (TE 1.1) | 0.025 | 0.826 | 0.028 | 0.001 | 3.45 | 50 | -26 | 6 |
| Positive Effect of Stimulus (Shift > No Shift) for Playback | ||||||||
|---|---|---|---|---|---|---|---|---|
|
| ||||||||
| Region | Cluster Level | Peak Level | Peak Voxel (MNI) | |||||
|
| ||||||||
| pFWE-corr | puncorr | pFWE-corr | puncorr | T | x | y | z | |
| R Superior Temporal Gyrus | 0.010 | 0.336 | 0.004 | 0.000 | 3.78 | 56 | -24 | 4 |
| L Superior Temporal Gyrus | 0.021 | 0.0673 | 0.017 | 0.000 | 3.69 | -54 | -35 | 10 |
Correlation Analysis
The relationship between behavioral vocal responses to pitch shift stimulus and BOLD response increase in different contrasts was examined using the Pearson's correlation analysis. Results of this analysis indicated significant correlation between the absolute value of the post-stimulus (0-600 ms) mean vocal responses and the percentage change (relative to rest baseline) in BOLD activation for bilateral STG and left precentral gyrus in the pitch shift vs. rest contrast during speaking. This finding indicated that larger behavioral vocal responses to pitch shift stimuli were correlated with greater BOLD response increase in these anatomical areas. Figure 6 shows the details of the correlation analysis along with the map of significant BOLD responses for bilateral STG and left precentral gyrus areas.
Figure 6.
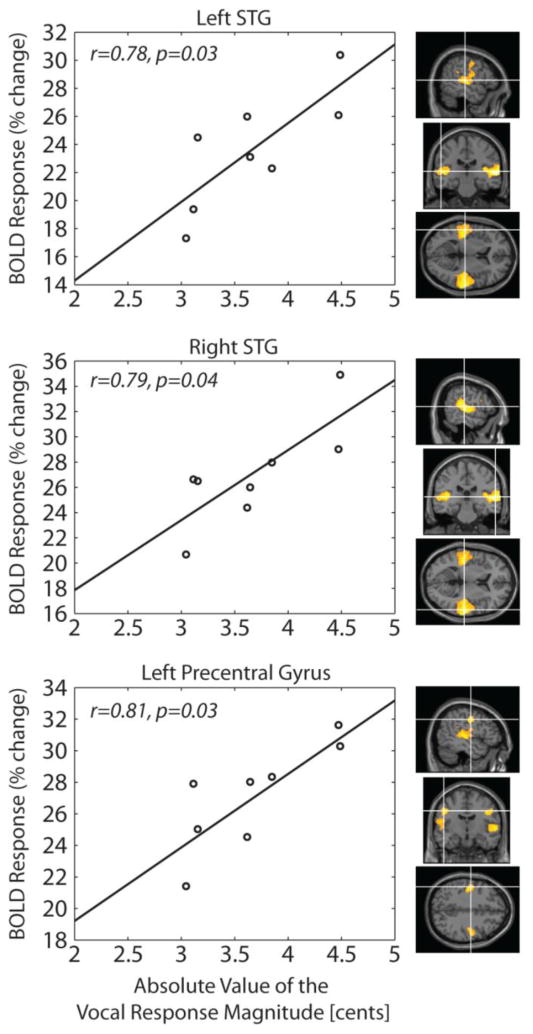
Performance correlation analysis between the absolute magnitude of the behavioral vocal responses and the percentage change in BOLD activation in response to pitch shift stimulus in bilateral STG and left precentral gyrus.
Discussion
In the present study, we used fMRI to identify BOLD correlates of speech sound processing during normal and pitch shifted auditory feedback under speaking and playback conditions. One goal of our study was to address the question whether error processing of vocal pitch auditory feedback during speaking is performed by a neural network that is different from that during playback (passive listening). Differences in brain activation patterns for these two conditions provided insights into the neural mechanisms that monitor auditory feedback for speech motor control during speaking versus those activated during sensory speech sound processing.
When compared to rest, we found that during both speaking and playback conditions, the strongest activation in response to normal (no shift) and pitch shifted vowel sound was observed within temporal lobe auditory cortices. This temporal lobe activation did not differ significantly for the speaking versus playback conditions. However, during speaking, we found significant BOLD activation increases in other sensory-motor areas including bilateral precentral gyrus, postcentral gyrus, anterior insula, SMA and IFG compared with playback. The speaking-induced BOLD response enhancement in these sensory-motor areas was not significantly modulated by the presence or absence of pitch shift stimulus in the auditory feedback.
When BOLD responses were compared in shift vs. no shift contrast, we found significantly greater activations in response to pitch shift stimulus compared with no shift in areas within bilateral STG during both speaking and playback conditions. In addition, the presence of pitch shift stimulus elicited significant BOLD response increases in the right postero-medial Heschl's gyrus only during speaking but not the playback condition.
From the behavioral standpoint, the presence of pitch shift stimulus in the auditory feedback elicited compensatory vocal responses that lowered voice pitch in response to upward pitch perturbations during speaking. We found that these vocal responses had an onset time of 58 ms and their magnitude was significantly correlated with BOLD response increases in areas within bilateral STG and left precentral gyrus. As compared with Parkinson et al.'s study (Parkinson et al., 2012) that used ±100 cents pitch shift stimuli, delivering larger (+600 cents) pitch shifts in the present study elicited vocal responses with smaller magnitudes. This effect is consistent with findings of previous studies showing that the brain assigns smaller vocal controlling gains to larger feedback pitch perturbations and a higher percentage of responses follow the direction of large pitch shifts (Behroozmand et al., 2012; Burnett et al., 1998), possibly because largely-deviated feedback are recognized to be generated externally rather than being self-produced.
The use of a larger pitch shift magnitude in the present study was motivated by previous ERP findings (Behroozmand et al., 2009) showing that larger pitch shifts elicit greater neural responses that can possibly reflect mechanisms that encode the degree of vocal pitch error in the auditory feedback. However, when ERP responses were compared for small vs. large pitch shifts, it was found that the larger pitch shifts were associated with smaller speaking-induced enhancement of neural activity compared with playback (Behroozmand et al., 2009). This effect has been suggested to indicate smaller sensitivity enhancement for feedback error detection and correction during large pitch perturbations (e.g. +500 cents), possibly because large mismatches between voice and its auditory feedback resulted in the interpretation that the incoming feedback information is not self-generated, but rather is generated by an external source. Moreover, it has also been shown that the degree of speaking-induced neural sensitivity enhancement is a time-dependent process and can be modulated by the time delay between voice and pitch perturbation in the auditory feedback (Behroozmand et al., 2011).
It has previously been shown that the motor act of speaking modulates speech sound processing in human sensory cortex. Physiology studies have documented this modulatory effect as speaking-induced auditory suppression, revealed by a decrease in the amplitude of the N100 event-related potentials (ERPs) in response to feedback pitch perturbations during speaking compared with playback (Behroozmand and Larson, 2011; Flinker et al., 2010; Heinks-Maldonado et al., 2005; Houde et al., 2002). A number of other studies have reported that auditory suppression has been reduced when subjects produced rapid and complex speech (Ventura et al., 2009), spoke in a foreign language (Simmonds et al., 2011) or stuttered (Beal et al., 2011), indicating an increased demand for processing auditory feedback information during speech production. The suppression effect has been discussed in the context of a predictive coding model of speech in which incoming auditory feedback information is filtered out (suppressed) by an internal prediction based on efference copies of motor commands during speech production (Chang et al., 2013; Guenther et al., 2006; Hickok et al., 2011; Rauschecker and Scott, 2009; Tourville et al., 2008). The principles of this predictive coding model were supported by studies showing that the degree of suppression is dependent upon the feedback error signal magnitude, meaning that the suppression was shown to be largest for fully predictable feedback (no perturbation or normal feedback) and decreased as the magnitude of feedback perturbation was increased (Behroozmand and Larson, 2011).
A similar study examined auditory feedback processing in non-human primate vocalizations and provided evidence regarding an important functional role of the observed suppression effect in error detection and correction during vocal production (Eliades and Wang, 2008). In that study Eliades and Wang (Eliades and Wang, 2008) found that auditory cortical neurons that were suppressed during vocalization showed a significant increase in their firing rates when the auditory feedback was perturbed by a pitch shift stimulus during vocalization. This finding suggested that the suppression may result from neural processes that change tuning properties of auditory neurons for the purpose of detecting feedback changes during vocalization.
In humans, similar findings were reported by showing that the magnitude of the P200 component of ERPs increased in response to brief pitch perturbations in the middle of an utterance during speaking compared with playback (Behroozmand et al., 2009; Liu et al., 2010). In a more recent study, it has been shown that the P200 response magnitude is correlated with the reaction time of the compensatory vocal responses that stabilize speech against the disruptive effect of unexpected feedback alterations (Behroozmand et al., 2014). Taken together these findings suggest that the motor act of speaking enhances auditory cortical sensitivity for feedback error detection in order to activate the underlying neural mechanisms that influence speech motor control during speaking.
Additional support for the role of auditory cortex in feedback error detection comes from more recent studies using intracranial ECoG recordings. Such recordings further refine our understanding of the spatial distribution of neural networks involved in auditory feedback processing during speaking (Chang et al., 2013; Greenlee et al., 2013). Results of those studies have shown that spatially segregated sub-regions within higher order auditory cortex on posterolateral STG exhibited neural responses to pitch shifts that are modulated during speaking compared with playback. In this area, the majority of sites showed response enhancement, whereas a smaller number of sites showed an opposite pattern and were suppressed during vocal production. Moreover, enhanced neural responses to feedback alterations were also identified within the ventral portion of the precentral gyrus which in conjunction with enhanced lateral STG responses predicted the magnitude of compensatory behavioral responses to feedback pitch perturbations (Chang et al., 2013). However, due to the fact neural responses could not be elicited in the absence of mid-utterance feedback pitch shift, none of these previous studies included a no shift condition, and therefore, a direct comparison between their results and findings of the present fMRI study for shift vs. no shift contrast could not be strongly justified.
A relatively similar enhancement effect during speaking was reported in an fMRI study involving monosyllabic word production under normal and noise-masked auditory feedback compared with listening to playback of self-produced words (Zheng et al., 2010). Zheng et al. (Zheng et al., 2010) showed that a network including left IFG, left post- central gyrus, and right thalamus showed increased activation during speaking compared with playback. In the present study, we report that for vowel sound production, the areas of BOLD activation increase during speaking extends to bilateral precentral gyrus, SMA, IFG, postcentral gyrus and insula. However, consistent with our current findings, the reverse contrast in which activity during production was subtracted from that during listening did not reveal any significant difference in Zheng et al.'s study (Zheng et al., 2010). Moreover, when responses to clear (normal) and noise-masked (perturbed) auditory feedback were compared, Zheng et al. (Zheng et al., 2010) found a significant increase in bilateral STG activation for noise-masked compared with clear feedback, which was similar to our results for the pitch-shifted (altered) vs. normal feedback contrast. These findings suggest that bilateral STG activation increase is related to neural processes that underlie feedback error detection during speech production. However, the absence of a significant interaction between the condition and stimulus factors in the present study corroborates the notion that the increase in BOLD activation in response to pitch perturbation in voice auditory feedback may be independent of whether the subject vocalizes or passively listens to the playback of his own self-vocalizations. Therefore, this notion suggests this observed effect may not simply be explained by feedback error detection mechanisms, but rather may reflect a more general mechanisms of auditory predictions about self-produced speech sounds.
In a different experiment, Zheng et al. (Zheng et al., 2013) investigated the neural correlates of speech feedback error processing in a formant shifting paradigm during monosyllabic word production and listening conditions. Results of their fMRI data processing using multi-voxel pattern analysis (MVPA) highlighted a functional network that was differentially sensitive to speech feedback error during speaking compared with playback, regardless of acoustic features of the auditory stimuli. This specific network involved areas within right angular gyrus, right SMA, and bilateral cerebellum that showed significant BOLD activation increase for error detection only during speaking but not playback.
Another recent fMRI study has shown that a more complex sensory-motor network is involved when humans use auditory feedback for the purpose of speech production and motor control (Parkinson et al., 2012). In that study, Parkinson et al. (Parkinson et al., 2012) adopted the pitch perturbation technique to measure and compare BOLD activation in response to normal and altered auditory feedback during speaking only. The results revealed a functional network including bilateral superior and middle temporal gyrus, precentral gyrus, supplementary motor area, inferior frontal gyrus, postcentral gyrus, inferior parietal lobe, insula and putamen.
In the present study, we identified a relatively similar pattern of BOLD activation in response to feedback pitch perturbation during speaking compared with that found in Parkinson et al.'s study (Parkinson et al., 2012), suggesting that the functional networks of speech auditory feedback processing may not be significantly affected in patients with epilepsy. In addition, similar to the study by Parkinson et al. (Parkinson et al., 2012), we did not identify a difference in shift vs. no shift contrasts unless a less stringent significance threshold was used (p<0.001 uncorrected). At that threshold level, we identified BOLD signal increases only in bilateral STG which was consistent with the findings from the Parkinson et al.'s study (Parkinson et al., 2012). A possible explanation for the absence of significant BOLD changes in shift vs. no shift contrast is that both of these studies could potentially be limited by a small sample size. Parkinson et al. (Parkinson et al., 2012), used a sample of 12 healthy individuals with smaller (±100 cents) pitch shifts, whereas in the present study, we recruited 8 neurosurgical patients with epilepsy and delivered larger (+600 cents) pitch shifts during their vowel production.
In addition, analysis of the shift vs. no shift contrast showed a trace of increased BOLD activation in the right ventrolateral prefrontal cortex during playback (figure 5b). Despite the fact this BOLD increase was not statistically significant, the activation pattern indicates that this area may be involved in processing specific aspects of natural human vocalizations. This notion is corroborated by earlier evidence in primates showing that neurons in ventrolateral prefrontal cortex are selectively responsive to species-specific vocalizations when the animals passively listened to different categories of auditory stimuli. (Romanski and Goldman-Rakic, 2002; Romanski et al., 2005, 1999a, 1999b). Although our observation in the present study may suggest a common neural mechanism of prefrontal cortex for processing natural vocalizations in primates and humans, future studies will be required to reliably confirm this notion.
It is also noteworthy to mention that limitation in the number of participants may not be the only factor accounting for the absence of significant difference between shift vs. no shift condition. When compared to Parkinson et al.'s study (Parkinson et al., 2012), results of our analysis for the speaking (with and without shift) vs. rest yielded a closely similar map of statistically-significant activations. Moreover, our analysis yielded significant results for the same contrasts during playback and also the speaking vs. playback contrasts. However, despite the consistencies for the mentioned contrasts, neither ours nor Parkinson et al.'s study (Parkinson et al., 2012) revealed significant results when the shift and no shift conditions were compared.
The absence of significant difference between shift vs. no shift can be explained by the shortcoming of fMRI in providing sufficient temporal resolution to capture complex dynamics of the vocal pitch error processing during vocalization. By nature, the slowness of the hemodynamic responses precludes us from making direct comparison between BOLD activations and electrophysiological correlates such as ERPs. Many rapidly-changing neural events during feedback processing for vocal pitch error detection and correction can cause transient increase or decrease in firing rate of functionally-related neuronal assemblies, for which BOLD activation may not provide a sensitive measure to fully capture their temporal dynamics when responses are averaged within long duration time windows.
It is likely that due to these reasons, the results of our whole brain voxel-based fMRI analysis did not provide sufficient power to reveal a difference in BOLD activation between shift vs. no shift conditions. Therefore, we utilized an alternative ROI analysis (Golfinopoulos et al., 2010) to look at changes in BOLD responses for shift vs. no shift contrast within specific anatomical areas including bilateral Heschl's gyrus, STG, precentral gyrus, postcentral gyrus, IFG, SMA, Rolandic operculum and insula. By limiting the total number of comparisons, the ROI analysis resulted in greater statistical power and revealed significant increases in BOLD responses to shift compared with no shift in areas within bilateral STG and right postero-medial Heschl's gyrus during speaking. A similar map of significant activation limited to areas within bilateral STG was also identified during the playback condition. These activation maps highlighted the important role of the cortical auditory areas within temporal lobe that are involved in processing auditory feedback for vocal pitch motor control during speech.
Acknowledgments
The authors would like to thank Charles R. Larson and Amy L. Parkinson for their help with experimental design and data analysis. This work was supported by the National Institute of Health, Grant Numbers: K23DC009589 and R01DC04290.
Footnotes
Publisher's Disclaimer: This is a PDF file of an unedited manuscript that has been accepted for publication. As a service to our customers we are providing this early version of the manuscript. The manuscript will undergo copyediting, typesetting, and review of the resulting proof before it is published in its final citable form. Please note that during the production process errors may be discovered which could affect the content, and all legal disclaimers that apply to the journal pertain.
References
- Beal DS, Quraan Ma, Cheyne DO, Taylor MJ, Gracco VL, De Nil LF. Speech-induced suppression of evoked auditory fields in children who stutter. Neuroimage. 2011;54:2994–3003. doi: 10.1016/j.neuroimage.2010.11.026. [DOI] [PMC free article] [PubMed] [Google Scholar]
- Behroozmand R, Ibrahim N, Korzyukov O, Robin Da, Larson CR. Left-hemisphere activation is associated with enhanced vocal pitch error detection in musicians with absolute pitch. Brain Cogn. 2014;84:97–108. doi: 10.1016/j.bandc.2013.11.007. [DOI] [PMC free article] [PubMed] [Google Scholar]
- Behroozmand R, Karvelis L, Liu H, Larson CR. Vocalization-induced enhancement of the auditory cortex responsiveness during voice F0 feedback perturbation. Clin Neurophysiol. 2009;120:1303–12. doi: 10.1016/j.clinph.2009.04.022. [DOI] [PMC free article] [PubMed] [Google Scholar]
- Behroozmand R, Korzyukov O, Sattler L, Larson CR. Opposing and following vocal responses to pitch-shifted auditory feedback: evidence for different mechanisms of voice pitch control. J Acoust Soc Am. 2012;132:2468–77. doi: 10.1121/1.4746984. [DOI] [PMC free article] [PubMed] [Google Scholar]
- Behroozmand R, Larson CR. Error-dependent modulation of speech-induced auditory suppression for pitch-shifted voice feedback. BMC Neurosci. 2011;12:54. doi: 10.1186/1471-2202-12-54. [DOI] [PMC free article] [PubMed] [Google Scholar]
- Behroozmand R, Liu H, Larson CR. Time-dependent neural processing of auditory feedback during voice pitch error detection. J Cogn Neurosci. 2011;23:1205–17. doi: 10.1162/jocn.2010.21447. [DOI] [PMC free article] [PubMed] [Google Scholar]
- Boersma P, Weenink D. Praat, a system for doing phonetics by computer. Glot Int. 2001;5:341–345. [Google Scholar]
- Burnett TA, Freedland MB, Larson CR, Hain TC. Voice F 0 responses to manipulations in pitch feedback a. 1998;103:3153–3161. doi: 10.1121/1.423073. [DOI] [PubMed] [Google Scholar]
- Cai S, Ghosh SS, Guenther FH, Perkell JS. Focal manipulations of formant trajectories reveal a role of auditory feedback in the online control of both within-syllable and between-syllable speech timing. J Neurosci. 2011;31:16483–90. doi: 10.1523/JNEUROSCI.3653-11.2011. [DOI] [PMC free article] [PubMed] [Google Scholar]
- Chang EF, Niziolek Ca, Knight RT, Nagarajan SS, Houde JF. Human cortical sensorimotor network underlying feedback control of vocal pitch. Proc Natl Acad Sci U S A. 2013;110:2653–8. doi: 10.1073/pnas.1216827110. [DOI] [PMC free article] [PubMed] [Google Scholar]
- Chen SH, Liu H, Xu Y, Larson CR. Voice F[sub 0] responses to pitch-shifted voice feedback during English speech. J Acoust Soc Am. 2007;121:1157. doi: 10.1121/1.2404624. [DOI] [PubMed] [Google Scholar]
- Eliades SJ, Wang X. Neural substrates of vocalization feedback monitoring in primate auditory cortex. Nature. 2008;453:1102–6. doi: 10.1038/nature06910. [DOI] [PubMed] [Google Scholar]
- Flinker A, Chang EF, Kirsch HE, Barbaro NM, Crone NE, Knight RT. Single-trial speech suppression of auditory cortex activity in humans. J Neurosci. 2010;30:16643–50. doi: 10.1523/JNEUROSCI.1809-10.2010. [DOI] [PMC free article] [PubMed] [Google Scholar]
- Golfinopoulos E, Tourville Ja, Guenther FH. The integration of large-scale neural network modeling and functional brain imaging in speech motor control. Neuroimage. 2010;52:862–74. doi: 10.1016/j.neuroimage.2009.10.023. [DOI] [PMC free article] [PubMed] [Google Scholar]
- Greenlee JDW, Behroozmand R, Larson CR, Jackson AW, Chen F, Hansen DR, Oya H, Kawasaki H, Howard Ma. Sensory-motor interactions for vocal pitch monitoring in non-primary human auditory cortex. PLoS One. 2013;8:e60783. doi: 10.1371/journal.pone.0060783. [DOI] [PMC free article] [PubMed] [Google Scholar]
- Greenlee JDW, Jackson AW, Chen F, Larson CR, Oya H, Kawasaki H, Chen H, Howard Ma. Human auditory cortical activation during self-vocalization. PLoS One. 2011;6:e14744. doi: 10.1371/journal.pone.0014744. [DOI] [PMC free article] [PubMed] [Google Scholar]
- Guenther FH, Ghosh SS, Tourville Ja. Neural modeling and imaging of the cortical interactions underlying syllable production. Brain Lang. 2006;96:280–301. doi: 10.1016/j.bandl.2005.06.001. [DOI] [PMC free article] [PubMed] [Google Scholar]
- Heinks-Maldonado TH, Mathalon DH, Gray M, Ford JM. Fine-tuning of auditory cortex during speech production. Psychophysiology. 2005;42:180–90. doi: 10.1111/j.1469-8986.2005.00272.x. [DOI] [PubMed] [Google Scholar]
- Heinks-Maldonado TH, Nagarajan SS, Houde JF. Magnetoencephalographic evidence for a precise forward model in speech production. Neuroreport. 2006;17:1375–9. doi: 10.1097/01.wnr.0000233102.43526.e9. [DOI] [PMC free article] [PubMed] [Google Scholar]
- Hickok G, Houde J, Rong F. Sensorimotor integration in speech processing: computational basis and neural organization. Neuron. 2011;69:407–22. doi: 10.1016/j.neuron.2011.01.019. [DOI] [PMC free article] [PubMed] [Google Scholar]
- Houde JF. Sensorimotor Adaptation in Speech Production. Science (80-) 1998;279:1213–1216. doi: 10.1126/science.279.5354.1213. [DOI] [PubMed] [Google Scholar]
- Houde JF, Nagarajan SS, Sekihara K, Merzenich MM. Modulation of the auditory cortex during speech: an MEG study. J Cogn Neurosci. 2002;14:1125–38. doi: 10.1162/089892902760807140. [DOI] [PubMed] [Google Scholar]
- Lametti DR, Nasir SM, Ostry DJ. Sensory preference in speech production revealed by simultaneous alteration of auditory and somatosensory feedback. J Neurosci. 2012;32:9351–8. doi: 10.1523/JNEUROSCI.0404-12.2012. [DOI] [PMC free article] [PubMed] [Google Scholar]
- Larson CR. Cross-modality influences in speech motor control: the use of pitch shifting for the study of F0 control. J Commun Disord. 1998;31:489–502. doi: 10.1016/s0021-9924(98)00021-5. quiz 502–3; 553. [DOI] [PubMed] [Google Scholar]
- Liu H, Behroozmand R, Larson CR. Enhanced neural responses to self-triggered voice pitch feedback perturbations. Neuroreport. 2010;21:527–31. doi: 10.1097/WNR.0b013e3283393a44. [DOI] [PMC free article] [PubMed] [Google Scholar]
- Parkinson AL, Flagmeier SG, Manes JL, Larson CR, Rogers B, Robin Da. Understanding the neural mechanisms involved in sensory control of voice production. Neuroimage. 2012;61:314–22. doi: 10.1016/j.neuroimage.2012.02.068. [DOI] [PMC free article] [PubMed] [Google Scholar]
- Rauschecker JP, Scott SK. Maps and streams in the auditory cortex: nonhuman primates illuminate human speech processing. Nat Neurosci. 2009;12:718–24. doi: 10.1038/nn.2331. [DOI] [PMC free article] [PubMed] [Google Scholar]
- Romanski LM, Averbeck BB, Diltz M. Neural representation of vocalizations in the primate ventrolateral prefrontal cortex. J Neurophysiol. 2005;93:734–47. doi: 10.1152/jn.00675.2004. [DOI] [PubMed] [Google Scholar]
- Romanski LM, Bates JF, Goldman-Rakic PS. Auditory belt and parabelt projections to the prefrontal cortex in the rhesus monkey. J Comp Neurol. 1999a;403:141–57. doi: 10.1002/(sici)1096-9861(19990111)403:2<141::aid-cne1>3.0.co;2-v. [DOI] [PubMed] [Google Scholar]
- Romanski LM, Goldman-Rakic PS. An auditory domain in primate prefrontal cortex. Nat Neurosci. 2002;5:15–6. doi: 10.1038/nn781. [DOI] [PMC free article] [PubMed] [Google Scholar]
- Romanski LM, Tian B, Fritz J, Mishkin M, Goldman-Rakic PS, Rauschecker JP. Dual streams of auditory afferents target multiple domains in the primate prefrontal cortex. Nat Neurosci. 1999b;2:1131–6. doi: 10.1038/16056. [DOI] [PMC free article] [PubMed] [Google Scholar]
- Simmonds AJ, Wise RJS, Dhanjal NS, Leech R. A comparison of sensory-motor activity during speech in first and second languages. J Neurophysiol. 2011;106:470–8. doi: 10.1152/jn.00343.2011. [DOI] [PMC free article] [PubMed] [Google Scholar]
- Sitek KR, Mathalon DH, Roach BJ, Houde JF, Niziolek Ca, Ford JM. Auditory cortex processes variation in our own speech. PLoS One. 2013;8:e82925. doi: 10.1371/journal.pone.0082925. [DOI] [PMC free article] [PubMed] [Google Scholar]
- Tourville Ja, Reilly KJ, Guenther FH. Neural mechanisms underlying auditory feedback control of speech. Neuroimage. 2008;39:1429–43. doi: 10.1016/j.neuroimage.2007.09.054. [DOI] [PMC free article] [PubMed] [Google Scholar]
- Ventura MI, Nagarajan SS, Houde JF. Speech target modulates speaking induced suppression in auditory cortex. BMC Neurosci. 2009;10:58. doi: 10.1186/1471-2202-10-58. [DOI] [PMC free article] [PubMed] [Google Scholar]
- Villacorta VM, Perkell JS, Guenther FH. Sensorimotor adaptation to feedback perturbations of vowel acoustics and its relation to perception. J Acoust Soc Am. 2007;122:2306–19. doi: 10.1121/1.2773966. [DOI] [PubMed] [Google Scholar]
- Wolpert DM, Diedrichsen J, Flanagan JR. Principles of sensorimotor learning. Nat Rev Neurosci. 2011;12:739–51. doi: 10.1038/nrn3112. [DOI] [PubMed] [Google Scholar]
- Zheng ZZ, Munhall KG, Johnsrude IS. Functional overlap between regions involved in speech perception and in monitoring one's own voice during speech production. J Cogn Neurosci. 2010;22:1770–81. doi: 10.1162/jocn.2009.21324. [DOI] [PMC free article] [PubMed] [Google Scholar]
- Zheng ZZ, Vicente-Grabovetsky A, MacDonald EN, Munhall KG, Cusack R, Johnsrude IS. Multivoxel patterns reveal functionally differentiated networks underlying auditory feedback processing of speech. J Neurosci. 2013;33:4339–48. doi: 10.1523/JNEUROSCI.6319-11.2013. [DOI] [PMC free article] [PubMed] [Google Scholar]