Abstract
Objective
Recent developments in optical clearing and microscopy technology have enabled the imaging of intact tissues at the millimeter scale to characterize cells via fluorescence labeling. While these techniques have facilitated the three-dimensional cellular characterization within brain and heart, study of dense connective tissues of the musculoskeletal system have been largely unexplored. Here, we quantify how optical clearing impacted the cell and tissue morphology of collagen-, proteoglycan-, and mineral-rich cartilage and bone from the articulating knee joint.
Methods
Water-based fructose solutions were used for optical clearing of bovine osteochondral tissues, followed by imaging with transmission and confocal microscopy. To confirm preservation of tissue structure during the clearing process, samples were mechanically tested in unconfined compression and visualized by cryoSEM.
Results
Optical clearing enhanced light transmission through cartilage, but not subchondral bone regions. Fluorescent staining and immunolabeling was preserved through sample preparations, enabling imaging to cartilage depths 5 times deeper than previously reported, limited only by the working distance of the microscope objective. Chondrocyte volume remained unchanged in response to, and upon the reversal, of clearing. Equilibrium modulus increased in cleared samples, and was attributed to exchange of interstitial fluid with the more viscous fructose solution, but returned to control levels upon unclearing. In addition, cryoSEM-based analysis of cartilage showed no ultrastructural changes.
Conclusion
We anticipate large-scale microscopy of diverse connective tissues will enable the study of intact, three-dimensional interfaces (e.g. osteochondral) and cellular connectivity as a function of development, disease, and regeneration, which have been previously hindered by specimen opacity.
Keywords: confocal microscopy, articular cartilage and bone, SeeDB, chondrocyte
INTRODUCTION
Articular cartilage and bone exhibit a gradient in structural heterogeneity through the depth of the layered osteochondral tissue that gives rise to unique functional and biological properties [1]. At the articular surface, where cartilage counterfaces contact in the joint to permit normal daily activities like walking and running, type II collagen fibrils run parallel to the surface, and are covered by a molecularly (i.e. nanometer) thin boundary lubricating material, including superficial zone protein (aka SZP/lubricin/PRG4), that contributes to low friction and wear [2]. Beneath this superficial zone, the extracellular matrix (ECM) of the middle zone is characterized by randomly oriented type II collagen fibrils and localization of cartilage oligomeric protein (COMP; [3]). Type X collagen is a characteristic marker of hypertrophic chondrocytes at or near the deep zone [4, 5], while type II collagen fibrils orient perpendicular (and anchor) to the calcified cartilage and subchondral bone. Cell and pericellular matrix morphology, proteoglycan (e.g. aggrecan) expression, and water content all vary by tissue depth from the surface, giving rise to zonal cellular subpopulations within a load-bearing viscoelastic and anisotropic tissue. Importantly, cartilage tissue structure is altered – degraded, worn, and softened – during aging and through the progression of osteoarthritis (OA), a debilitating disease affecting tens of millions of people in the United States alone [6]. Moreover, recapitulation of the normal osteochondral tissue structure remains an elusive target for scientists designing regenerative medicine and tissue engineering strategies [7].
Cartilage and bone microstructure has historically been visualized in situ by optical microscopy. Unfortunately, the penetration depth of light in confocal microscopy is influenced by the tissue structure of the collagen-, proteoglycan-, and mineral-rich tissue, which limits the absorption of excitation energy and increases scattering of excitation and emission fluorescent photons, and therefore also limits the understanding of native osteochondral tissue structure. In cartilage, chondrocytes have been visualized in 3D by confocal microscopy, although only to depths of less than ~100 μm [8, 9]. Two-photon microscopy is capable of penetrating deeper in tissue owning in part to the use of longer wavelength excitation light [10, 11]. In a direct comparison of optical imaging of cartilage, two-photon microscopy provided visualization of calcein-loaded chondrocytes to a depth of ~300 μm (or approximately a two-fold increase over one-photon excitation), depending on the wavelength and setup of the optical system [12]. Nonlinear optical microscopy, including second harmonic generation, provides increased depth of imaging in thick tissues, to ~400 μm, though collagen and extracellular matrix are typically visualized without revealing detail of embedded cells or cellular substructures [13, 14]. Moreover, histomorphometry techniques are widely used to study osteochondral tissues, but they require invasive (~5 μm thick) sectioning that limit a full three-dimensional characterization of cells throughout the complex osteochondral tissue, and in the context of disease and regeneration.
Optical clearing by sugar-based and hydrogel replacement techniques has emerged as a powerful tool to characterize cellular volume, morphology, and connectivity in a range of complex tissues, including brain and heart [15–18]. Moreover, optical clearing by refractive index matching using BABB or glycerol-based solutions in conjunction with second harmonic generation has imaged tendon [19], skin [20], muscle [21], cartilage and bone [22] at the tissue scale. However, the previous studies utilized reagents that precluded the ability to identify and resolve individual cells within the musculoskeletal system due to significant specimen shrinkage (BABB) or disruption of extracellular matrix morphology (glycerol). In this study, we explore the possibility that optical clearing of dense connective tissues will reveal unique microstructures and cell characteristics that are not easily observed or quantified using standard microscopy or histomorphometry techniques. Our primary objective is to determine the effect of morphology-preserving and fructose-based optical clearing agents [15] in situ on collagen-, proteoglycan-, and mineral-rich osteochondral tissues. Secondarily, we characterize the connectivity of chondrocytes throughout cartilage and near the complex osteochondral interface within tissues in situ. Multiple assays, including mechanical testing and scanning electron microscopy, are used to verify the reversibility and morphology-preserving characteristics of optical clearing for osteochondral tissues.
MATERIALS AND METHODS
Tissue Acquisition
Osteochondral tissues (5–7 month-old) were harvested from bovine knee (stifle) joints obtained from a local abattoir (Dutch Valley Foods, Holland, IL) within 48 hours of slaughter. Cylindrical samples (ø = 5.0 mm, 5.0 mm height) were excised from medial femoral condyle regions and trochlear groove that naturally experience relatively high and low in vivo contact pressures (i.e. load-bearing (LB) and non-load-bearing (NLB) regions, respectively; Figure 1A) [23]. Samples were immediately placed in 4% paraformaldehyde (PFA) in phosphate buffered saline (PBS) or PBS alone for subsequent comparative analyses. Samples in PFA or PBS were placed on a rocker for 1–2 days at 4°C, then rinsed 2× 1 hour with PBS at room temperature with gentle rocking
Figure 1. Tissue harvest locations and experimental overview.
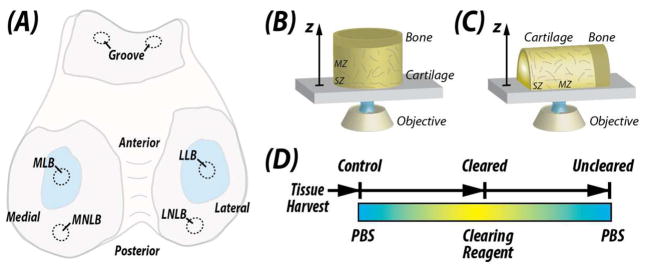
Osteochondral samples were harvested from the femoral condyles of bovine knee (stifle) joints. (A) Samples were selected from the load-bearing and non-load-bearing regions of the medial (MLB and MNLB, respectively) and lateral (LLB and LNLB, respectively) condyles. For mechanical testing, samples were selected from the trochlear groove. Imaging of samples was performed from either the articular surface through the depth of the samples (B; Figures 3 and 4) or transverse to the depth direction (C; Figures 2, 5 and 6) using inverted confocal microscopy (drawing not to scale). (D) Samples were subjected to equilibration in concentrated fructose-based solutions for optical clearing [15] or PBS in a three-stage reversible process.
Optical Clearing
Osteochondral tissues were cleared using a fructose-based optical clearing agent [15] (Figure 1D; sample sizes for each assay defined subsequently). Clearing solutions were prepared using D-(−)-fructose dissolved in ultrapure (milliQ) water of increasing concentrations (i.e., 20%, 40%, 60%, 80%, 100% and 115% wt/vol), with 0.5% α-thioglycerol added to prevent browning. Tissues were placed in ~1 mL of each concentrated fructose solution overnight at room temperature and under a gentle rocking motion. Unclearing of osteochondral tissues was achieved by reversing the clearing process, through daily equilibration in tissues in fructose solutions of decreasing concentrations, to PBS.
Transmission and Confocal Microscopy
Cartilage and chondrocyte morphology were imaged by light microscopy. Light transmission was assessed through the bulk (control, cleared, and uncleared) tissue (n=3) using a stereo dissecting microscope (Leica M80, Wetzlar Germany). Tissues were placed on a printed grid pattern (with grid spacing=2.1 mm), and images were acquired with front and back lighting to visualize both the tissue and grid pattern.
Chondrocytes in cleared tissues were labeled and imaged by confocal microscopy to visualize morphology (n=3) and quantify volumes. To image chondrocytes deep within cleared cartilage, cell membranes (DiI, Life Technologies, Grand Island, NY) and nuclei (Hoechst, Life Technologies) were labeled and visualized on a confocal microscope (Zeiss LSM 710) equipped with a 25× LD LCI Plan-Apochromat multi-immersion lens (NA=0.8, working distance≈500μm, immersion oil n=1.518). Imaging parameters were: excitation wavelengths= 561 (DiI) and 405 (Hoechst 34580) nm; field of view= 340.1×340.1 μm2; matrix= 512 × 512 pixels2; number of slices=479; interslice spacing=1.0 μm. To determine the influence of fructose-based clearing on chondrocyte volume, cell membranes (DiI) were labeled in separate samples and imaged following control, cleared, and uncleared treatments. Confocal imaging parameters were identical to those described previously. Cell volumes (n=10) were computed using image thresholding and region filling routines written in MATLAB (Mathworks, Natick, MA).
Cartilage and chondrocyte morphology was further visualized with selective chemical labels and by immunofluorescence. Tissue discs (n=3) were cut in hemicylinders, allowing for an increased number of labels per sample, with four available excitation laser wavelengths (405, 488, 555, 633 nm) on a confocal microscope system (Nikon A1Rsi, Melville, NY), and a 20× multi-immersion objective (Plan Fluor, NA=0.75, working distance≈300μm). Staining reagents were diluted in 0.2% bovine serum albumin in PBS and obtained from Life Technologies unless otherwise noted. Samples were stained with primary antibodies for 72hrs at 4°C with gentle rocking, rinsed with PBS 3 × 30 min at room temperature, stained with fluorescently-labeled secondary probes for 72hrs at 4°C with gentle rocking, rinsed again with PBS 3 × 30 min at room temperature before gradual equilibration in concentrated fructose. For half of the samples, primary labels were superficial zone protein (aka SZP/lubricin/PRG4; 1:500; mAb S6.79 [24]; 555 nm) and fibrillin-2 (1:200; kindly provided by Prof. R. Mecham, Washington University, St. Louis; 633 nm) and counterstained with Hoechst 34580 (1:500; to label DNA), phalloidin (1:200; to label actin), donkey anti-mouse AF555 (1:500; to label SZP) and donkey anti-rabbit AF647 (1:500; to label fibrillin-2). For the other half of the samples, primary labels were perlecan (1:100; Santa Cruz Biotechnology, Dallas, TX, sc33707), type II collagen (1:200; II-II6B3, Developmental Studies Hybridoma Bank, Iowa City, IA), and type VI collagen (1:200; ab7821, Millipore, Billerica, MA) and counterstained with Hoechst 34580, donkey anti-rat AF488 (1:500; to label perlecan), donkey anti-mouse AF555 (to label type II collagen) and donkey anti-rabbit AF647 (to label type VI collagen). After equilibration in 115% fructose solution, images were acquired at a depth of 200μm from the imaging (cut) surface.
Mechanical Testing
Mechanical testing was performed in unconfined compression on cartilage samples to determine the effect of both paraformaldehyde (PFA) fixing and optical clearing on material properties. Specifically, cartilage samples (n=6, ø = 5.0 mm, 1.6 mm height) were assigned to treatment groups in a two-factor design, with fixation (+/− paraformaldehyde) as one factor, and optical clearing (control, cleared, or uncleared) as a second factor. In addition, to isolate the effects of time-dependent (e.g. proteolytic) or clearing-related changes in cartilage over the time duration required for chemical exchanges (Figure 1D), a separate (control) experiment was performed with samples (n=3) incubated under identical conditions as optically cleared samples, but without undergoing the clearing process. Unfixed samples were supplemented with 0.02% sodium azide and protease inhibitor cocktail (Sigma, St. Louis MO) to prevent proteolytic degradation. Cartilage explants were tested in unconfined compression using a servoelectric materials testing system (TestResources, Shakopee, MN). Samples were compressed in 5% nominal strain increments at a physiological strain of 17.9% s−1 coupled with a 10-minute hold (stress relaxation) [2]. All tests were performed in a 1× PBS bath at 25°C. Relaxation period was set to ensure that stress equilibrium was achieved (no significant force slope). The solid platen was lowered until a prestress of 0.3 N was achieved, ensuring full contact with the sample. Engineering stress was determined using initial sample geometry and a 50-lbf load cell (LPM 512, Cooper Instruments, Warrenton VA) at a sampling rate of 100 Hz. Instantaneous modulus was calculated based on the largest (compressive) stress experienced during each strain step, from which equilibrium modulus was calculated as an average of 100 data points at the end of each relaxation period, as previously described [25]. Data was analyzed using a custom MATLAB algorithm.
Ultrastructure analysis via cryo-SEM
Cartilage was visualized using cryo-scanning electron microscopy (cryo-SEM, Nova NanoSEM, FEI, Hillsboro OR) to qualitatively analyze the tissue ultrastructure and fibril organization throughout the clearing process. To examine the effects of the clearing process on ultrastructure, both control and uncleared samples were analyzed using fixed and unfixed samples (n=3). Briefly, samples were flash frozen in critical point liquid nitrogen slush. Samples were then fractured at the imaging plane and sublimated for 18 minutes. Prior to imaging, samples were platinum sputter coated in the presence of argon for 120 seconds. All samples were imaged under vacuum in the middle zone. Cleared samples were unable to be imaged due to the inability to sublimate fructose for image clarity. Images were quantitatively analyzed for porosity to examine changes in gross morphology. Briefly, images were thresholded and binarized, and cumulative pixels of fibers and pores were utilized to calculate porosity via pore area fraction.
Statistics
All data were analyzed using Minitab v.16 Statistical Software (Minitab Inc., State College PA). Cell volumes were compared using a repeated-measures analysis of variance (ANOVA). Instantaneous and equilibrium modulus were compared using a two-factor ANOVA, with fixation and optical clearing as fixed main effects, with post-hoc tests to compare differences between cleared and uncleared samples. Equilibrium modulus was not found to have a normal distribution, and was transformed to normality via a log transform prior to ANOVA analysis. Mechanical properties of samples that did not undergo the clearing process were compared to uncleared samples via one-way ANOVA, with fixation as the main effect. Porosity was compared using a nested ANOVA, with fixation and optical clearing as fixed main effects, sample as a random effect, and the image locations nested within samples. The residuals of each model were inspected and met the assumptions of ANOVA (i.e. homogeneity of variances and normality) or were transformed as described such that they did meet the assumptions of ANOVA. All data is presented as mean ± standard deviation.
RESULTS
Transmission and Confocal Microscopy Enable Deep Microscopy in Cartilage
Optical clearing reveals light transmission through cartilage, but not blood-rich subchondral bone regions (Figure 2). In 2.5 mm thick samples from both load-bearing and non-load-bearing joint regions, cartilage became translucent following graded immersion in concentrated fructose solutions, revealing printed grid patterns on an underlying substrate. Translucent tissues regained normal (control) opacity following reversible graded immersion in PBS.
Figure 2. Optical clearing is achieved in collagen- and proteoglycan-rich osteochondral tissues.
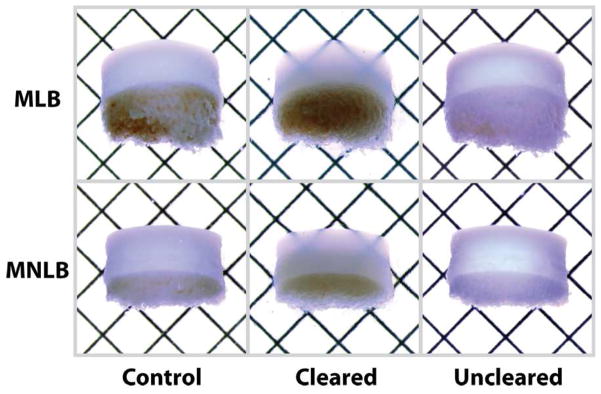
Representative 2.5 mm thick samples from the medial load-bearing (MLB) and medial non-load-bearing (MNLB) regions became translucent under transmission microscopy following graded immersion in concentrated fructose solution, which was reversible following graded immersion in PBS. Grid spacing = 2.1 mm.
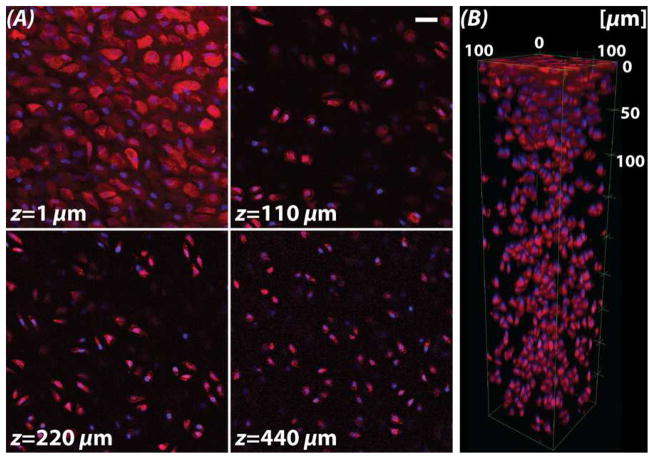
Fluorescent labeling was preserved through sample preparations, enabling standard confocal imaging to depths approaching 500 μm (Figure 3). The outlines of individual chondrocytes (DiI, red) and their nuclei (Hoechst, blue) could be imaged through the superficial zone (z=1 μm) to deep within the cartilage middle zone (z=440 μm), which was limited by the working distance of the microscope objective employed. Moreover, there was no significant change in average cell volume (n=10) in control (399.6±218.9 mm3), cleared (390.6±218.4 mm3), and uncleared samples (402.4±216.8 mm3) (p>0.050) (Figure 4). Normalized cell volume on average was slightly lower in cleared samples, though not significant, and qualitatively demonstrated improved definition of membrane morphology (Figure 4A).
Figure 3. Visualization of fluorescent markers observed through the cartilage depth are limited by the working distance of the microscope objective.
(A) Fluorescent labeling of cell membranes (DiI, red) and nuclei (Hoechst, blue) enabled the visualization by standard confocal microscopy of chondrocytes deep into the middle zone (MZ), limited by the working distance of the objective. Superficial zone chondrocyte morphologies were visualized as flat and spread (at 1 μm), whereas MZ cells maintained a more typical rounded phenotype. (B) Three-dimensional rendering of chondrocytes show variations in cell patterning from the articular surface (top) to deep tissue regions. Scale bar = 20 μm.
Figure 4. Cell volume does not change through the reversible clearing process.

(A) Cell morphology of a representative cell stained with DiI remained qualitatively unchanged following clearing and unclearing. (B) The volume of individual chondrocytes was computed across the three conditions. There was no significant change in average cell volume (n=10) in control (399.6±218.9 mm3), cleared (390.6±218.4 mm3), and uncleared samples (402.4±216.8 mm3) (p>0.050). Cleared samples typically provided better definition of membrane structure, with less scatter, as indicated by the improved definition of membrane morphology and the slight reduction in normalized volume.
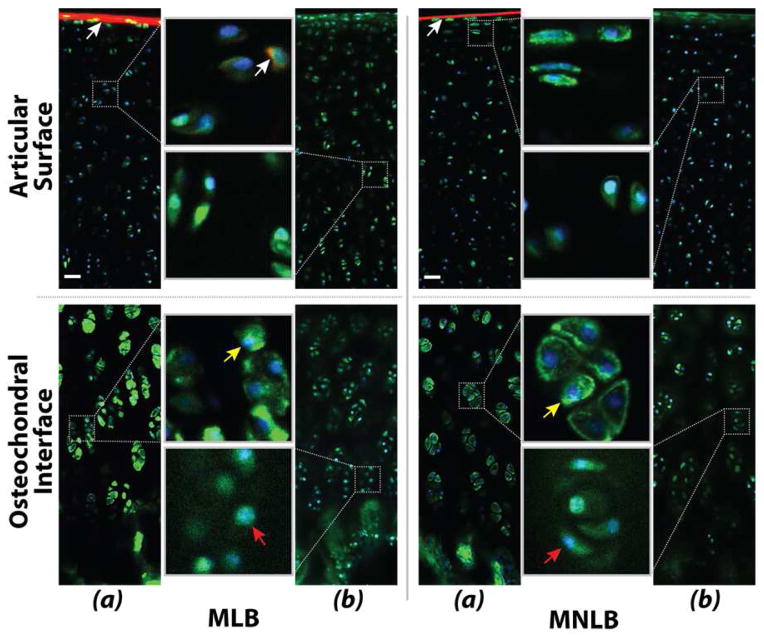
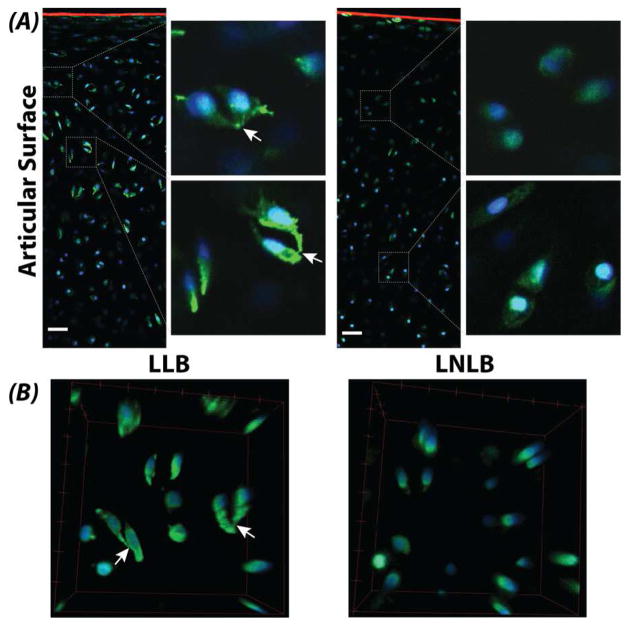
Multiple fluorescent labels in cartilage were imaged by confocal microscopy. Nuclei (Hoechst, blue) and actin filaments (phalloidin, green) were observed through the full thickness of cartilage, and showed characteristic morphology of zone-specific chondrocytes. Immunolabeling of perlecan was observed through the full thickness of the tissue, and superficial zone protein and fibrillin-2 were observed at the articular surface, but immunolabeling for types II and VI collagen could not be observed at 200 μm (Figure 5). Additionally, comparison of actin networks within chondrocytes suggested more cellular connectivity and protrusions in samples from load-bearing regions of lateral condyles compared to non-load-bearing regions (Figure 6).
Figure 5. Fluorescent labeling was observed in cartilage from the medial condyle by confocal microscopy at a depth of 200 μm.
(a) The characteristic morphology of chondrocytes at the superficial articular surface and deep zones near the osteochondral interface was revealed by staining for nuclei (Hoechst, blue) and actin filaments (phalloidin, green). Immunolabeling of superficial zone protein (aka SZP/lubricin/PRG4; white arrows) and fibrillin-2 was observed at the articular surface, although it is not clear whether penetration of the antibodies through the dense matrix was achieved. (b) Immunolabeling of perlecan (green), showing increased volume of the pericellular matrix compared to the actin-labeled cell volume alone (yellow and red arrows). Immunolabeling for types II and VI collagen could not be observed at the imaging depth of 200 μm. Scale bars = 20 μm.
Figure 6. Cellular connectivity was observed in the load-bearing regions of articular cartilage following optical clearing.
(A) Chondrocytes in the load-bearing regions of lateral condyles showed connectivity and protrusions (white arrows) compared to non-load-bearing regions. Cartilage was stained for SZP/lubricin/PRG4 (red), actin (green), and DNA (blue). Scale bars = 20 μm. (B) Three-dimensional renderings of chondrocytes confirm cell connectivity. Bounding box dimensions = 40×40×20 μm3 (l×w×h).
Mechanical Properties are Recovered Following Unclearing
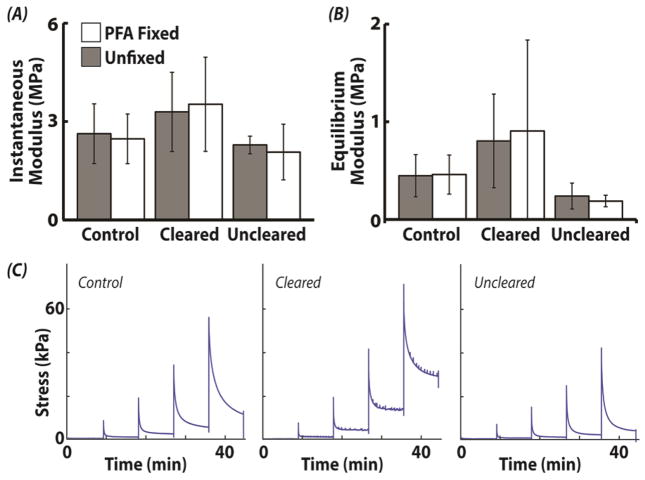
Cartilage instantaneous modulus depended on optical clearing (p=0.013), but not fixation (p=0.855) or their interaction (p=0.831) (Figure 7). Instantaneous moduli for unfixed/fixed samples were 2.6±0.9/2.5±0.8 MPa (control), 3.3±1.2/3.5±1.4 MPa (cleared), and 2.3±0.3/2.1±0.8 MPa (uncleared). Similarly, equilibrium modulus was also dependent on clearing (p<0.001), but not fixation (p=0.849) or their interaction (p=0.908). Equilibrium moduli for unfixed/fixed samples were 0.4±0.2/0.5±0.2 MPa (control), 0.8±0.5/0.9±0.9 MPa (cleared), and 0.2±0.1/0.2±0.1 MPa (uncleared). Post-hoc analysis for instantaneous modulus revealed significant differences between cleared/control samples and uncleared samples (p<0.050). All other comparisons for instantaneous modulus were not significantly different. Post-hoc analysis of equilibrium moduli showed that cleared samples (fixed and unfixed) were significantly higher than uncleared-fixed samples. When the time-dependent or clearing-related changes in cartilage over the time duration required for chemical exchanges was assessed, instantaneous and equilibrium moduli unfixed/fixed samples were found to be 2.6±0.3/2.3±0.8 MPa (control) and 0.2±0.0/0.2±0.1 MPa (uncleared), respectively, with no statistical difference for any main effects or interactions (all p>0.300).
Figure 7. Bulk mechanics of cartilage was not changed after reversal of optical clearing.
Cartilage instantaneous and equilibrium moduli depended on optical clearing (p<0.013), but not fixation (p>0.855) or their interaction (p>0.831). Post-hoc analysis for instantaneous and equilibrium modulus revealed significant differences between cleared samples and uncleared samples (p<0.050).
SEM Reveals No Alteration in Microstructure Due to Clearing Process
Microstructure is qualitatively maintained throughout the clearing process (Figure 8). In control and uncleared samples, ultrastructure is not discernibly different at 20,000× magnification for all samples (Figure 8B). At higher magnification (40,000×), there is a noticeable reduction in pore size for samples fixed with PFA. However, there is no apparent difference between control and uncleared pairs for fixed and unfixed (Figure 8B). Statistical analysis revealed no difference in porosity (pore area fraction) due to fixation (p=0.921), optical clearing (p=0.776), or the interaction (p=0.947). Additionally, multiple images acquired within samples were found to contribute insignificant variation to the results (p=0.524).
Figure 8. Optical clearing does not alter articular cartilage structural morphology.
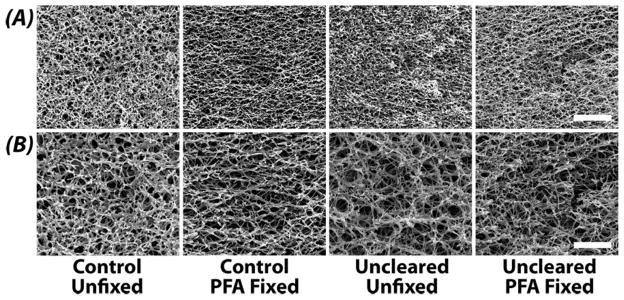
Representative SEM images of articular cartilage ultrastructure in control (pre-cleared) and uncleared samples. Images at 20,000× (A) and 40,000× (B) reveal no qualitative or discernible differences in fibril and pore structural morphology. Scale bar (A) 4 μm and (B) 2 μm.
DISCUSSION
The purpose of this study was to investigate the effect of fructose-based optical clearing agents on collagen-, proteoglycan-, and mineral-rich osteochondral tissues, and to characterize patterns of cellular networks within tissues in situ. We found that optical clearing permits light transmission through 2.5 mm-thick cartilage tissue, but not bone regions. Fluorescent imaging was performed using standard (one-photon) confocal imaging with penetration depths limited only by the working distance of the microscope objective. Tissue morphology remained unchanged and material properties returned to control levels in uncleared tissues, indicating that the structural integrity was conserved during the clearing process
Optical clearing reveals light transmission through cartilage, but not blood-rich subchondral bone regions. Sample preparations did not alter fluorescent labeling, which enabled imaging to cartilage depths limited by the working distance of our microscope objectives. Hoechst, DiI and phalloidin were capable of penetrating deep into the cartilage matrix prior to fixation (Figures 3–6), which may be related to their small molecular weight. In contrast, some (perlecan), but not all (types II and VI collagen) primary antibodies were able to penetrate the dense matrix and bind to deep tissue structures. Therefore, care should be taken to evaluate antibodies and labeling systems for intended visualization of molecular targets. A distinct disadvantage of current clearing techniques is that they do not permit visualization of viable cells, which will impact the design of experiments for time-course studies of cellular dynamics.
Cellular connectivity was observed in some load-bearing cartilage tissues. Cartilage is often viewed as a matrix-rich tissue containing only a sparse distribution of chondrocytes that are often separated by both a local pericellular and bulk interstitial matrix. Our data supports previous reports of chondrocyte connectivity revealed by visualization of cytoskeletal connections between cells [26]. However, localization of chondrocyte connections to load-bearing tissue regions (Figure 6) suggests the interesting possibility that cellular connectivity (e.g., cadherins, connexins) may be involved in the transduction of mechanical force, which would compliment existing proposed mechanisms based on TGF-β signaling for SZP/lubricin/PRG4 in the superficial zone of load-bearing cartilage [23]. Additionally, 3D cellular morphology changes in the progression of osteoarthritis, which suggests that connectivity may be enhanced during, or involved as a response to, cartilage disease [9, 27–30]. We expect that the role of cellular connectivity and associated mechanisms may be further elucidated through application of optical clearing in normal and diseased tissues from a variety of human, bovine, murine, and related species.
Throughout the clearing process, instantaneous and equilibrium moduli remained within typical cartilage mechanics for all samples [25, 31]. Both instantaneous and equilibrium moduli increased when cleared. While there was a significant decrease in the moduli for uncleared samples, comparison to control samples (that were incubated without undergoing the clearing process) revealed similar trends, suggesting that the effect was due to time-dependent changes (e.g. proteolytic breakdown) of the matrix, and not the clearing process. At this stage, the mechanistic basis of increased mechanical properties during cartilage clearing is unclear. Compressive properties of articular cartilage are largely dependent on porous resistance to interstitial fluid flow [32, 33]. We believe the increased viscosity of the fructose solution in the interstitium greatly contributes to the increase of mechanical properties seen in the results. However, other interesting mechanical observations have been observed in optical clearing using sugars and sugar alcohols. Specifically, hydrogen bond dissociation, and related loss of high order fibril structure has been shown to occur with optical clearing utilizing these agents [34, 35]. It has been postulated that the loss of non-covalent bonds due to this dissociation causes the immediate engagement of stiffer, covalent bonds such as those found in collagen crosslinks, resulting in higher tissue stiffness [35]. Within the scope of this work, the independent or interactive effects of these mechanisms are not able to be uncoupled, but are of significant importance to be studied further. However, our results, showing no significant change in cell morphology, may suggest minimal microstructural changes as a result of optical clearing and may further suggest the bulk of the mechanical differences are a result of interstitial fluid property changes. Considering all of these possibilities, these results still show that the clearing process can be performed, and combined with a multitude of labeling techniques as shown herein, while maintaining little fluctuation in the mechanics of the environment.
Clearing process does not impact tissue structural morphology or ultrastructure as assessed by cryo-SEM. This, along with other data presented herein, indicate that the clearing process produces no apparent alteration to the overall structure of the tissue. These results are consistent with previous literature discussing the reversibility of sugar and sugar alcohol based clearing while recovering original morphology [34, 35]. Previous research has asserted that the replacement of interstitial fluid with sugar or sugar alcohols disrupts hydrogen bonding in high order collagen structures, lending to the optical clearing effect [35]. Unfortunately, we were unable to assess cartilage morphology in the cleared state to support or refute these results. All samples were assessed via cryo-SEM, which requires an aqueous interstitium such that critical point drying can be used to reveal tissue morphology. Due to the inability of fructose to sublimate under similar conditions, cryo-SEM was not suitable for analysis. When considered alongside the lack of mechanical difference in control and uncleared cartilage as well as associated fluorescence data, it is apparent that minimal structural and morphological alterations occur to the tissue as a result of the clearing process. These results suggest that enhanced light transmission is primarily a result of solvent exchange.
Microscopy of diverse collagen- and proteoglycan-rich tissues will enable the study of intact, 3D interfaces in situ in cartilage and related (e.g., ligamentous) connective tissues. Moreover, we anticipate widespread use of optical clearing for the investigation of cellular connectivity and tissue structure as a function of development, disease, and regeneration, which have been previously hindered by specimen opacity.
Acknowledgments
The authors are grateful for technical assistance provided by Aaron Taylor, Ph.D., in the Multi-Scale Imaging Center at Purdue University, and for use of the SZP and fibrillin-2 antibodies, provided by Thomas Schmid, Ph.D, and Robert Mecham, Ph.D, respectively. This research was supported in part by NIH grants R01 AR063712, R21 AR064178, R21 AR066230 (CPN), R03 AR065201 (SC), NSF CAREER 1349735 (CPN), and an NSF Graduate Research Fellowship (TN).
Footnotes
AUTHOR CONTRIBUTIONS
CPN, TN, and SC designed the studies. All authors performed experiments, analyzed data, and prepared the manuscript.
CONFLICT OF INTEREST
There are no conflicts of interest.
Publisher's Disclaimer: This is a PDF file of an unedited manuscript that has been accepted for publication. As a service to our customers we are providing this early version of the manuscript. The manuscript will undergo copyediting, typesetting, and review of the resulting proof before it is published in its final citable form. Please note that during the production process errors may be discovered which could affect the content, and all legal disclaimers that apply to the journal pertain.
References
- 1.Mow VC, Ratcliffe A, Poole AR. Cartilage and diarthrodial joints as paradigms for hierarchical materials and structures. Biomaterials. 1992;13:67–97. doi: 10.1016/0142-9612(92)90001-5. [DOI] [PubMed] [Google Scholar]
- 2.Neu CP, Komvopoulos K, Reddi AH. The interface of functional biotribology and regenerative medicine in synovial joints. Tissue Eng Part B Rev. 2008;14:235–247. doi: 10.1089/ten.teb.2008.0047. [DOI] [PMC free article] [PubMed] [Google Scholar]
- 3.Hedbom E, Antonsson P, Hjerpe A, Aeschlimann D, Paulsson M, Rosa-Pimentel E, et al. Cartilage matrix proteins. An acidic oligomeric protein (COMP) detected only in cartilage. The Journal of biological chemistry. 1992;267:6132–6136. [PubMed] [Google Scholar]
- 4.Schmid TM, Linsenmayer TF. Immunoelectron microscopy of type X collagen: supramolecular forms within embryonic chick cartilage. Developmental biology. 1990;138:53–62. doi: 10.1016/0012-1606(90)90176-j. [DOI] [PubMed] [Google Scholar]
- 5.Gannon JM, Walker G, Fischer M, Carpenter R, Thompson RC, Jr, Oegema TR., Jr Localization of type X collagen in canine growth plate and adult canine articular cartilage. Journal of orthopaedic research: official publication of the Orthopaedic Research Society. 1991;9:485–494. doi: 10.1002/jor.1100090404. [DOI] [PubMed] [Google Scholar]
- 6.Lawrence RC, Helmick CG, Arnett FC, Deyo RA, Felson DT, Giannini EH, et al. Estimates of the prevalence of arthritis and selected musculoskeletal disorders in the United States. Arthritis and rheumatism. 1998;41:778–799. doi: 10.1002/1529-0131(199805)41:5<778::AID-ART4>3.0.CO;2-V. [DOI] [PubMed] [Google Scholar]
- 7.Hunziker EB. The elusive path to cartilage regeneration. Advanced materials. 2009;21:3419–3424. doi: 10.1002/adma.200801957. [DOI] [PMC free article] [PubMed] [Google Scholar]
- 8.Hambach L, Neureiter D, Zeiler G, Kirchner T, Aigner T. Severe disturbance of the distribution and expression of type VI collagen chains in osteoarthritic articular cartilage. Arthritis and rheumatism. 1998;41:986–996. doi: 10.1002/1529-0131(199806)41:6<986::AID-ART5>3.0.CO;2-N. [DOI] [PubMed] [Google Scholar]
- 9.Bush PG, Hall AC. The volume and morphology of chondrocytes within non-degenerate and degenerate human articular cartilage. Osteoarthritis and cartilage/OARS, Osteoarthritis Research Society. 2003;11:242–251. doi: 10.1016/s1063-4584(02)00369-2. [DOI] [PubMed] [Google Scholar]
- 10.Niesner R, Andresen V, Neumann J, Spiecker H, Gunzer M. The power of single and multibeam two-photon microscopy for high-resolution and high-speed deep tissue and intravital imaging. Biophysical journal. 2007;93:2519–2529. doi: 10.1529/biophysj.106.102459. [DOI] [PMC free article] [PubMed] [Google Scholar]
- 11.Wong BJ, Wallace V, Coleno M, Benton HP, Tromberg BJ. Two-photon excitation laser scanning microscopy of human, porcine, and rabbit nasal septal cartilage. Tissue engineering. 2001;7:599–606. doi: 10.1089/107632701753213219. [DOI] [PubMed] [Google Scholar]
- 12.Bush PG, Wokosin DL, Hall AC. Two-versus one photon excitation laser scanning microscopy: critical importance of excitation wavelength. Frontiers in bioscience: a journal and virtual library. 2007;12:2646–2657. doi: 10.2741/2261. [DOI] [PMC free article] [PubMed] [Google Scholar]
- 13.Werkmeister E, de Isla N, Marchal L, Stoltz JF, Dumas D. Interest of second harmonic generation imaging for diagnosis in thick and opaque tissue. Biorheology. 2008;45:375–383. [PubMed] [Google Scholar]
- 14.Yeh AT, Hammer-Wilson MJ, Van Sickle DC, Benton HP, Zoumi A, Tromberg BJ, et al. Nonlinear optical microscopy of articular cartilage. Osteoarthritis and cartilage/OARS, Osteoarthritis Research Society. 2005;13:345–352. doi: 10.1016/j.joca.2004.12.007. [DOI] [PubMed] [Google Scholar]
- 15.Ke MT, Fujimoto S, Imai T. SeeDB: a simple and morphology-preserving optical clearing agent for neuronal circuit reconstruction. Nature neuroscience. 2013;16:1154–1161. doi: 10.1038/nn.3447. [DOI] [PubMed] [Google Scholar]
- 16.Chung K, Wallace J, Kim SY, Kalyanasundaram S, Andalman AS, Davidson TJ, et al. Structural and molecular interrogation of intact biological systems. Nature. 2013;497:332–337. doi: 10.1038/nature12107. [DOI] [PMC free article] [PubMed] [Google Scholar]
- 17.Erturk A, Becker K, Jahrling N, Mauch CP, Hojer CD, Egen JG, et al. Three-dimensional imaging of solvent-cleared organs using 3DISCO. Nature protocols. 2012;7:1983–1995. doi: 10.1038/nprot.2012.119. [DOI] [PubMed] [Google Scholar]
- 18.Goergen CJ, Radhakrishnan H, Sakadzic S, Mandeville ET, Lo EH, Sosnovik DE, et al. Optical coherence tractography using intrinsic contrast. Optics letters. 2012;37:3882–3884. doi: 10.1364/ol.37.003882. [DOI] [PMC free article] [PubMed] [Google Scholar]
- 19.Hovhannisyan V, Hu PS, Chen SJ, Kim CS, Dong CY. Elucidation of the mechanisms of optical clearing in collagen tissue with multiphoton imaging. Journal of biomedical optics. 2013;18:046004. doi: 10.1117/1.JBO.18.4.046004. [DOI] [PubMed] [Google Scholar]
- 20.Wen X, Mao Z, Han Z, Tuchin VV, Zhu D. In vivo skin optical clearing by glycerol solutions: mechanism. Journal of biophotonics. 2010;3:44–52. doi: 10.1002/jbio.200910080. [DOI] [PubMed] [Google Scholar]
- 21.Plotnikov S, Juneja V, Isaacson AB, Mohler WA, Campagnola PJ. Optical clearing for improved contrast in second harmonic generation imaging of skeletal muscle. Biophysical journal. 2006;90:328–339. doi: 10.1529/biophysj.105.066944. [DOI] [PMC free article] [PubMed] [Google Scholar]
- 22.Vesuna S, Torres R, Levene MJ. Multiphoton fluorescence, second harmonic generation, and fluorescence lifetime imaging of whole cleared mouse organs. Journal of biomedical optics. 2011;16:106009. doi: 10.1117/1.3641992. [DOI] [PubMed] [Google Scholar]
- 23.Neu CP, Khalafi A, Komvopoulos K, Schmid TM, Reddi AH. Mechanotransduction of bovine articular cartilage superficial zone protein by transforming growth factor beta signaling. Arthritis Rheum. 2007;56:3706–3714. doi: 10.1002/art.23024. [DOI] [PubMed] [Google Scholar]
- 24.Schumacher BL, Block JA, Schmid TM, Aydelotte MB, Kuettner KE. A novel proteoglycan synthesized and secreted by chondrocytes of the superficial zone of articular cartilage. Archives of biochemistry and biophysics. 1994;311:144–152. doi: 10.1006/abbi.1994.1219. [DOI] [PubMed] [Google Scholar]
- 25.Korhonen RK, Laasanen MS, Toyras J, Rieppo J, Hirvonen J, Helminen HJ, et al. Comparison of the equilibrium response of articular cartilage in unconfined compression, confined compression and indentation. Journal of biomechanics. 2002;35:903–909. doi: 10.1016/s0021-9290(02)00052-0. [DOI] [PubMed] [Google Scholar]
- 26.Sasazaki Y, Seedhom BB, Shore R. Morphology of the bovine chondrocyte and of its cytoskeleton in isolation and in situ: are chondrocytes ubiquitously paired through the entire layer of articular cartilage? Rheumatology (Oxford) 2008;47:1641–1646. doi: 10.1093/rheumatology/ken341. [DOI] [PubMed] [Google Scholar]
- 27.Holloway I, Kayser M, Lee DA, Bader DL, Bentley G, Knight MM. Increased presence of cells with multiple elongated processes in osteoarthritic femoral head cartilage. Osteoarthritis Cartilage. 2004;12:17–24. doi: 10.1016/j.joca.2003.09.001. [DOI] [PubMed] [Google Scholar]
- 28.Langelier E, Suetterlin R, Hoemann CD, Aebi U, Buschmann MD. The chondrocyte cytoskeleton in mature articular cartilage: structure and distribution of actin, tubulin, and vimentin filaments. J Histochem Cytochem. 2000;48:1307–1320. doi: 10.1177/002215540004801002. [DOI] [PubMed] [Google Scholar]
- 29.Murray DH, Bush PG, Brenkel IJ, Hall AC. Abnormal human chondrocyte morphology is related to increased levels of cell-associated IL-1beta and disruption to pericellular collagen type VI. J Orthop Res. 2010;28:1507–1514. doi: 10.1002/jor.21155. [DOI] [PMC free article] [PubMed] [Google Scholar]
- 30.Youn I, Choi JB, Cao L, Setton LA, Guilak F. Zonal variations in the three-dimensional morphology of the chondron measured in situ using confocal microscopy. Osteoarthritis Cartilage. 2006;14:889–897. doi: 10.1016/j.joca.2006.02.017. [DOI] [PubMed] [Google Scholar]
- 31.Mauck RL, Wang CC, Oswald ES, Ateshian GA, Hung CT. The role of cell seeding density and nutrient supply for articular cartilage tissue engineering with deformational loading. Osteoarthritis Cartilage. 2003;11:879–890. doi: 10.1016/j.joca.2003.08.006. [DOI] [PubMed] [Google Scholar]
- 32.Levick JR. Flow through interstitium and other fibrous matrices. Q J Exp Physiol. 1987;72:409–437. doi: 10.1113/expphysiol.1987.sp003085. [DOI] [PubMed] [Google Scholar]
- 33.Soltz MA, Ateshian GA. Interstitial fluid pressurization during confined compression cyclical loading of articular cartilage. Ann Biomed Eng. 2000;28:150–159. doi: 10.1114/1.239. [DOI] [PubMed] [Google Scholar]
- 34.Hirshburg J, Choi B, Nelson JS, Yeh AT. Correlation between collagen solubility and skin optical clearing using sugars. Lasers Surg Med. 2007;39:140–144. doi: 10.1002/lsm.20417. [DOI] [PubMed] [Google Scholar]
- 35.Yeh AT, Hirshburg J. Molecular interactions of exogenous chemical agents with collagen--implications for tissue optical clearing. J Biomed Opt. 2006;11:014003. doi: 10.1117/1.2166381. [DOI] [PubMed] [Google Scholar]


