

Abstract
Introduction
Diffusion tensor imaging (DTI) studies in patients with schizophrenia have shown abnormalities in the microstructure of white matter tracts. Specifically, reduced fractional anisotropy (FA) has been described across multiple white matter tracts, in studies that have mainly included patients treated with antipsychotic medications.
Objective
To compare FA in antipsychotic-naïve patients experiencing a first episode of psychosis (FEP) to FA in healthy controls to demonstrate that the variance of FA can be grouped, in a coincidental manner, in four predetermined factors in accordance with a theoretical partition of the white matter tracts, using a principal components analysis (PCA).
Methods
Thirty-five antipsychotic-naïve FEP patients and 35 age- and gender-matched healthy controls underwent DTI at 3T. Analysis was performed using a tract-based spatial statistics (TBSS) method and exploratory PCA.
Results
DTI analysis showed extensive FA reduction in white matter tracts in FEP patients compared with the control group. The PCA grouped the white matter tracts into four factors explaining 66% of the total variance. Comparison of the FA values within each factor highlighted the differences between FEP patients and controls.
Discussion
Our study confirms extensive white matter tracts anomalies in patients with schizophrenia, more specifically, in drug-naïve FEP patients. The results also indicate that a small number of white matter tracts share common FA anomalies that relate to deficit symptoms in FEP patients. Our study adds to a growing body of literature emphasizing the need for treatments targeting white matter function and structure in FEP patients.
Keywords: Diffusion tensor imaging, First-episode psychosis, Schizophrenia, Fractional anisotropy, TBSS, Principal components analysis
1. Introduction
Schizophrenia is a neurodevelopmental disorder in which alterations in brain connectivity have been observed (Friston and Frith, 1995; McGuire and Frith, 1996; Olabi et al., 2011), leading to ineffective communication between brain regions (Seal et al., 2008; Shi et al., 2012). These disturbances in connectivity may be caused by the interaction of biological (Church et al., 2002; Insel, 2010; Weinberger, 1987) and environmental factors during early life (Cannon et al., 2002; Tandon et al., 2008; van Haren et al., 2012), causing developmental brain alterations that predispose an individual to suffer schizophrenia (Singh et al., 2012; Weinberger, 1987).
The changes in microstructure of specific white matter tracts seems to be the anatomical substrate for the disturbances of brain connectivity in schizophrenia (Konrad and Winterer, 2008). This conclusion has been supported by postmortem and genetic studies showing myelin-related alterations (Flynn et al., 2003; Shergill et al., 2000; Yurgelun-Todd et al., 1996), as well as functional imaging studies that demonstrated connectivity abnormalities, specifically between temporo-limbic and prefrontal regions (Meda et al., 2012; Yu et al., 2011).
Diffusion tensor imaging (DTI) is a magnetic resonance imaging (MRI) technique that yields information about white matter microstructure. DTI measures the direction and degree of water diffusion that can be altered by pathologic factors such as demyelination and axonal membrane deterioration (Kubicki et al., 2005a). Fractional anisotropy (FA) is a commonly reported index reflecting white matter microstructure (Basser and Pierpaoli, 1996; Beaulieu, 2002). Several DTI studies have revealed abnormalities in the microstructure of white matter as evidenced by reduced FA in patients with schizophrenia (Ellison-Wright and Bullmore, 2009; Kanaan et al., 2005; Kubicki et al., 2005b; White et al., 2013). In a recent systematic review (Peters and Karlsgodt, 2014) conflicting results were found: some studies have shown no differences between first-episode psychosis (FEP) patients and healthy individuals (Collinson et al., 2014; Kong et al., 2011; Peters et al., 2010), while others have described white matter abnormalities (Cheung et al., 2008; Fitzsimmons et al., 2014; Guo et al., 2012; Lee et al., 2012; Luck et al., 2011; Mandl et al., 2013; Wang et al., 2013a). Some of the factors that might contribute to these results are variability in medication status, symptom history, image analysis, among others (Peters and Karlsgodt, 2014). In order to avoid some confounding variables, studies in antipsychotic-naïve FEP patients are of particular interest. Studies in patients never treated with antipsychotics have shown abnormalities in inferior longitudinal fasciculus (Cheung et al., 2008; Liu et al., 2013), superior longitudinal fasciculus (Filippi et al., 2014; Guo et al., 2012; Mandl et al., 2013), cingulum (Wang et al., 2013b), fornix (Filippi et al., 2014; Guo et al., 2012), internal capsule (Guo et al., 2012), uncinate fasciculus (Mandl et al., 2013), genu and splenium (Cheung et al., 2008; Gasparotti et al., 2009), and occipital-frontal fasciculus (Cheung et al., 2008; Liu et al., 2013).
As presented, some concordance exists in some of the white matter tracts in studies of FEP patients; however, definitive regions have not been confirmed (Wang et al., 2013a). These results could be mediated by heterogeneity of the disease, different methods of image analysis, or statistical analysis. In our study, we examine white matter microstructure in antipsychotic-naïve FEP patients, using DTI with a tract-based spatial statistics (TBSS) method (Smith et al., 2006) and principal components analysis (PCA). We chose this method because region of interest analysis is likely to have more Type II errors (false negatives) than TBSS analysis (Pasternak et al., 2012), and because TBSS also takes into account non-normal distributions of FA in certain brain regions (Smith et al., 2007).
2. Materials and Methods
2.1 Participants
The study was approved by the Ethics and Scientific Committees of the National Institute of Neurology and Neurosurgery of Mexico (INNN). All participants were included in the study after completion of an informed consent procedure in which written consent was obtained.
Thirty-five patients were recruited from the Emergency Room, Neuropsychiatry Department or the Adolescent Program of Neuropsychiatric and Imaging Study (PIENSA) of the INNN during their first non-affective episode of psychosis. For inclusion in the study, subjects were assessed using the Structured Clinical Interview for DSM-IV (First et al., 1997). Psychopathology was assessed using the Positive and Negative Syndrome Scale (PANSS) (Kay et al., 1987). The patients were antipsychotic-naïve and capable of providing informed consent. Exclusion criteria included concomitant medical or neurological illness, history of head trauma, current substance abuse or history of substance dependence (excluding nicotine), comorbidity with other Axis I disorders, high risk for suicide and psychomotor agitation. The use of other concomitant medications (eg, benzodiazepines, mood stabilizers, and antidepressants) was not allowed before the imaging study. Thirty-five healthy controls matched for age, gender and handedness were also recruited. The control participants were assessed in the same manner as the patients and were excluded if they had a history of psychiatric illness or family history of schizophrenia. All participants were screened for drugs of abuse (cannabis, cocaine, heroin, opioids and benzodiazepines) at the time of inclusion and one hour prior to the neuroimaging studies.
2.2 Image acquisition
MRI studies were acquired on a GE HDxt 3T scanner (GE Healthcare, Waukesha, WI, USA) with an 8-channel head coil (Invivo, Orlando, FL, USA). For each subject, a DTI acquisition, covering the whole brain, was obtained using a diffusion-weighted single-shot echo planar image sequence (DW-EPI) in axial orientation (FOV=256 mm, 60 slices, 128 × 128 matrix; ASSET factor=2, TR=12000 ms, TE=70 ms, b-value=700 s/mm2; slice thickness=2.6 mm, slice gap=0 mm, 35 non-collinear diffusion directions) and 1 non-DW image.
2.2 Image Analysis
2.2.1 Data preprocessing
Data were preprocessed using the Functional MRI of the Brain Software Library (FSL) (www.fmrib.ox.ac.uk/fsl) (Smith et al., 2004). First, each data set was corrected for eddy currents and head movement using an affine registration to the first volume in the series. Then, non-brain matter was removed from the images using the brain extraction tool. The diffusion tensor for each voxel was estimated by the multivariate linear fitting algorithm. Finally, the FA values were calculated from the eigenvalues of the diffusion tensor matrix.
2.2.2 TBSS analysis
Analysis of FA images was performed by using TBSS, version 1.2. FA maps were normalized to the Montreal Neurological Institute (MNI) standard space. Each map was projected onto a standard mean FA skeleton to create a skeletonized FA map by thinning the area around the skeleton; this method determined the highest local FA value and assigned this value to the corresponding voxel of the skeleton structure. An FA threshold of 0.2 was chosen for this analysis. Our analysis included 48 white matter fiber tracts, comparable to the approach used in a recent study (Lee et al., 2013) in medicated FEP patients (the description of the 48 included tracts is available in supplementary material).
3. Statistical analysis
The results are presented in terms of means and standard deviations (±SD). Demographic and clinical characteristics were compared between the control and FEP groups. Group differences in demographic and clinical variables were explored using χ2, Fisher's exact test or independent samples t-tests, as appropriate. The statistical comparisons were carried out with a significance level set at p<0.05. Exploratory partial correlations between tracts with lower FA values changes and clinical measures (PANSS positive, negative and general subscores) were computed using Spearman rho. These analyses were restricted to tracts that initially showed a significant group difference between FEP patients and healthy controls.
To evaluate the differences between groups, skeletonized FA data were fed into a voxel-wise statistics analysis (Astrakas and Argyropoulou, 2010; Chung et al., 2008) by using the FSL randomized program software. This analysis uses permutation-based non-parametric inferences within the framework of the general linear model (Nichols and Holmes, 2002). Ten-thousand permutations were used, including full correction for multiple comparisons over space. Two-sample T-tests comparing controls and patients were performed for each FA values voxel across the entire brain, with a voxel-wise intensity threshold of p<0.05 (corrected). A second analysis was performed using a cluster-label maps technique based on the Johns Hopkins University (JHU) white matter tractography atlas (Hua et al., 2008) and the International Consortium of Brain Mapping (ICBM) DTI-81 (Mori et al., 2009) white matter labels atlas. This technique evaluates the FA values of 48 default white matter fiber tracts. For this analysis, we also used FSL, and a T-test was performed to compare patients and controls. Finally, because the number of variables was large, we decided to use the parcellation proposed by Mori et al (2008), as frame of reference to observe how the variance of the FA is grouped in healthy controls and FEP; the statistical method selected to reduce the dimensionality of the tracts with statistically significant differences between groups, was a PCA for each one of them. A varimax rotation was carried out in order to understand how the variance was described. We used varimax rotation because this method simplifies the interpretation (Bryant and Yarnold, 1995), since each factor represents only a small number of variables. We fixed the threshold at eigenvalues-greater-than-one as the criterion for factor extraction because such analysis is probably most reliable when the number of variables is between 20 and 50 (Hair, 1988). Only those items with communality greater than 0.40, were retained and allocated to factors. We used the Family Wise Error method in order to correct for multiple comparisons, and we applied the Threshold-Free Cluster Enhancement method to find clusters in the data. All statistical analyses were performed using SPSS version 17.
4. Results
4.1 Demographic and clinical characteristics
DSM-IV diagnoses of the FEP patients included in the study were as follows: brief psychotic disorder (n=11), schizophreniform disorder (n=16) and schizophrenia (n=8). The level of education was higher in the control group compared with the FEP group (t(68)=4.71, p<0.001). The mean duration of untreated psychosis in the FEP group was 25.14 weeks (SD±27.59, range 1-104 weeks). The FEP patients and the control group were similar in age, gender, handedness, cannabis use and tobacco use (Table 1). The mean PANSS total score for the FEP group was 97.3±16.1 at the time of MRI scanning.
Table 1. Demographic and Clinical Characteristics of the Sample.
| Control group | FEP group | |
|---|---|---|
| Age (±SD) years | 24.54 (6.27) | 24.60 (6.24) |
| Gender (male/female) | 22/13 | 22/13 |
| Education (±SD) years | 15.09 (3.76) | 11.14 (3.21)* |
| Handedness (right/left) | 35/0 | 35/0 |
| Tobacco (Ever Used) | 11/35 | 11/35 |
| Cannabis (Ever Used) | 5/35 | 6/35 |
| Duration of untreated psychosis (±SD) weeks | ----- | 25.14 (27.59) |
| PANSS Positive Symptoms | ----- | 23.03 (4.36) |
| PANSS Negative Symptoms | ----- | 24.66 (5.69) |
| PANSS General Symptoms | ----- | 49.54 (9.75) |
FEP, First-episode psychosis patients; PANSS, Positive and Negative Syndrome Scale.
p < 0.05
4.2 Diffusion measures
The results from voxel-based DTI analysis in white matter fiber tracts across the entire brain showed FA reduction in the white matter in FEP patients compared with controls (Figure 1). Similarly, using the JHU and the ICBM-DTI-81 atlases, lower FA values were found in projection, association, commissural, and brain stem tracts in the FEP patients compared with the control group (Table 2, Figure 2). The results of the FA comparisons did not change regardless of whether the educational level was included as a covariate (data not shown).
Figure 1.
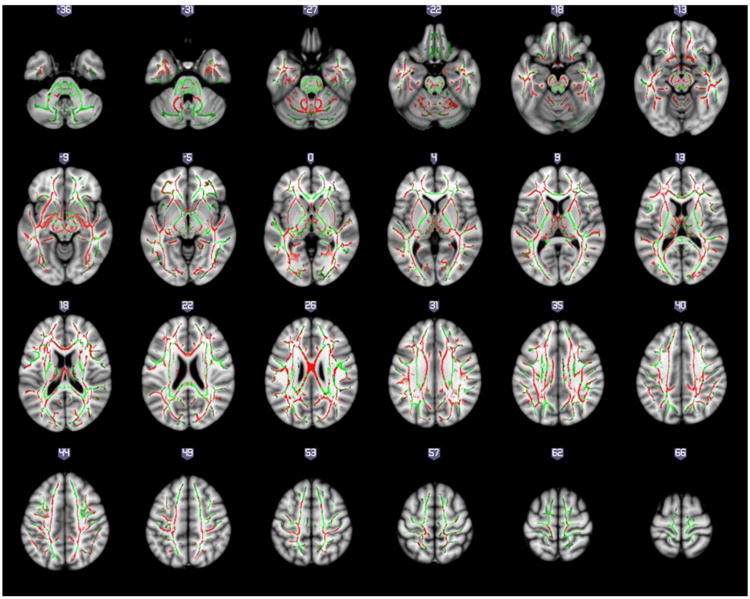
Regions with fractional anisotropy (FA) reduction in first-episode psychosis compared to healthy controls are presented in red. Regions in green represents those showing no difference between controls and patients and are provided as reference. Results are shown overlaid on the Montreal Neurologic Institute template and the mean FA skeleton.
Table 2. Fractional anisotropy in first episode-psychosis and healthy control groups.
| Mean FA | Statistics | ||||
|---|---|---|---|---|---|
| Tract | Side | Control | FEP | T | p |
| Body of corpus callosum | - | 0.583 ± 0.017 | 0.566 ± 0.029 | 3.130 | 0.030 |
| Fornix (column and body of fornix) | - | 0.415 ± 0.045 | 0.383 ± 0.042 | 3.092 | 0.003 |
| Inferior cerebellar peduncle | R | 0.501 ± 0.022 | 0.479 ± 0.031 | 3.431 | 0.001 |
| Inferior cerebellar peduncle | L | 0.506 ± 0.019 | 0.484 ± 0.029 | 3.671 | <0.0001 |
| Superior cerebellar peduncle | R | 0.546 ± 0.028 | 0.527 ± 0.024 | 3.177 | 0.002 |
| Superior cerebellar peduncle | L | 0.514 ± 0.025 | 0.497 ± 0.020 | 3.067 | 0.003 |
| Cerebral peduncle | R | 0.631 ± 0.023 | 0.617 ± 0.019 | 2.820 | 0.006 |
| Cerebral peduncle | L | 0.635 ± 0.020 | 0.618 ± 0.020 | 3.714 | <0.0001 |
| Anterior limb of internal capsule | R | 0.533 ± 0.021 | 0.522 ± 0.021 | 2.211 | 0.030 |
| Anterior limb of internal capsule | L | 0.518 ± 0.019 | 0.508 ± 0.017 | 2.237 | 0.029 |
| Retrolenticular part of internal capsule | L | 0.561 ± 0.025 | 0.547 ± 0.023 | 2.446 | 0.017 |
| Anterior corona radiata | L | 0.432 ± 0.020 | 0.421 ± 0.021 | 2.183 | 0.033 |
| Sagittal stratum (includes inferior longitudinal fasciculus and inferior fronto-occipital fasciculus) | R | 0.513 ± 0.023 | 0.495 ± 0.020 | 3.617 | 0.001 |
| Sagittal stratum (includes inferior longitudinal fasciculus and inferior fronto-occipital fasciculus) | L | 0.477 ± 0.018 | 0.462 ± 0.019 | 3.533 | 0.001 |
| External capsule | R | 0.386 ± 0.015 | 0.378 ± 0.015 | 2.260 | 0.027 |
| External capsule | L | 0.396 ± 0.013 | 0.386 ± 0.014 | 3.280 | 0.002 |
| Cingulum (cingulate gyrus) | L | 0.486 ± 0.031 | 0.466 ± 0.032 | 2.727 | 0.008 |
| Cingulum (hippocampus) | R | 0.386 ± 0.032 | 0.354 ± 0.026 | 4.577 | <0.0001 |
| Cingulum (hippocampus) | L | 0.381 ± 0.029 | 0.349 ± 0.025 | 4.990 | <0.0001 |
| Fornix / Stria terminalis | L | 0.492 ± 0.027 | 0.477 ± 0.026 | 2.241 | 0.028 |
| Superior longitudinal fasciculus | R | 0.447 ± 0.020 | 0.436 ± 0.020 | 2.172 | 0.033 |
| Superior longitudinal fasciculus | L | 0.438 ± 0.019 | 0.426 ± 0.017 | 2.810 | 0.006 |
FA, fractional anisotropy; FEP, first episode-psychosis group; R, right; L, left
Figure 2.

Fractional anisotropy differences between first-episode psychosis patients and healthy control groups. Results are shown overlaid on the Montreal Neurologic Institute template. For detailed statistics, please refer to Table 2.
The results from voxel-based and cluster-label maps analysis were very similar in the regions that showed lower FA values in FEP patients. No significant correlations were found between FA and the age of onset or duration of symptoms. A correlation was found between negative subscores on the PANSS and FA values in the right external capsule (r=-0.363, p=0.03). However, this correlation was not significant after correction for multiple comparisons.
4.3 Principal component analysis
According to Mori et al (2008) based on diffusion tensor imaging (DTI), the white matter tracts were parceled into four possible groups: projection fibers, association fibers, commissural fibers and brainstem tracts; as a main result, the analysis confirmed that the variance of the FA was properly distributed in four factors that represents the theoretical division of the fibers; there was a corresponding distribution especially in the PCA of the FEP.
4.3.1 Control Group PCA
The FA from the Healthy group was described by four factors (Table 3); however, the fiber groups were not clearly separated. Most of the projection fibers were well described by the first factor. The association fibers were described mostly by the first three factors; therefore, these fibers behavior reveals another subgrouping. The brainstem tracts are represented by the first and fourth factors, describing also another subgrouping.
Table 3. Factor loadings of regional fractional anisotropy in the four-factor model-Varimax in First-episode psychosis patients.
| Factors | |||||
|---|---|---|---|---|---|
| Parcelation | Region | 1 | 2 | 3 | 4 |
| Projection fibers | Anterior limb of internal capsule L | 0.894 | |||
| Projection fibers | Cerebral peduncle R | 0.618 | |||
| Projection fibers | Anterior limb of internal capsule R | 0.803 | |||
| Projection fibers | Cerebral peduncle L | 0.712 | |||
| Projection fibers | Anterior corona radiata L | 0.592 | |||
| Projection fibers | Retro lenticular part of internal capsule L | 0.752 | |||
| Commisural fibers | Body of corpus callosum | 0.451 | |||
| Association fibers | External capsule R | 0.677 | |||
| Association fibers | Cingulum (cingulate gyrus) L | 0.715 | |||
| Association fibers | Sagittal stratum R | 0.659 | |||
| Association fibers | Sagittal stratum L | 0.768 | |||
| Association fibers | Superior longitudinal fasciculus R | 0.633 | |||
| Association fibers | Superior longitudinal fasciculus L | 0.539 | |||
| Association fibers | Cingulum (hippocampus) R | 0.579 | |||
| Association fibers | Cingulum (hippocampus) L | 0.649 | |||
| Association fibers | Fornix (cres) / Stria terminalis L | 0.635 | |||
| Association fibers | External capsule L | 0.721 | |||
| Association fibers | Fornix (column and body of fornix) | 0.599 | |||
| Brainstem tracts | Inferior cerebellar peduncle R | 0.67 | |||
| Brainstem tracts | Inferior cerebellar peduncle L | 0.655 | |||
| Brainstem tracts | Superior cerebellar peduncle R | 0.811 | |||
| Brainstem tracts | Superior cerebellar peduncle L | 0.905 | |||
| Eigenvalue | 5 | 3.4 | 3.2 | 2.9 | |
| Variance (%) | 22.9 | 15.5 | 14.7 | 13.4 | |
R, Right; L, Left.
4.3.2 First episode of psychosis PCA
The FA from the FEP group was clearly described by different factors associated to the fibers groups (Table 4). Also, as an interesting result, the variables of the association fibers and the brainstem tracts were clearly separated and explained by their corresponding factors. The first factor grouped all the projection fibers variables and the fourth factor grouped all the brainstem tracts, showing a high correlation between each type of fibers and the proposed factors. The association fibers were described by two factors; therefore, these fibers behavior reveals another subgrouping.
Table 4. Factor loadings of regional fractional anisotropy in the four-factor model-Varimax in healthy control group.
| Factors | |||||
|---|---|---|---|---|---|
| Parcelation | Region | 1 | 2 | 3 | 4 |
| Projection fibers | Anterior limb of internal capsule L | 0.85 | |||
| Projection fibers | Cerebral peduncle R | 0.783 | |||
| Projection fibers | Anterior limb of internal capsule R | 0.757 | |||
| Projection fibers | Cerebral peduncle L | 0.718 | |||
| Projection fibers | Anterior corona radiata L | 0.653 | |||
| Projection fibers | Retrolenticular part of internal capsule L | 0.795 | |||
| Commisural fibers | Body of corpus callosum | 0.549 | |||
| Association fibers | External capsule R | 0.727 | |||
| Association fibers | Cingulum (cingulate gyrus) L | 0.569 | |||
| Association fibers | Sagittal stratum R | 0.746 | |||
| Association fibers | Sagittal stratum L | 0.764 | |||
| Association fibers | Superior longitudinal fasciculus R | 0.55 | |||
| Association fibers | Superior longitudinal fasciculus L | 0.786 | |||
| Association fibers | Cingulum (hippocampus) R | 0.863 | |||
| Association fibers | Cingulum (hippocampus) L | 0.839 | |||
| Association fibers | Fornix (cres) / Stria terminalis L | 0.561 | |||
| Association fibers | External capsule L | NA | NA | NA | NA |
| Association fibers | Fornix (column and body of fornix) | 0.532 | |||
| Brainstem tracts | Inferior cerebellar peduncle R | 0.678 | |||
| Brainstem tracts | Inferior cerebellar peduncle L | 0.679 | |||
| Brainstem tracts | Superior cerebellar peduncle R | 0.63 | |||
| Brainstem tracts | Superior cerebellar peduncle L | 0.673 | |||
| Eigenvalue | 5.7 | 3.9 | 2.6 | 1.8 | |
| Variance (%) | 27.1 | 18.4 | 12.2 | 8.5 | |
R, Right; L, Left.
4.3.3 First episode of psychosis PCA vs Control Group PCA
The composition of the factors obtained by the rotated PCA was qualitatively different between controls and patients. The total variance included in the control group was 66.2% and in the patient group was 66.5%. In both groups, the factor that described most of the variance corresponded to projection fibers. This means that FA values in the projection fibers have a high correlation between them in contrast with the values located in different factors, showing that there is a group of fibers that, with the DTI technique, behave in a very similar way.
The variance explained by the first factor in the FEP group was 22.9%, and the variance in the control group was 27.1%. In the analysis of the two models, it is clear that the parcellation proposed by Mori et al is more apparent in the PCA of the FEP group than in the PCA of the control group.
As a secondary result, the association fibers seem to reveal a sub segmentation that could be studied in further researches. No correlations were observed between the mean FA for each factor composition and PANSS subscores in FEP patients.
5. Discussion
The results of the present study confirms white matter integrity abnormalities that have already been described in drug-naïve FEP patients (Cheung et al., 2008; Filippi et al., 2014; Guo et al., 2012; Liu et al., 2013; Mandl et al., 2013; Wang et al., 2013b). To the best of our knowledge, our DTI study is the first to investigate at 3T the white matter integrity in drug-naïve FEP patients compared with controls, using TBSS and PCA. Some studies have assessed FEP drug-naïve patients, but have used different image analysis (Mandl et al., 2013; Wang et al., 2013a) or not performed at 3T (Cheung et al., 2008; Filippi et al., 2014; Gasparotti et al., 2009; Mandl et al., 2013). Moreover, our study used a PCA based on functional classification of white tract fibers. The combination of a voxelwise analysis of FA with TBSS has been shown to improve the sensitivity, objectivity and interpretability of the analysis, including multi-subject DTI for group comparison, and has shown more sensitivity than region-of-interest analysis in detecting changes in white matter regions (Focke et al., 2008).
The PCA helped explain the difference in white matter tracts between FEP patients and controls in terms of a limited number of underlying factors. This analysis showed that the factor composition is qualitatively different in patients than in controls. In both groups, the first factor mainly composed by projection fibers, explained most of the variance. In the differences found between them, it can be seen that the parcellation proposed by Mori et al, is most clearly observed in the PCA of the FEP patients. This is evident in the projection fibers and in the fibers of the brain stem, where the FEP model shows a better grouping, in comparison with the model of the control group. Similarly, in the PCA of the FEP, commissural and association fibers are compacted in the factors 2 and 3.
The projection fibers play a key role in the processing, coordination and integration of perceptual inputs and outputs, and a disruption in this connection has been hypothesized to contribute significantly to neuropsychological disturbances seen in schizophrenia (Spoletini et al., 2009). In patients, the second and third factors encompass association and commissural fibers, including temporo-limbic tracts that have been associated with the presence of abulia, anhedonia and apathy in schizophrenia, especially in the early onset of the illness (Fujiwara et al., 2007; Paillere-Martinot et al., 2001). The anomaly within temporo-limbic tracts could also affect heteromodal processing of information, mainly processes such as attention, executive function, mnemonic function and abstraction. Bilateral involvement of the fornix may affect the short-term memory and the formation of new memories, characteristics that have been observed in patients with schizophrenia (Fitzsimmons et al., 2009).
The fourth factor encompasses tracts in the brainstem such as the inferior and superior cerebellar peduncles. The anomalies in the cerebellar peduncles may help explain the higher degree of postural instability in patients with schizophrenia, compared with healthy individuals (Caligiuri and Lohr, 1994; Kent et al., 2012; Marvel et al., 2004). Wang et al (2003) specifically studied the FA of the cerebellar peduncles in patients with schizophrenia and did not find any difference from controls. However, this study included medicated schizophrenia patients, and the sample size was smaller than that used in the current study.
Our study has various limitations. First, we did not include cognitive evaluations; therefore, the relationship between white matter alterations and cognitive performance could not be explored. Second, the groups could not be matched for education; educational levels were higher in the control group than in the FEP group, which is a common observation. Nevertheless, the results did not change whether or not the educational level was included as a covariate in the analysis. Our results, generated using TBSS and a novel statistical analysis, suggest extensive white matter alterations in drug-naïve FEP patients. White matter alterations apparently occur before antipsychotic exposure and during the FEP, before the psychotic illness becomes chronic. Our study adds to a growing body of literature that emphasizes the need for treatments targeting white matter function and structure. Future studies should integrate white matter imaging techniques to help decipher which components of white matter anomalies (i.e., myelin, axon, extracellular matrix) are specifically altered in schizophrenia.
Supplementary Material
Acknowledgments
The authors thank INNN's Neuroimaging Department, especially Jesús Taboada, MD, and Oscar Marrufo, PhD, for facilities for the development of this study. English style review was supported by CIHR MOP-114989 grant.
Role of funding source: This work was supported by Consejo Nacional de Ciencia y Tecnología (CONACyT) research grant 182279 to Ariel Graff-Guerrero, CONACyT research grants 89530 and 182279 to Camilo de la Fuente-Sandoval, CONACyT Scholarship to Patricia Alvarado-Alanis, Pablo León-Ortiz and Francisco Reyes-Madrigal, Sistema Nacional de Investigadores (SNI) to Ariel Graff-Guerrero, Humberto Nicolini and Camilo de la Fuente-Sandoval, and National Institutes of Health (NIH) grant R01MH094520 to Laura M. Rowland. CONACyT, SNI and NIH had no further role in the study design; in the collection, analysis and interpretation of data; in the writing of the manuscript; or in the decision to submit the article for publication.
Footnotes
Contributors: Camilo de la Fuente-Sandoval, Pablo León-Ortiz and Ariel Graff-Guerrero designed the study. Francisco Reyes-Madrigal, Oscar Rodríguez-Mayoral and Mariana Azcárraga participated in recruitment and the clinical evaluations. Patricia Alvarado-Alanis, Camilo de la Fuente-Sandoval, Humberto Nicolini and Rafael Favila undertook the statistical analysis. Camilo de la Fuente-Sandoval, Pablo León-Ortiz and Laura M. Rowland wrote the first draft of the manuscript. All authors contributed to and have approved the final reviewed manuscript. Camilo de la Fuente-Sandoval had full access to all of the data in the study and takes responsibility for the integrity of the data and the accuracy of the data analysis.
Conflict of Interest: Camilo de la Fuente-Sandoval has received grant support from Janssen (Johnson & Johnson), and has served as consultant and/or speaker for AstraZeneca, Eli Lilly and Janssen. Ariel Graff-Guerrero has received grant support from Janssen, and has served as consultant and/or speaker for Abbott Laboratories, Gedeon Richter Plc and Eli Lilly. Rafael Favila is an employee of GE Healthcare. Laura M. Rowland has received grant support from NIH and NARSAD. The rest of the authors declare no conflict of interest.
Publisher's Disclaimer: This is a PDF file of an unedited manuscript that has been accepted for publication. As a service to our customers we are providing this early version of the manuscript. The manuscript will undergo copyediting, typesetting, and review of the resulting proof before it is published in its final citable form. Please note that during the production process errors may be discovered which could affect the content, and all legal disclaimers that apply to the journal pertain.
References
- Astrakas LG, Argyropoulou MI. Shifting from region of interest (ROI) to voxel-based analysis in human brain mapping. Pediatr Radiol. 2010;40(12):1857–1867. doi: 10.1007/s00247-010-1677-8. [DOI] [PubMed] [Google Scholar]
- Basser PJ, Pierpaoli C. Microstructural and physiological features of tissues elucidated by quantitative-diffusion-tensor MRI. J Magn Reson B. 1996;111(3):209–219. doi: 10.1006/jmrb.1996.0086. [DOI] [PubMed] [Google Scholar]
- Beaulieu C. The basis of anisotropic water diffusion in the nervous system - a technical review. NMR Biomed. 2002;15(7-8):435–455. doi: 10.1002/nbm.782. [DOI] [PubMed] [Google Scholar]
- Bryant FB, Yarnold PR. Principal-components analysis and confirmatory factor analysis. In: Grimm LG, Yarnold PR, editors. Reading and understanding multivariate statistics. American Psychological Association; Washington, DC: 1995. pp. 99–136. [Google Scholar]
- Caligiuri MP, Lohr JB. A disturbance in the control of muscle force in neuroleptic-naive schizophrenic patients. Biol Psychiatry. 1994;35(2):104–111. doi: 10.1016/0006-3223(94)91199-1. [DOI] [PubMed] [Google Scholar]
- Cannon M, Jones PB, Murray RM. Obstetric complications and schizophrenia: historical and meta-analytic review. Am J Psychiatry. 2002;159(7):1080–1092. doi: 10.1176/appi.ajp.159.7.1080. [DOI] [PubMed] [Google Scholar]
- Cheung V, Cheung C, McAlonan GM, Deng Y, Wong JG, Yip L, Tai KS, Khong PL, Sham P, Chua SE. A diffusion tensor imaging study of structural dysconnectivity in never-medicated, first-episode schizophrenia. Psychol Med. 2008;38(6):877–885. doi: 10.1017/S0033291707001808. [DOI] [PubMed] [Google Scholar]
- Chung S, Pelletier D, Sdika M, Lu Y, Berman JI, Henry RG. Whole brain voxel-wise analysis of single-subject serial DTI by permutation testing. Neuroimage. 2008;39(4):1693–1705. doi: 10.1016/j.neuroimage.2007.10.039. [DOI] [PMC free article] [PubMed] [Google Scholar]
- Church SM, Cotter D, Bramon E, Murray RM. Does schizophrenia result from developmental or degenerative processes? J Neural Transm Suppl. 2002;(63):129–147. doi: 10.1007/978-3-7091-6137-1_8. [DOI] [PubMed] [Google Scholar]
- Collinson SL, Gan SC, Woon PS, Kuswanto C, Sum MY, Yang GL, Lui JM, Sitoh YY, Nowinski WL, Sim K. Corpus callosum morphology in first-episode and chronic schizophrenia: combined magnetic resonance and diffusion tensor imaging study of Chinese Singaporean patients. Br J Psychiatry. 2014;204(1):55–60. doi: 10.1192/bjp.bp.113.127886. [DOI] [PubMed] [Google Scholar]
- Ellison-Wright I, Bullmore E. Meta-analysis of diffusion tensor imaging studies in schizophrenia. Schizophr Res. 2009;108(1-3):3–10. doi: 10.1016/j.schres.2008.11.021. [DOI] [PubMed] [Google Scholar]
- Filippi M, Canu E, Gasparotti R, Agosta F, Valsecchi P, Lodoli G, Galluzzo A, Comi G, Sacchetti E. Patterns of brain structural changes in first-contact, antipsychotic drug-naive patients with schizophrenia. AJNR Am J Neuroradiol. 2014;35(1):30–37. doi: 10.3174/ajnr.A3583. [DOI] [PMC free article] [PubMed] [Google Scholar]
- First MB, Spitzer RL, Williams JB, Gibbon M. Structured Clinical Interview for DSM-IV Disorders (SCID) American Psychiatric Association; Washington, DC: 1997. [Google Scholar]
- Fitzsimmons J, Hamoda HM, Swisher T, Terry D, Rosenberger G, Seidman LJ, Goldstein J, Mesholam-Gately R, Petryshen T, Wojcik J, Kikinis R, Kubicki M. Diffusion tensor imaging study of the fornix in first episode schizophrenia and in healthy controls. Schizophr Res. 2014;156(2-3):157–160. doi: 10.1016/j.schres.2014.04.022. [DOI] [PMC free article] [PubMed] [Google Scholar]
- Fitzsimmons J, Kubicki M, Smith K, Bushell G, Estepar RS, Westin CF, Nestor PG, Niznikiewicz MA, Kikinis R, McCarley RW, Shenton ME. Diffusion tractography of the fornix in schizophrenia. Schizophr Res. 2009;107(1):39–46. doi: 10.1016/j.schres.2008.10.022. [DOI] [PMC free article] [PubMed] [Google Scholar]
- Flynn SW, Lang DJ, Mackay AL, Goghari V, Vavasour IM, Whittall KP, Smith GN, Arango V, Mann JJ, Dwork AJ, Falkai P, Honer WG. Abnormalities of myelination in schizophrenia detected in vivo with MRI, and post-mortem with analysis of oligodendrocyte proteins. Mol Psychiatry. 2003;8(9):811–820. doi: 10.1038/sj.mp.4001337. [DOI] [PubMed] [Google Scholar]
- Focke NK, Yogarajah M, Bonelli SB, Bartlett PA, Symms MR, Duncan JS. Voxel-based diffusion tensor imaging in patients with mesial temporal lobe epilepsy and hippocampal sclerosis. Neuroimage. 2008;40(2):728–737. doi: 10.1016/j.neuroimage.2007.12.031. [DOI] [PubMed] [Google Scholar]
- Friston KJ, Frith CD. Schizophrenia: a disconnection syndrome? Clin Neurosci. 1995;3(2):89–97. [PubMed] [Google Scholar]
- Fujiwara H, Namiki C, Hirao K, Miyata J, Shimizu M, Fukuyama H, Sawamoto N, Hayashi T, Murai T. Anterior and posterior cingulum abnormalities and their association with psychopathology in schizophrenia: a diffusion tensor imaging study. Schizophr Res. 2007;95(1-3):215–222. doi: 10.1016/j.schres.2007.05.044. [DOI] [PubMed] [Google Scholar]
- Gasparotti R, Valsecchi P, Carletti F, Galluzzo A, Liserre R, Cesana B, Sacchetti E. Reduced fractional anisotropy of corpus callosum in first-contact, antipsychotic drug-naive patients with schizophrenia. Schizophr Res. 2009;108(1-3):41–48. doi: 10.1016/j.schres.2008.11.015. [DOI] [PubMed] [Google Scholar]
- Guo W, Liu F, Liu Z, Gao K, Xiao C, Chen H, Zhao J. Right lateralized white matter abnormalities in first-episode, drug-naive paranoid schizophrenia. Neurosci Lett. 2012;531(1):5–9. doi: 10.1016/j.neulet.2012.09.033. [DOI] [PubMed] [Google Scholar]
- Hair JF, Anderson RE, Tatham RL, Black WC. Multivariate Data Analysis. Prentice Hall; New Jersey, USA: 1988. [Google Scholar]
- Hua K, Zhang J, Wakana S, Jiang H, Li X, Reich DS, Calabresi PA, Pekar JJ, van Zijl PC, Mori S. Tract probability maps in stereotaxic spaces: analyses of white matter anatomy and tract-specific quantification. Neuroimage. 2008;39(1):336–347. doi: 10.1016/j.neuroimage.2007.07.053. [DOI] [PMC free article] [PubMed] [Google Scholar]
- Insel TR. Rethinking schizophrenia. Nature. 2010;468(7321):187–193. doi: 10.1038/nature09552. [DOI] [PubMed] [Google Scholar]
- Kanaan RA, Kim JS, Kaufmann WE, Pearlson GD, Barker GJ, McGuire PK. Diffusion tensor imaging in schizophrenia. Biol Psychiatry. 2005;58(12):921–929. doi: 10.1016/j.biopsych.2005.05.015. [DOI] [PubMed] [Google Scholar]
- Kay SR, Fiszbein A, Opler LA. The positive and negative syndrome scale (PANSS) for schizophrenia. Schizophr Bull. 1987;13(2):261–276. doi: 10.1093/schbul/13.2.261. [DOI] [PubMed] [Google Scholar]
- Kent JS, Hong SL, Bolbecker AR, Klaunig MJ, Forsyth JK, O'Donnell BF, Hetrick WP. Motor deficits in schizophrenia quantified by nonlinear analysis of postural sway. PLoS One. 2012;7(8):e41808. doi: 10.1371/journal.pone.0041808. [DOI] [PMC free article] [PubMed] [Google Scholar]
- Kong X, Ouyang X, Tao H, Liu H, Li L, Zhao J, Xue Z, Wang F, Jiang S, Shan B, Liu Z. Complementary diffusion tensor imaging study of the corpus callosum in patients with first-episode and chronic schizophrenia. J Psychiatry Neurosci. 2011;36(2):120–125. doi: 10.1503/jpn.100041. [DOI] [PMC free article] [PubMed] [Google Scholar]
- Konrad A, Winterer G. Disturbed structural connectivity in schizophrenia primary factor in pathology or epiphenomenon? Schizophr Bull. 2008;34(1):72–92. doi: 10.1093/schbul/sbm034. [DOI] [PMC free article] [PubMed] [Google Scholar]
- Kubicki M, McCarley RW, Shenton ME. Evidence for white matter abnormalities in schizophrenia. Curr Opin Psychiatry. 2005a;18(2):121–134. doi: 10.1097/00001504-200503000-00004. [DOI] [PMC free article] [PubMed] [Google Scholar]
- Kubicki M, Park H, Westin CF, Nestor PG, Mulkern RV, Maier SE, Niznikiewicz M, Connor EE, Levitt JJ, Frumin M, Kikinis R, Jolesz FA, McCarley RW, Shenton ME. DTI and MTR abnormalities in schizophrenia: analysis of white matter integrity. Neuroimage. 2005b;26(4):1109–1118. doi: 10.1016/j.neuroimage.2005.03.026. [DOI] [PMC free article] [PubMed] [Google Scholar]
- Lee DY, Smith GN, Su W, Honer WG, Macewan GW, Lapointe JS, Vertinsky AT, Vila-Rodriguez F, Kopala LC, Lang DJ. White matter tract abnormalities in first-episode psychosis. Schizophr Res. 2012;141(1):29–34. doi: 10.1016/j.schres.2012.06.042. [DOI] [PubMed] [Google Scholar]
- Lee SH, Kubicki M, Asami T, Seidman LJ, Goldstein JM, Mesholam-Gately RI, McCarley RW, Shenton ME. Extensive white matter abnormalities in patients with first-episode schizophrenia: a Diffusion Tensor Imaging (DTI) study. Schizophr Res. 2013;143(2-3):231–238. doi: 10.1016/j.schres.2012.11.029. [DOI] [PMC free article] [PubMed] [Google Scholar]
- Liu X, Lai Y, Wang X, Hao C, Chen L, Zhou Z, Yu X, Hong N. Reduced white matter integrity and cognitive deficit in never-medicated chronic schizophrenia: a diffusion tensor study using TBSS. Behav Brain Res. 2013;252:157–163. doi: 10.1016/j.bbr.2013.05.061. [DOI] [PubMed] [Google Scholar]
- Luck D, Buchy L, Czechowska Y, Bodnar M, Pike GB, Campbell JS, Achim A, Malla A, Joober R, Lepage M. Fronto-temporal disconnectivity and clinical short-term outcome in first episode psychosis: a DTI-tractography study. J Psychiatr Res. 2011;45(3):369–377. doi: 10.1016/j.jpsychires.2010.07.007. [DOI] [PubMed] [Google Scholar]
- Mandl RC, Rais M, van Baal GC, van Haren NE, Cahn W, Kahn RS, Hulshoff Pol HE. Altered white matter connectivity in never-medicated patients with schizophrenia. Hum Brain Mapp. 2013;34(9):2353–2365. doi: 10.1002/hbm.22075. [DOI] [PMC free article] [PubMed] [Google Scholar]
- Marvel CL, Schwartz BL, Rosse RB. A quantitative measure of postural sway deficits in schizophrenia. Schizophr Res. 2004;68(2-3):363–372. doi: 10.1016/j.schres.2003.09.003. [DOI] [PubMed] [Google Scholar]
- McGuire PK, Frith CD. Disordered functional connectivity in schizophrenia. Psychol Med. 1996;26(4):663–667. doi: 10.1017/s0033291700037673. [DOI] [PubMed] [Google Scholar]
- Meda SA, Gill A, Stevens MC, Lorenzoni RP, Glahn DC, Calhoun VD, Sweeney JA, Tamminga CA, Keshavan MS, Thaker G, Pearlson GD. Differences in resting-state functional magnetic resonance imaging functional network connectivity between schizophrenia and psychotic bipolar probands and their unaffected first-degree relatives. Biol Psychiatry. 2012;71(10):881–889. doi: 10.1016/j.biopsych.2012.01.025. [DOI] [PMC free article] [PubMed] [Google Scholar]
- Mori S, Oishi K, Faria AV. White matter atlases based on diffusion tensor imaging. Curr Opin Neurol. 2009;22(4):362–369. doi: 10.1097/WCO.0b013e32832d954b. [DOI] [PMC free article] [PubMed] [Google Scholar]
- Mori S, Oishi K, Jiang H, Jiang L, Li X, Akhter K, Hua K, Faria AV, Mahmood A, Woods R, Toga AW, Pike GB, Neto PR, Evans A, Zhang J, Huang H, Miller MI, van Zijl P, Mazziotta J. Stereotaxic white matter atlas based on diffusion tensor imaging in an ICBM template. Neuroimage. 2008;40(2):570–582. doi: 10.1016/j.neuroimage.2007.12.035. [DOI] [PMC free article] [PubMed] [Google Scholar]
- Nichols TE, Holmes AP. Nonparametric permutation tests for functional neuroimaging: a primer with examples. Hum Brain Mapp. 2002;15(1):1–25. doi: 10.1002/hbm.1058. [DOI] [PMC free article] [PubMed] [Google Scholar]
- Olabi B, Ellison-Wright I, McIntosh AM, Wood SJ, Bullmore E, Lawrie SM. Are there progressive brain changes in schizophrenia? A meta-analysis of structural magnetic resonance imaging studies. Biol Psychiatry. 2011;70(1):88–96. doi: 10.1016/j.biopsych.2011.01.032. [DOI] [PubMed] [Google Scholar]
- Paillere-Martinot M, Caclin A, Artiges E, Poline JB, Joliot M, Mallet L, Recasens C, Attar-Levy D, Martinot JL. Cerebral gray and white matter reductions and clinical correlates in patients with early onset schizophrenia. Schizophr Res. 2001;50(1-2):19–26. doi: 10.1016/s0920-9964(00)00137-7. [DOI] [PubMed] [Google Scholar]
- Pasternak O, Westin CF, Bouix S, Seidman LJ, Goldstein JM, Woo TU, Petryshen TL, Mesholam-Gately RI, McCarley RW, Kikinis R, Shenton ME, Kubicki M. Excessive extracellular volume reveals a neurodegenerative pattern in schizophrenia onset. J Neurosci. 2012;32(48):17365–17372. doi: 10.1523/JNEUROSCI.2904-12.2012. [DOI] [PMC free article] [PubMed] [Google Scholar]
- Peters BD, Blaas J, de Haan L. Diffusion tensor imaging in the early phase of schizophrenia: what have we learned? J Psychiatr Res. 2010;44(15):993–1004. doi: 10.1016/j.jpsychires.2010.05.003. [DOI] [PubMed] [Google Scholar]
- Peters BD, Karlsgodt KH. White matter development in the early stages of psychosis. Schizophr Res. 2014 doi: 10.1016/j.schres.2014.05.021. [DOI] [PMC free article] [PubMed] [Google Scholar]
- Seal ML, Yucel M, Fornito A, Wood SJ, Harrison BJ, Walterfang M, Pell GS, Pantelis C. Abnormal white matter microstructure in schizophrenia: a voxelwise analysis of axial and radial diffusivity. Schizophr Res. 2008;101(1-3):106–110. doi: 10.1016/j.schres.2007.12.489. [DOI] [PubMed] [Google Scholar]
- Shergill SS, Brammer MJ, Williams SC, Murray RM, McGuire PK. Mapping auditory hallucinations in schizophrenia using functional magnetic resonance imaging. Arch Gen Psychiatry. 2000;57(11):1033–1038. doi: 10.1001/archpsyc.57.11.1033. [DOI] [PubMed] [Google Scholar]
- Shi F, Yap PT, Gao W, Lin W, Gilmore JH, Shen D. Altered structural connectivity in neonates at genetic risk for schizophrenia: a combined study using morphological and white matter networks. Neuroimage. 2012;62(3):1622–1633. doi: 10.1016/j.neuroimage.2012.05.026. [DOI] [PMC free article] [PubMed] [Google Scholar]
- Singh F, Mirzakhanian H, Fusar-Poli P, de la Fuente-Sandoval C, Cadenhead KS. Ethical implications for clinical practice and future research in “at risk” individuals. Curr Pharm Des. 2012;18(4):606–612. doi: 10.2174/138161212799316262. [DOI] [PMC free article] [PubMed] [Google Scholar]
- Smith SM, Jenkinson M, Johansen-Berg H, Rueckert D, Nichols TE, Mackay CE, Watkins KE, Ciccarelli O, Cader MZ, Matthews PM, Behrens TE. Tract-based spatial statistics: voxelwise analysis of multi-subject diffusion data. Neuroimage. 2006;31(4):1487–1505. doi: 10.1016/j.neuroimage.2006.02.024. [DOI] [PubMed] [Google Scholar]
- Smith SM, Jenkinson M, Woolrich MW, Beckmann CF, Behrens TE, Johansen-Berg H, Bannister PR, De Luca M, Drobnjak I, Flitney DE, Niazy RK, Saunders J, Vickers J, Zhang Y, De Stefano N, Brady JM, Matthews PM. Advances in functional and structural MR image analysis and implementation as FSL. Neuroimage. 2004;23(Suppl 1):S208–219. doi: 10.1016/j.neuroimage.2004.07.051. [DOI] [PubMed] [Google Scholar]
- Smith SM, Johansen-Berg H, Jenkinson M, Rueckert D, Nichols TE, Miller KL, Robson MD, Jones DK, Klein JC, Bartsch AJ, Behrens TE. Acquisition and voxelwise analysis of multi-subject diffusion data with tract-based spatial statistics. Nat Protoc. 2007;2(3):499–503. doi: 10.1038/nprot.2007.45. [DOI] [PubMed] [Google Scholar]
- Spoletini I, Cherubini A, Di Paola M, Banfi G, Rusch N, Martinotti G, Bria P, Rubino IA, Siracusano A, Caltagirone C, Spalletta G. Reduced fronto-temporal connectivity is associated with frontal gray matter density reduction and neuropsychological deficit in schizophrenia. Schizophr Res. 2009;108(1-3):57–68. doi: 10.1016/j.schres.2008.11.011. [DOI] [PubMed] [Google Scholar]
- Tandon R, Keshavan MS, Nasrallah HA. Schizophrenia, “just the facts” what we know in 2008. 2. Epidemiology and etiology. Schizophr Res. 2008;102(1-3):1–18. doi: 10.1016/j.schres.2008.04.011. [DOI] [PubMed] [Google Scholar]
- van Haren NE, Rijsdijk F, Schnack HG, Picchioni MM, Toulopoulou T, Weisbrod M, Sauer H, van Erp TG, Cannon TD, Huttunen MO, Boomsma DI, Hulshoff Pol HE, Murray RM, Kahn RS. The genetic and environmental determinants of the association between brain abnormalities and schizophrenia: the schizophrenia twins and relatives consortium. Biol Psychiatry. 2012;71(10):915–921. doi: 10.1016/j.biopsych.2012.01.010. [DOI] [PMC free article] [PubMed] [Google Scholar]
- Wang F, Sun Z, Du X, Wang X, Cong Z, Zhang H, Zhang D, Hong N. A diffusion tensor imaging study of middle and superior cerebellar peduncle in male patients with schizophrenia. Neurosci Lett. 2003;348(3):135–138. doi: 10.1016/s0304-3940(03)00589-5. [DOI] [PubMed] [Google Scholar]
- Wang Q, Cheung C, Deng W, Li M, Huang C, Ma X, Wang Y, Jiang L, McAlonan G, Sham P, Collier DA, Gong Q, Chua SE, Li T. Fronto-parietal white matter microstructural deficits are linked to performance IQ in a first-episode schizophrenia Han Chinese sample. Psychol Med. 2013a;43(10):2047–2056. doi: 10.1017/S0033291712002905. [DOI] [PubMed] [Google Scholar]
- Wang Q, Cheung C, Deng W, Li M, Huang C, Ma X, Wang Y, Jiang L, Sham PC, Collier DA, Gong Q, Chua SE, McAlonan GM, Li T. White-matter microstructure in previously drug-naive patients with schizophrenia after 6 weeks of treatment. Psychol Med. 2013b;43(11):2301–2309. doi: 10.1017/S0033291713000238. [DOI] [PubMed] [Google Scholar]
- Weinberger DR. Implications of normal brain development for the pathogenesis of schizophrenia. Arch Gen Psychiatry. 1987;44(7):660–669. doi: 10.1001/archpsyc.1987.01800190080012. [DOI] [PubMed] [Google Scholar]
- White T, Ehrlich S, Ho BC, Manoach DS, Caprihan A, Schulz SC, Andreasen NC, Gollub RL, Calhoun VD, Magnotta VA. Spatial characteristics of white matter abnormalities in schizophrenia. Schizophr Bull. 2013;39(5):1077–1086. doi: 10.1093/schbul/sbs106. [DOI] [PMC free article] [PubMed] [Google Scholar]
- Yu Q, Sui J, Rachakonda S, He H, Gruner W, Pearlson G, Kiehl KA, Calhoun VD. Altered topological properties of functional network connectivity in schizophrenia during resting state: a small-world brain network study. PLoS One. 2011;6(9):e25423. doi: 10.1371/journal.pone.0025423. [DOI] [PMC free article] [PubMed] [Google Scholar]
- Yurgelun-Todd DA, Waternaux CM, Cohen BM, Gruber SA, English CD, Renshaw PF. Functional magnetic resonance imaging of schizophrenic patients and comparison subjects during word production. Am J Psychiatry. 1996;153(2):200–205. doi: 10.1176/ajp.153.2.200. [DOI] [PubMed] [Google Scholar]
Associated Data
This section collects any data citations, data availability statements, or supplementary materials included in this article.