Abstract
Diffusion Tensor Imaging (DTI) is adversely affected by subject motion. It is necessary to discard the corrupted images before diffusion parameter estimation. However, the consequences of rejecting those images are not well understood. In this study, we investigated the effects of excluding one or more volumes of diffusion weighted images by analyzing the changes in fractional anisotropy (FA), mean diffusivity (MD), axial diffusivity (AD), radial diffusivity (RD) and the primary eigenvector (V1). Based on the full set of diffusion images acquired by Jones30 diffusion scheme, we generated incomplete sets of at least six in three different ways: random, uniform and clustered rejections. The results showed that MD was not significantly affected by rejecting diffusion directions. In the cases of random rejections, FA, AD, RD and V1 were overestimated more greatly with increasing number of rejections and the overestimations were worse in low FA regions than high FA regions. For uniform rejections, at which the remaining diffusion directions are evenly distributed on a sphere, little change was observed in FA and in V1. Clustered rejections, on the other hand, displayed the most significant overestimation of the parameters, and the resulting accuracy depended on the relative orientation of the underlying fibers with respect to the excluded directions. In practice, if diffusion direction data is excluded, it is important to note the number and location of directions rejected, in order to make a more precise analysis of the data.
Keywords: MRI, brain, DTI, anisotropy, motion
1. Introduction
Diffusion Tensor Imaging (DTI) is a powerful non-invasive tool to inspect brain microstructure and abnormalities (Assaf and Pasternak, 2008, Barkovich et al., 2001). The resultant scalar parameters such as fractional anisotropy (FA), mean diffusivity (MD), axial diffusivity (AD), radial diffusivity (RD) are widely used in the evaluation of brain injury (Kraus et al., 2007, Lipton et al., 2008), tumors (Lu et al., 2003), neurodegenerative and white matter diseases (Counsell et al., 2003, Rose et al., 2000). Primary eigenvectors (V1), derived from the tensor model, commonly serve as the basis for fiber tractography, which uses these orientation estimates to reconstruct streamlines that are assumed to represent the underlying white matter architecture (Basser et al., 2000, Mori and van Zijl, 2002).
In order to achieve the most accurate estimate of the diffusion tensor, many studies have investigated various diffusion weighting direction schemes. Jones et al. (1999) proposed the minimization of potential energy of electrostatic repulsion by points on the sphere, and Skare et al. (2000) analyzed the dependence of noise on the condition number of the transforming matrix to the approach of using minimum condition number. The optimal number of encoding directions has also been discussed extensively. Papadakis et al. (2000) evaluated variations of signal-to-noise ratio (SNR) and suggested that minimum of 18 to 21 uniform diffusion directions were needed for robust tensor estimation. However, Hasan et al. (2001) represented that no significant advantage could be achieved by using more than six encoding directions as long as they were icosahedral, and later Batchelor et al. (2003) demonstrated that the icosahedral schemes was rotationally invariant so that noise was independent of fiber orientation or the relative orientation of the tensor with respect to the laboratory frame.
The quality of the diffusion-weighted images can be affected by artifacts introduced by subject motion, respiration or cardiac pulsation. While such artifacts can be diminished by applying “navigator echoes” (Ordidge et al., 1994) or cardiac gating (Skare and Andersson, 2001, Dietrich et al., 2000), these techniques are generally not employed due to added complexity in the acquisition and a longer scan time. In the absence of these techniques, and especially in the severe cases such as non-sedated pediatric subjects or subjects with tremor, rejection of selected diffusion weighted images corrupted by motion is often preformed as a post-processing step before estimating the tensor. The rejection can be done by discarding the entire “volumes” (certain diffusion directions) of diffusion-weighted images (Jiang et al., 2009, Tymofiyeva et al., 2013), or by automatic exclusion of outliers during the tensor estimation (Chang et al., 2005). However, the consequence of rejecting diffusion-weighted images has not yet been carefully considered. In this study, we investigated the effect of discarding one or more sets of diffusion weighted images on the final results by analyzing the changes in the parameters such as FA, MD, AD, RD and V1. Both accuracy and precision of these parameters were evaluated for various diffusion rejection schemes as described in Methods section.
2. Methods
The study was approved by the Committee on Human Research (CHR) of the University of California, San Francisco. Written informed consent was obtained from all participants.
Six healthy adults (right-handed, aged between 24 and 31, all female) were scanned on a 3T GE MR scanner using the most common clinically used, spin echo (SE) echo planar imaging (EPI) DTI sequence with TR/TE=17 s/90 ms, FOV=25.6 cm×25.6 cm, 128×128 matrix, slice thickness of 2 mm, 30 directions using Jones30 scheme as shown in Table 1 (Jones et al., 1999) with b=1000 s/mm2. Sixty-six contiguous slices were acquired to cover the entire brain. One b0 volume was acquired. The total scan time was about 9 minutes.
Table 1.
Jones30 gradient scheme
| Index | Gx | Gy | Gz |
|---|---|---|---|
| 1 | 0 | 1 | 0 |
| 2 | 0.986 | 0.166 | 0 |
| 3 | 0.664 | −0.11 | 0.74 |
| 4 | −0.419 | 0.901 | −0.11 |
| 5 | −0.601 | −0.169 | 0.781 |
| 6 | −0.386 | −0.815 | 0.433 |
| 7 | 0.366 | 0.656 | 0.66 |
| 8 | 0.8 | 0.582 | 0.143 |
| 9 | 0.259 | 0.9 | 0.35 |
| 10 | −0.698 | 0.693 | 0.178 |
| 11 | −0.924 | 0.357 | −0.14 |
| 12 | −0.488 | 0.543 | −0.683 |
| 13 | −0.396 | −0.525 | 0.753 |
| 14 | 0.689 | −0.639 | 0.341 |
| 15 | −0.013 | −0.33 | −0.944 |
| 16 | −0.783 | −0.524 | 0.335 |
| 17 | −0.065 | 0.609 | −0.791 |
| 18 | −0.233 | 0.22 | −0.947 |
| 19 | −0.91 | −0.004 | −0.415 |
| 20 | 0.627 | −0.511 | −0.589 |
| 21 | 0.737 | 0.414 | 0.535 |
| 22 | 0.139 | −0.679 | −0.721 |
| 23 | −0.296 | 0.884 | 0.362 |
| 24 | 0.432 | 0.262 | 0.863 |
| 25 | 0.185 | 0.088 | −0.979 |
| 26 | −0.907 | 0.294 | 0.302 |
| 27 | −0.089 | 0.887 | −0.453 |
| 28 | −0.443 | 0.257 | 0.859 |
| 29 | 0.867 | 0.086 | −0.491 |
| 30 | 0.504 | 0.863 | −0.025 |
Each diffusion volume was co-registered with the b0 volume using the FSL eddy-correct tool (Smith et al., 2004) and structures outside the brain were removed using BET tool (Smith, 2002). Diffusion tensor parameters were estimated using dtifit function from FSL. Three rejection schemes were applied to the fully acquired set of 30 directions: random rejection, uniform rejection and clustered rejection, which are described in detail below.
2.1 Random rejection
Rejections of 1 to 24 randomly selected directions from the total of the 30 directions were performed. For each rejection, FA, MD, AD, RD and V1 maps were generated and compared with reference maps generated from all 30 volumes. The angle between the primary eigenvectors of the remaining data and the reference data at each point was calculated using:
where V1rej represents the primary eigenvector of the subsampled dataset resulting after the rejection was applied and V1ref is the primary eigenvector of the reference dataset. The calculated α was between −90° and 90°. As V1 represents the orientation and not the direction of the largest eigenvalue, angles were constrained to be non-negative. A map of α was computed voxel by voxel for each number of rejected directions.
At each level of data reduction (ranging from 1 to 24 rejected directions), 100 different sub-sampled data sets were generated by eliminating data corresponding to different directions picked at random. The mean and standard deviation of FA (FAmean, FAstd), MD (MDmean, MDstd), AD (ADmean, ADstd) and RD (RDmean, RDstd) were calculated for each voxel. In order to visualize the change in V1, the cone of uncertainty in each voxel was generated for each number of rejections (Jones, 2003), and the angle of the cone was taken at the 95% confidence level of α over the 100 iterations.
2.2 Uniform rejection
The Jones30 diffusion scheme is based on minimum potential energy of electrostatic repulsion by points on the sphere, which results uniformly distributed points on the sphere (Jones et al., 1999). Uniform rejection describes a data reduction that will result in the remaining points to be uniformly arranged on the sphere. Here we investigated 15, 20 and 24 rejections, resulting in 15, 10 and 6 remaining directions as proposed by Landman et al. (2007).
2.3 Clustered rejection
It has been demonstrated in the results that the remaining vectors evenly distributed on a sphere is the optimal rejection scheme (see Results). In contradistinction to this effect, we were also interested in the outcomes if all of the rejected directions are close to each other and concentrated in a particular angular region. Here we performed rejections of diffusion encoding directions close to one of the main axes of the MRI scanner space.
For each of the x, y and z axes, which represent the left-right (LR), anterior-posterior (AP) and superior-inferior (SI) directions respectively, we rejected 1 to 24 directions closest to the axis. For each number of rejections, we calculated FA and maps. Since the rejections are orientation dependent, but α only shows the degree of change in V1, it does not specify in which direction the change is. Therefore, we employed φ and θ to explore V1 change in the x-y plane and towards the z-axis, where φ is the angle difference between V1rej and V1ref in the x-y plane and θ is the angle difference between V1rej and V1ref towards the z-axis.
2.4 Comparison between protocols with different acquisition parameters
The accuracy and precision of DTI parameters are affected by the SNR, and the SNR depends on the diffusion acquisition parameters such as the number of b0 volumes involved in tensor estimation, b-value, and the number of diffusion directions. In order to evaluate the influence of different acquisition parameters on the effects of rejecting diffusion directions, we performed the following comparisons on FA and V1 for random rejections: (1) comparisons between one b0 volume, two b0 volumes and four b0 volumes with b=1000 s/mm2 and 30 directions, where four b0 volumes was expected to yield the best SNR theoretically by the optimal ratio of number of diffusion directions to the number of b0 volumes as about 7 to 1 (Jones et al., 1999); (2) comparisons between b=600 s/mm2, b=1000 s/mm2 and b=2000 s/mm2 with one b0 volume and 30 directions, and we expected a higher b-value would result in a lower SNR; (3) comparisons between 15 directions, 30 directions and 55 directions based on the equally distribution of points on a sphere by electrostatic repulsion (Jones et al., 1999) with one b0 volume and b=1000 s/mm2, where more directions would result in a higher angular resolution, and consequently, a higher SNR. All the other acquisition parameters were kept the same: TR/TE=17 s/90 ms (except TE=91.4 ms for b=2000 s/mm2), FOV=25.6 cm×25.6 cm, 128×128 matrix, slice thickness of 2 mm with sixty-six contiguous slices.
2.5 ROI analysis
Region of interest (ROI) analysis was performed to evaluate the effect of rejecting diffusion directions. In order to compare the effects of random rejections and uniform rejections on areas of different FA values, four ROIs were chosen on the reference FA map in the genu of corpus callosum (GENU), splenium of corpus callosum (SPL), posterior limb of the internal capsule (PLIC), and the optic radiation (OR), representing white matter regions with high, medium and low FA, respectively (Fig 1a). Gray matter regions in caudate nucleus (CN) (Fig 1b) and putamen (PU) (Fig 1a), and one cerebrospinal fluid region in the lateral ventricles (LV) (Fig 1b) were chosen as well. Each region was visually homogeneous with a fixed volume of 28mm × 8mm × 4mm. As shown in Fig 1a, GENU and SPL had high FA values in the range of 0.85, PLIC had medium FA values around 0.6, OR had low FA values around 0.4, and PU had very low FA values around 0.2. For each number of rejections, mean FA and mean α of these three ROIs after random and uniform rejections were compared with the reference images.
Fig 1.
FA and color FA map of one subject’s brain with ROIs drawn for FA and V1 analysis. Red represents left-right (LR) orientation of the primary eigenvector (V1), green represents anterior-posterior (AP) orientation, and blue represents superior-inferior (SI) orientation. (a) Genu (GENU) and splenium (SPL) of corpus callosum have FA around 0.85, posterior limb of internal capsule (PLIC) has FA around 0.6, optic radiation (OR) has FA around 0.4, and putamen (PU) has FA around 0.2. (b) Caudate nucleus (CN) and lateral ventricle (LV) in MD map. (c) Anterior limb of internal capsule (ALIC) is in AP part of internal capsule. (d) Descending corticospinal projections within corona radiata (CR) in the motor tract that runs along the SI direction.
Two additional regions, anterior limb of the internal capsule (ALIC) and descending corticospinal pathways within the coronal radiata (CR), were drawn to analyze the effects of the clustered rejections (Fig 1c and 1d). In conjunction with GENU, these ROIs cover bundles of white matter fibers orientated primarily along three orthogonal imaging directions: LR, AP and SI.
Mean and standard deviation of FA, MD, AD, RD and α for each ROI were computed among the six subjects.
3. Results
3.1 Random rejections and uniform rejections
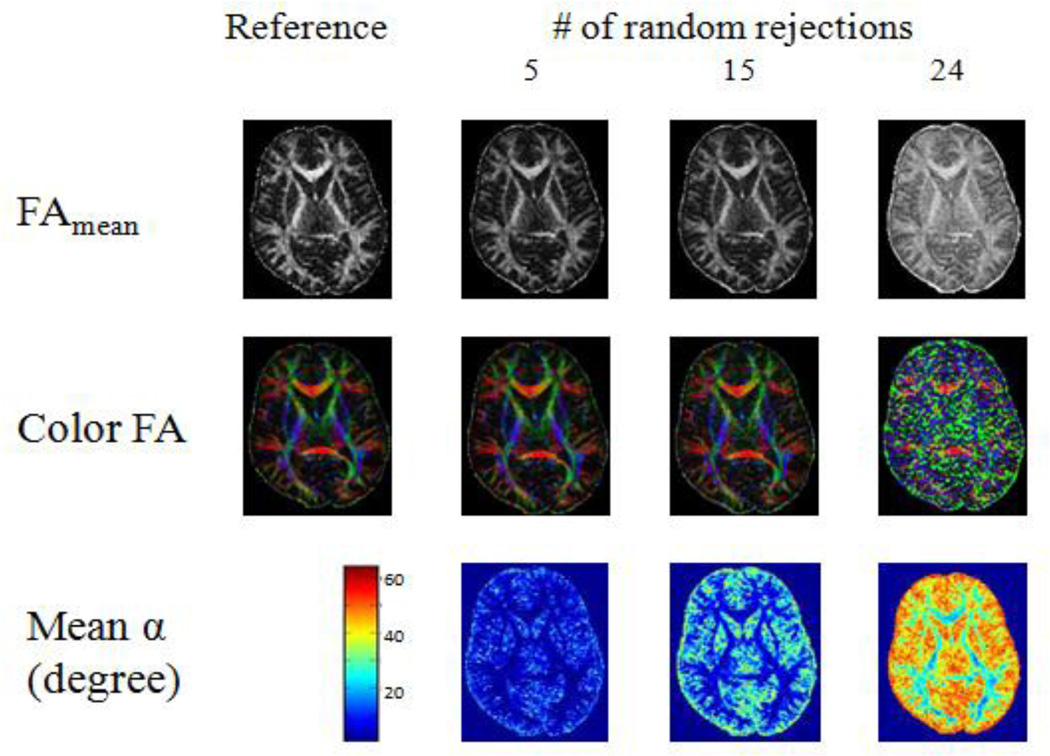
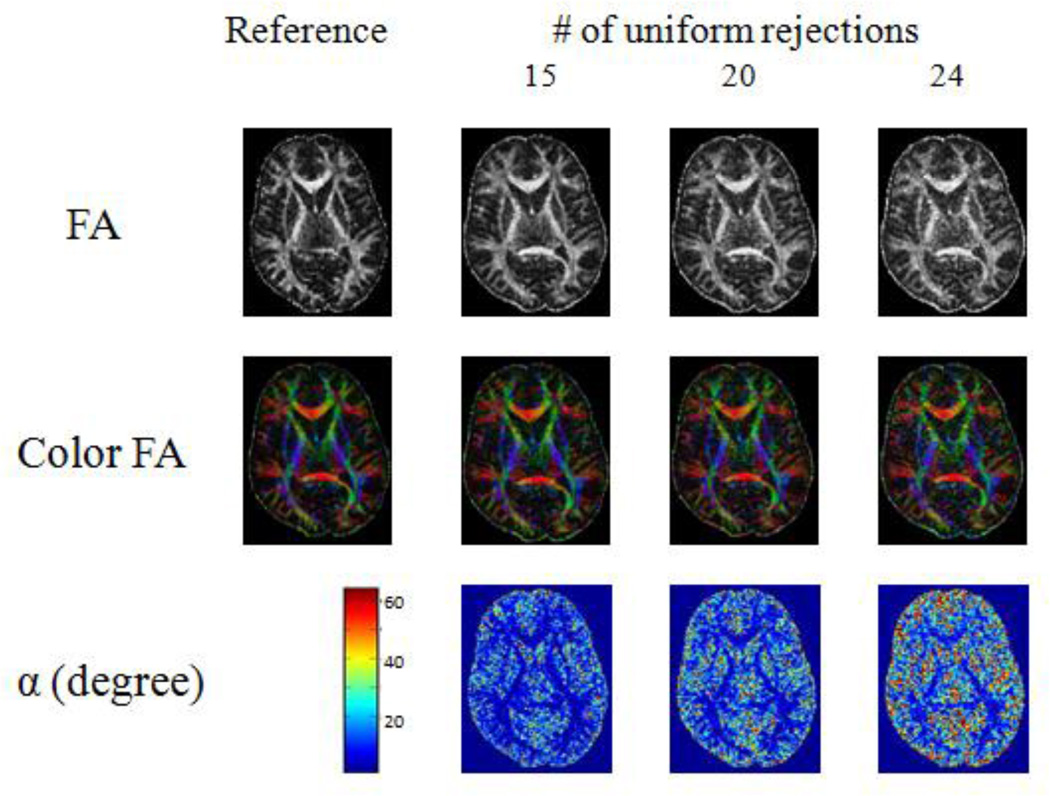
All six adults showed similar results. As the number of randomly rejected directions increased, the overestimation of both FA and V1 increased (Fig 2). Lower FA regions were affected more than the higher FA regions (Fig 2). However, very little change was observed on both FA and V1 for uniform rejections, except the low FA regions (Fig 3).
Fig 2.
FA, color FA and α maps of the same subject as in Figure 1: comparison between the reference and incomplete data after 5, 15 and 24 random rejections with the reference for one of the subjects. FAmean is the mean FA over 100 iterations. Color FA shows the color-coded FA map in one of the 100 iterations. Mean α is the mean angle change in V1 over 100 iterations.
Fig 3.
FA, color FA and α maps of the same subject as in Figure 1: comparison between the reference and incomplete data after 15, 20 and 24 uniform rejections with the reference for one of the subjects.
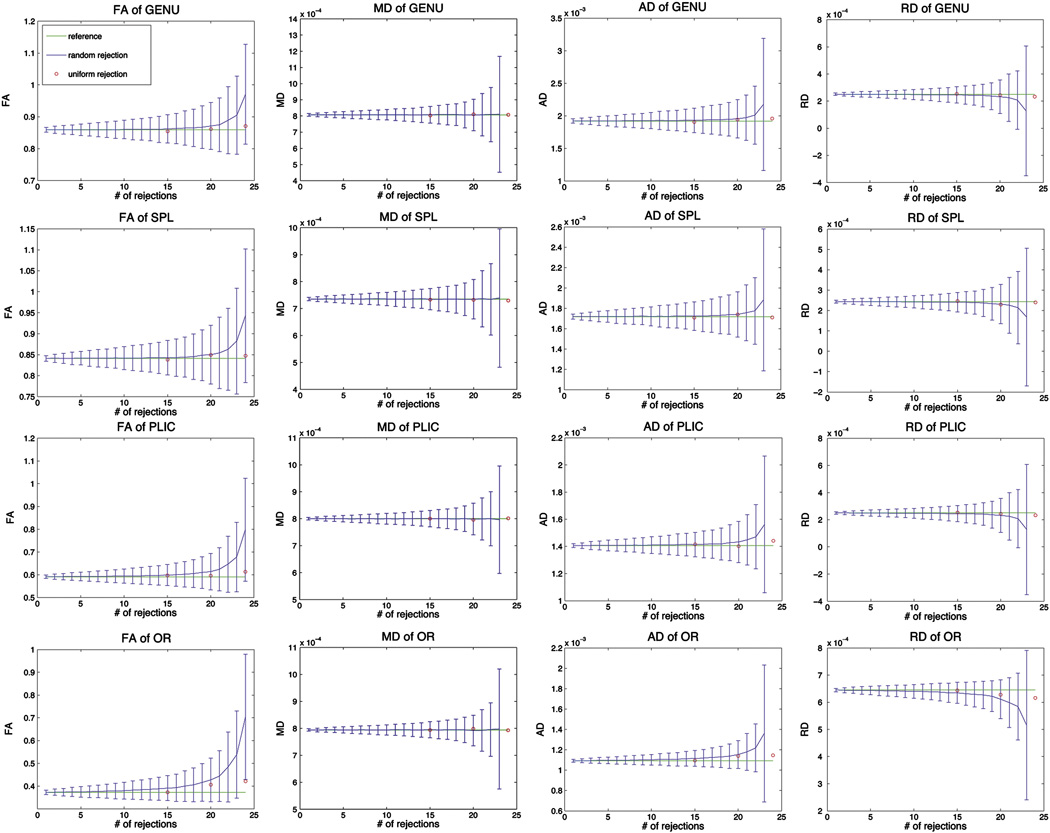
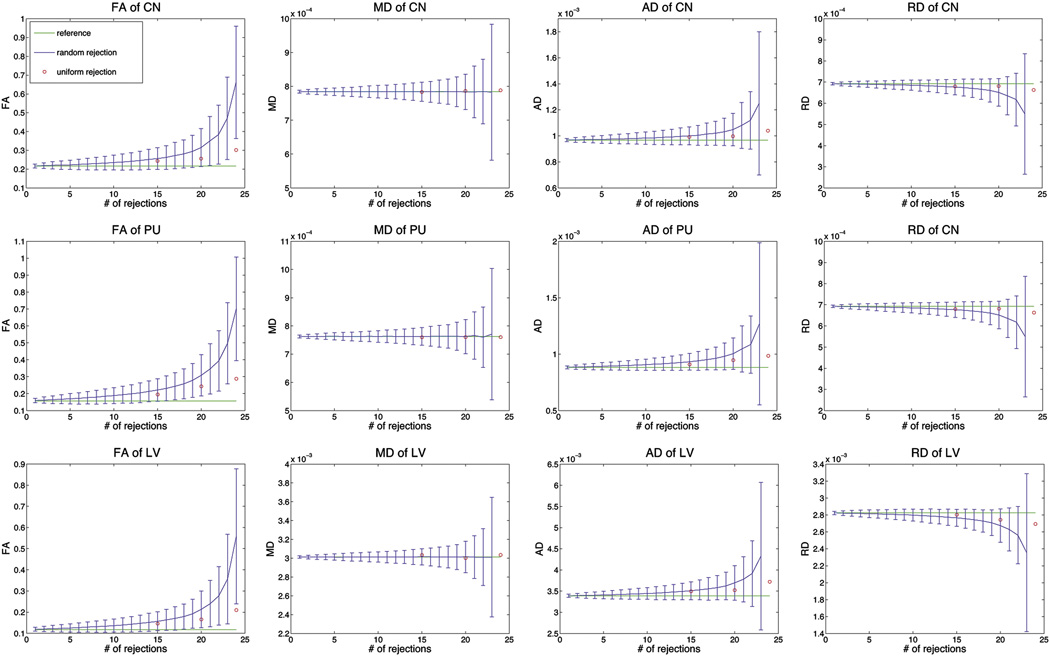
The comparison of the effects of random rejections and uniform rejections are shown in Figure 4 and Figure 5. For random rejections, not only the mean values of FA, AD and RD became more deviated from the reference values, their standard deviations also increased when the number of rejections became larger. More dramatic changes were observed in low FA regions compared to high FA regions. In general, FA and AD increased with higher number of rejections, and RD decreased with higher number of rejections. However, the mean value of MD remained unchanged regardless of the number of rejections. Its standard deviation increased with greater number of rejections. In contrary, uniform rejections caused very insignificant changes of those parameters, and the changes were again, larger in low FA regions than in high FA regions and increased with the number of rejections.
Fig 4.
Comparison of FA, MD, AD and RD between random rejections and uniform rejections for white matter regions: GENU, SPL, PLIC and OR. The mean and standard deviation of random rejections were calculated from 6 subjects for each ROI.
Fig 5.
Comparison of FA, MD, AD and RD between random rejections and uniform rejections for grey matter regions, CN and PU, and a cerebrospinal fluid region, LV. The mean and standard deviation of random rejections were calculated from 6 subjects for each ROI.
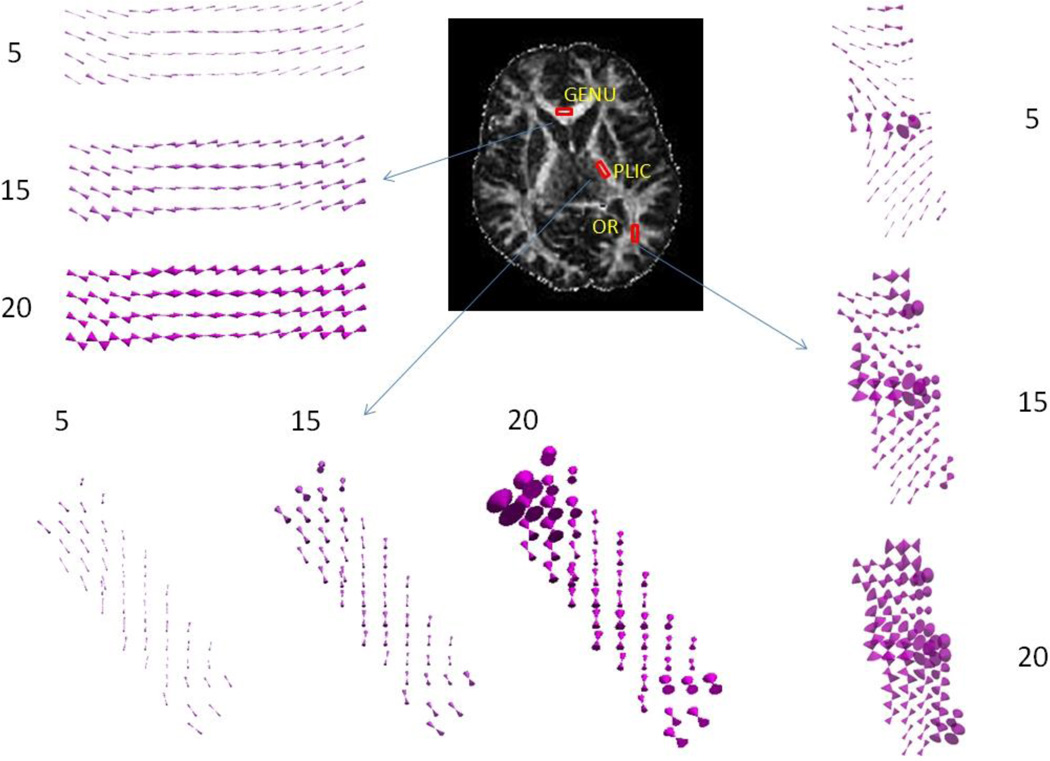
From the cones of uncertainty of GENU, PLIC and OR shown in Figure 6, one could easily observe the growing overestimation of V1 with increasing number of rejections. This effect was more dominant in low FA regions than high FA regions. Especially in OR (with FA around 0.4), one voxel showed severely ill-defined V1 even with 5 random rejections, and while 20 random rejections were performed, the changes of many voxels were depicted as almost or absolutely flat cones.
Fig 6.
Cones of uncertainty for GENU, PLIC and OR with 5, 15 and 20 number of random rejections for the same subject as in Figure 1.
3.2 Clustered rejections
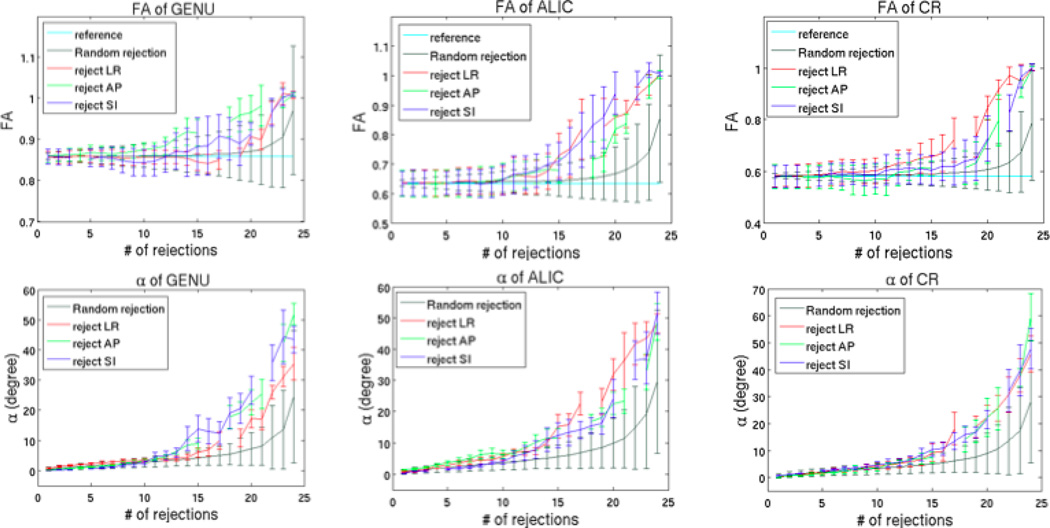
The results of clustered rejections showed the largest changes in FA and V1, comparable to the worst cases of random rejections. The comparison between random rejections and clustered rejections is presented in Figure 7, showing that the changes of both FA and V1 in the case of clustered rejections strongly deviated from the mean of random rejections, and even more from the reference.
Fig 7.
Comparison of FA and α between random rejections and clustered rejections for GENU, ALIC and CR. The mean and standard deviation are calculated from 6 subjects for each ROI.
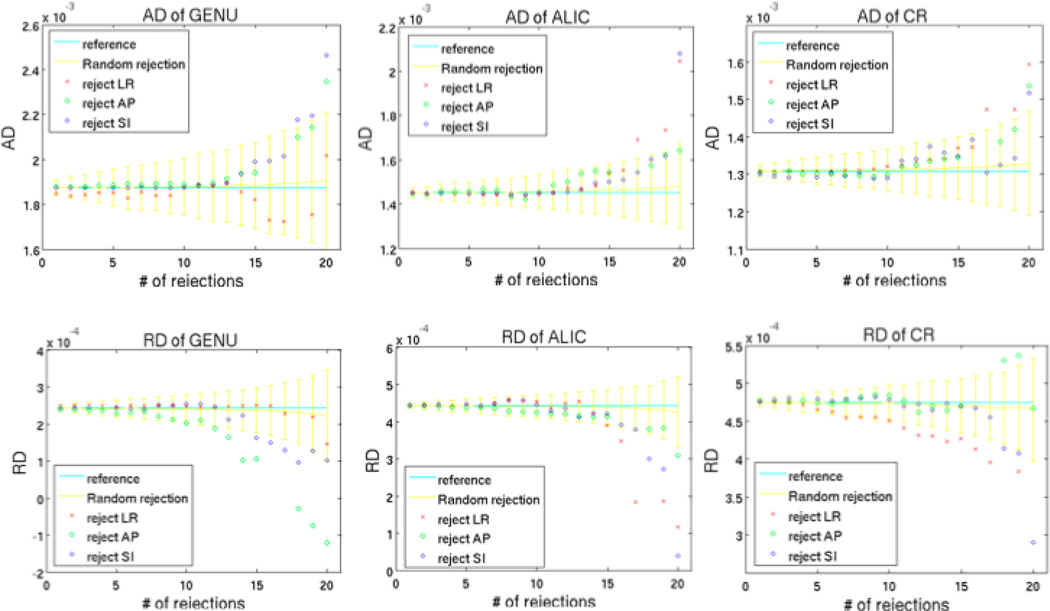
However, not all clustered rejections resulted in significant changes in AD and RD. As one can see from Figure 8, when the number of rejections was below 20, rejecting LR cluster did not cause a significant difference in AD and RD for GENU, though other clustered rejections still caused great overestimation of AD and RD for all the ROIs.
Fig 8.
Comparison of AD and RD between random rejections and clustered rejections for GENU, ALIC and CR. For each ROI, random rejections depict the mean and standard deviation from 6 subjects, and clustered rejections depict the mean from 6 subjects.
As it had been suggested that too many rejections might completely alter the tensor orientation (see Discussion) so that it becomes meaningless to evaluate the parameters (see Discussion), thus we only showed the results of φ and θ for up to 12 rejections near each of the axes for GENU, ALIC and CR in Figure 9. GENU and ALIC contain fibers predominantly oriented in LR and AP, respectively. Rejecting SI directions showed very small θ (less than 4 degree) but largest φ (Fig 9). Moreover, rejecting LR and AP showed about the same changes of θ and φ for GENU and ALIC. Although, all three clustered rejections had similar effect on the angle changes in CR (Fig 7), the changes of θ (from 0 to 25 degree) were much greater compared to GENU (from 0 to 5 degree) and ALIC (from 0 to 12 degree) (Fig 9), which means that clustered rejections deviated the resultant fiber orientations away from z-axis more in SI-oriented fibers than other fibers.
Fig 9.
φ and θ changes for V1 of GENU, ALIC and CR from 1 to 12 clustered rejections near each axis. The angle changes are calculated from the mean of the 6 subjects.
3.3 Comparison between protocols with different acquisition parameters
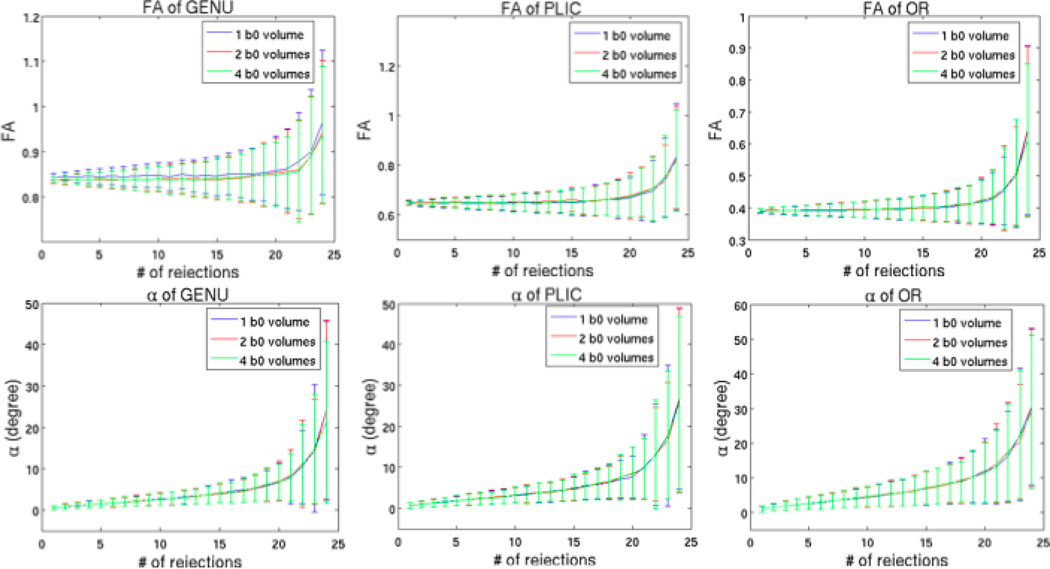
The comparison of changes in FA and V1 showed very similar results for different number of b0 volumes (Fig 10).
Fig 10.
Comparison between one, two, and four b0 volumes with b=1000 s/mm2 and 30 directions.
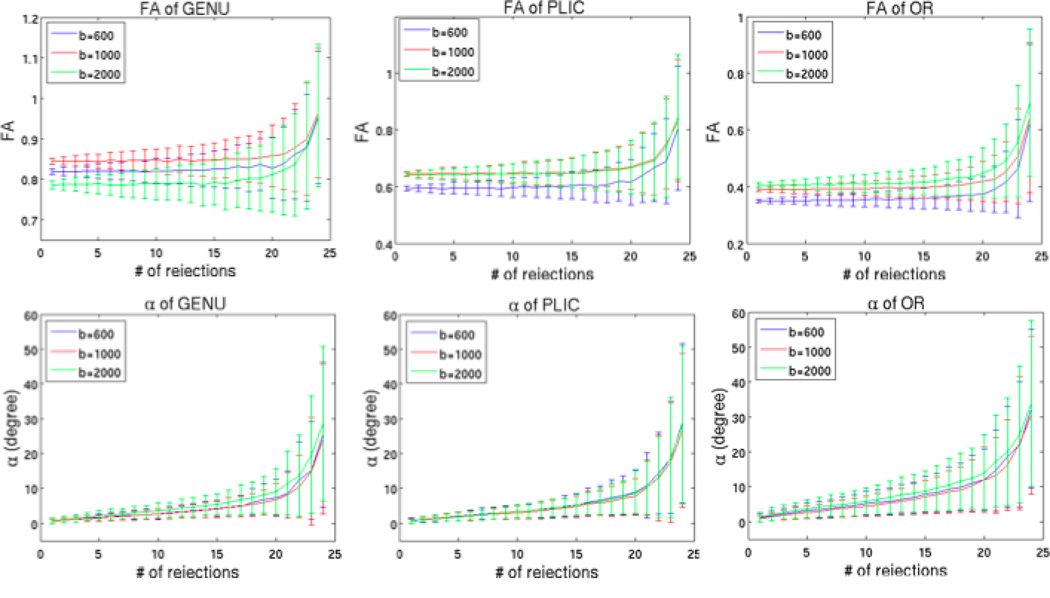
With Figure 11, we observed that the mean values of FA differed for different b-values, though the differences were small. Not much difference in standard deviations of FA was observed. Different b-values did not result in any significant difference in the change in V1.
Fig 11.
Comparison between b=600 s/mm2, b=1000 s/mm2 and b=2000 s/mm2 with one b0 volume and 30 directions.
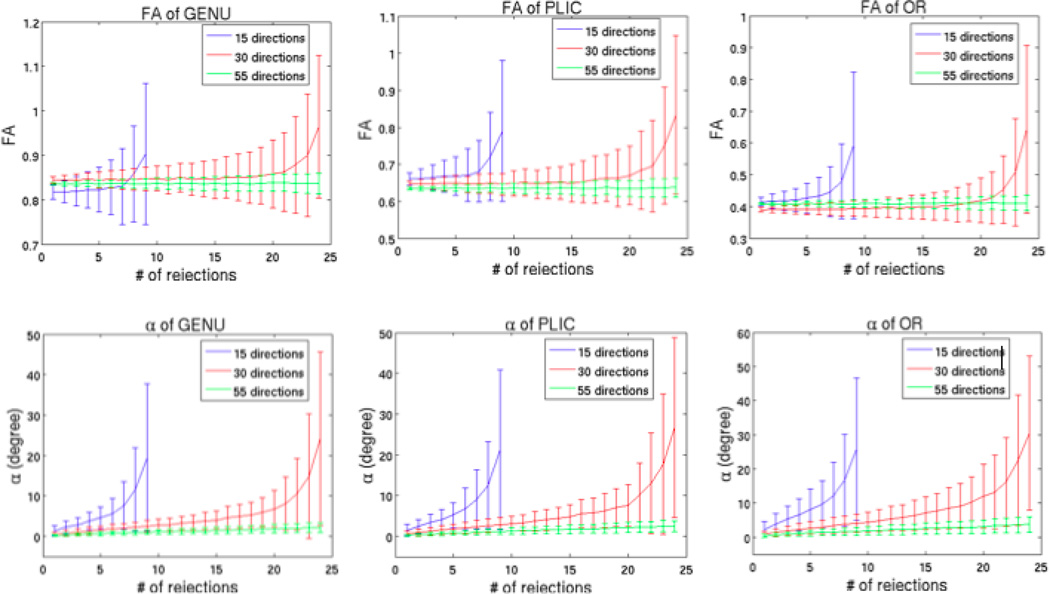
Figure 12 demonstrates that the total number of the acquired diffusion directions had a great influence on FA and V1. As more directions are acquired, the values of FA and V1 would become more consistent, with the same number of rejections. The values of FA and V1 became highly variable with the increasing number of rejections in the 15-direction case; on the other hand, very little change was observed in FA and V1 in the 55-direction case, even up to 24 rejections. If one looks at the changes in FA and V1 in terms of the number of the remaining directions instead of the number of the rejected directions, the results demonstrated consistency. Thus, for example, the results for the 15-directions case are systematically shifted 15 directions to the left compared to the 30-directions case (Fig 12).
Fig 12.
Comparison between 15 directions, 30 directions and 55 directions based on the equally distribution of points on a sphere by electrostatic repulsion (Jones et al., 1999) with one b0 volume and b=1000 s/mm2.
4. Discussion
It is important to understand the consequences of rejecting diffusion images for a more consistent analysis of tissue properties, such as water diffusivity, anisotropy and connectivity. In this study, we investigated the effects of discarding one or more diffusion directions on FA, MD, AD, RD and V1.
There are several approaches to rejection of diffusion data. One can review images directly and reject the volumes with corrupted images. This is manually intensive but results in accurate rejection. Another way is an automated rejection by voxel-wise analysis (Tymofiyeva et al., 2013). When a certain number of pixels deviate from the corresponding mean pixel value for all diffusion directions by three standard deviations, the direction might be excluded from the tensor calculation. This threshold for the number of pixels deviating from the mean was set empirically, and depended upon the head size. Robust estimation of tensors by outlier rejection (RESTORE) has been proposed to reject the outliers during tensor estimation (Chang et al., 2005). Instead of rejecting the entire volume, this technique only rejects the outliers among all diffusion directions in each voxel. Thus, each voxel may end up with different diffusion directions included in the tensor estimation.
Our results demonstrated that an accurate estimation of the mean diffusivity could be consistently obtained with relatively small number of diffusion remaining directions.
From the results of random rejections (Fig 4 & Fig 5), one could easily observe that the overestimations of FA, AD and RD got larger with increasing number of rejections. This is mainly due to the decreased signal-to-noise ratio (SNR) resulting from a smaller number of diffusion directions included in the tensor estimation. Therefore the mean FA, AD and RD was more deviated from the reference values and the uncertainties in FA, AD and RD (as seen from standard deviations) were greater with less remaining diffusion directions (Fig 4 & Fig 5). Since the mean value of MD remains consistent with the reference and the standard deviation was very small, one could possible infer that the change in MD was very insignificant, especially when the number of rejections was below 15 for the 30-direction acquisition.
The changes in FA, MD, AD and RD were also consistently correlated with each other. Generally increasing AD and decreasing RD with greater number of rejections (Fig 4 & Fig 5) would result an overall unchanged in MD. Furthermore, increasing AD and decreasing RD would cause the tensor to be more elongated, or more anisotropic, which corresponds to greater FA, and this coincided with our results as well.
In the case of uniform data reductions, changes in FA were only observed in low FA regions (Fig 3). This effect is not specific to the uniform rejection scheme and was also observed in lower FA regions for random rejections, as one can see from the comparison among GENU, PLIC and OR (Fig 4). Since the lower FA regions are more isotropic than the higher FA regions, the tensors can be depicted as more round-shaped in lower FA regions (the three eigenvalues are similar to each other). Any change in the estimation of a round-shaped tensor will result in a stronger influence on the orientation than of an oval-shaped tensor, because the eigenvectors of a round-shaped tensor can be easily interchanged (Basser et al., 1994).
In contradistinction to the uniform rejection, the results of the clustered rejection were strongly overestimated. This demonstrates that more uniformly distributed rejections lead to smaller overestimations of the tensor-derived parameters. Conversely, the closer they are to each other (clustered), the larger the overestimations. Based on the results of the clustered rejections, one could suggest that the angle changes in V1 depend on the orientation of the rejected diffusion directions with respect to the orientation of the underlying white matter fiber (Fig 9). This further demonstrates the importance of uniformly distributed diffusion directions to the accuracy of tensor estimation, which also confirms with previous reports (Batchelor et al., 2003, Hasan and Narayana, 2003).
Among the general trend with strongly overestimated results for clustered rejections, an exemption one could observe from Figure 8 was that rejecting LR directions did not cause a significant change in AD and RD of GENU when the number of rejections is less than 20. As GENU is oriented in LR, one might interpret it as follows: rejecting directions that were parallel to the underlying fibers in the ROI would result little change in AD and RD. However, our results of clustered rejections for ALIC and CR did not show the same effect, except that rejecting an SI cluster (which was parallel to CR) had less effect on AD of CR than other clusters. This might be due to the fact that ALIC and CR had lower FA than GENU, and SNR plays greater influence on lower FA regions than higher ones, which makes changes in the former less predictable or stable. In addition, the alignment of the underlying fibers can be more variable in those regions. Applying gradient parallel to the orientation of highly anisotropic regions would result very little alteration in the overall direction of water molecules’ flow. This explains why rejecting directions that were parallel to the underlying fibers in GENU would result little change in AD and RD, but it was not the case for other less anisotropic regions.
Whereas the scalar values of FA are often regarded as a marker for white matter integrity, V1 is usually used for tractography. Any change in those values would alter the results of investigation of the brain characteristics. It would complicate the interpretation of changes in FA values since they may increase or decrease unpredictably after diffusion direction rejection. Any shift in the orientation of V1 may completely redirect the streamline pathways, which would make the final result of tractography meaningless. Hence, when diffusion rejections are required before tensor estimation, it is important to access the number of rejections and where on the sphere the rejected diffusion directions were located, in order to account for the accuracy of the evaluation.
One thing noticeable in Fig 4 is that for uniform rejections, very little change in FA, AD and RD was observed, even with only 6 remaining directions in low FA region. Therefore, it is recommended to access the locations of the corrupted directions before proceeding to tensor estimation. If they are distributed relatively uniformly, rejecting those directions may not increase uncertainty in parameter estimation; if a few directions are grouped in one location, one may consider rejecting more directions to make the remaining ones more uniform, thus maintaining the accuracy of the tensor-derived parameters. However, reducing the number of diffusion directions will decrease SNR in the reconstructed diffusion tensor images, and consequently, affect the accuracy of the parameters. Such trade-off should be considered depending on SNR of the acquired diffusion weighted images. From our results with reasonable clinical scan parameters, in case of evaluating scalar values such as FA and diffusivities, rejecting until only six uniformly distributed directions remaining still provided relatively valid results. As one can see from Figure 4, if the number of rejections is less than 10, it is not necessary to reject more directions to achieve six uniform directions. While the number of rejections is more than 10, unless the remaining directions are approximately uniform, we suggest rejecting until six uniform directions remaining in order to make a more precise measurement. However, in the extreme case that a few directions are close to each other so that it is impossible to achieve uniform distribution, one may consider to exclude the whole data set for further analysis since the results from such highly corrupted data will be quite inaccurate.
We have also investigated the influence of diffusion acquisition parameters on the effects of diffusion rejections. The number of b0 volumes did not cause any significant difference in the changes of FA and V1 (Fig 10). Thus, in order to shorten the total scan time to avoid any additional motion, one b0 volume is suggested in clinical settings for patients with uncontrolled motions (unless additional b0 volumes are deliberately used for the purposes of motion correction). Higher b-values reduce the SNR and we expected the changes of FA and V1 to be more sensitive to rejections. Our results showed that different b-values caused differences in the mean FA, but not in the mean V1 changes (Fig 11). Whereas the accuracy of FA depended on the b-value, the standard deviations of FA were not significantly different, which indicates that the precision of FA after rejection was similar for different b-values. Figure 12 demonstrates that the accuracy and precision of FA and V1 are dependent on the number of the remaining diffusion directions, which is the difference between the number of the acquired and rejected directions. This is consistent with the previously proposed theoretical framework (Hasan, 2007), as the more diffusion directions remained, the higher SNR of the derived diffusion parameters (proportional to the square root of the number of diffusion directions). However, if more directions are initially acquired, there are more possibilities to reject corrupted directions and still maintain the overall equal distribution of the remaining directions, which would lead to more stable estimations of the tensor-derived parameters. On the other hand, since more motion is expected if the subject is in the scanner for a longer time, it might not very efficient to acquired more than 30 diffusion weighted images and then reject more directions afterwards. To summarize our results, the changes of tensor-derived parameters were predominantly defined by the number of remaining diffusion directions and by their location, both, with respect to a uniform distribution on a unit sphere and the underlying tissue orientation.
In this study, we only evaluated the effects of rejecting diffusion directions on the second-order diffusions tensor, which is the most commonly used simplified model in diffusion imaging. DTI assumes Gaussian diffusion of water, which is not a realistic assumption in human tissues. It only represents the averaged result per voxel, and any intra-voxel information cannot be retrieved. Other techniques such as q-ball imaging (Tuch, 2004), spherical deconvolution (Tournier et al., 2004), generalized diffusion tensor (Liu et al., 2004), and diffusion spectrum imaging (Wedeen et al., 2005), can potentially resolve sub-voxel information such as crossing fibers. New parameters have been proposed along with these higher-order models to describe anisotropy and fiber orientation, such as fractional multi fiber index (Frank, 2002), and fiber orientation distribution function (Tuch et al., 2005, Hess et al., 2006), respectively. Effects of rejecting diffusion directions on these parameters might be different from the second-order tensor parameters, especially in low FA regions. Low FA regions can result either from an isotropic underlying microstructure or from numerous crossing fibers. Since DTI cannot differentiate these two types of low FA regions, rejecting diffusion directions will show similar consequences in both cases. However, if higher-order models are used to reveal more sophisticated tensor glyphs, rejecting diffusion directions might only affect some of the components but not alter the overall anisotropy or directionality. Thus, if any other methods are applied beyond DTI, a more complex analysis should be considered to evaluate the effects of rejecting diffusion directions.
Highlights.
Precision and accuracy of FA, AD, RD and V1 decrease with more rejections.
High FA regions are influenced less than low FA regions by rejections.
Rejecting directions close in proximity result in poor diffusion parameters.
Changes in DTI parameters depend on fiber orientation and rejected directions.
Acquisition parameters affect SNR and change DTI parameters after rejection.
Acknowledgement
This study is supported by NIH R01EB009756, R01HD072074 and P01NS082330
Footnotes
Publisher's Disclaimer: This is a PDF file of an unedited manuscript that has been accepted for publication. As a service to our customers we are providing this early version of the manuscript. The manuscript will undergo copyediting, typesetting, and review of the resulting proof before it is published in its final citable form. Please note that during the production process errors may be discovered which could affect the content, and all legal disclaimers that apply to the journal pertain.
Reference
- Assaf Y, Pasternak O. Diffusion tensor imaging (DTI)-based white matter mapping in brain research: a review. J Mol Neurosci. 2008;34:51–61. doi: 10.1007/s12031-007-0029-0. [DOI] [PubMed] [Google Scholar]
- Barkovich AJ, Westmark KD, Bedi HS, Partridge JC, Ferriero DM, Vigneron DB. Proton spectroscopy and diffusion imaging on the first day of life after perinatal asphyxia: preliminary report. AJNR Am J Neuroradiol. 2001;22:1786–1794. [PMC free article] [PubMed] [Google Scholar]
- Basser PJ, Mattiello J, Lebihan D. MR diffusion tensor spectroscopy and imaging. Biophys J. 1994;66:259–267. doi: 10.1016/S0006-3495(94)80775-1. [DOI] [PMC free article] [PubMed] [Google Scholar]
- Basser PJ, Pajevic S, Pierpaoli C, Duda J, Aldroubi A. In vivo fiber tractography using DTMRI data. Magn Reson Med. 2000;44:625–632. doi: 10.1002/1522-2594(200010)44:4<625::aid-mrm17>3.0.co;2-o. [DOI] [PubMed] [Google Scholar]
- Batchelor PG, Atkinson D, Hill DL, Calamante F, Connelly A. Anisotropic noise propagation in diffusion tensor MRI sampling schemes. Magn Reson Med. 2003;49:1143–1151. doi: 10.1002/mrm.10491. [DOI] [PubMed] [Google Scholar]
- Chang LC, Jones DK, Pierpaoli C. RESTORE: robust estimation of tensors by outlier rejection. Magn Reson Med. 2005;53:1088–1095. doi: 10.1002/mrm.20426. [DOI] [PubMed] [Google Scholar]
- Counsell SJ, Allsop JM, Harrison MC, Larkman DJ, Kennea NL, Kapellou O, Cowan FM, Hajnal JV, Edwards AD, Rutherford MA. Diffusion-weighted imaging of the brain in preterm infants with focal and diffuse white matter abnormality. Pediatrics. 2003;112:1–7. doi: 10.1542/peds.112.1.1. [DOI] [PubMed] [Google Scholar]
- Dietrich O, Heiland S, Benner T, Sartor K. Reducing motion artefacts in diffusion-weighted MRI of the brain: efficacy of navigator echo correction and pulse triggering. Neuroradiology. 2000;42:85–91. doi: 10.1007/s002340050020. [DOI] [PubMed] [Google Scholar]
- Frank LR. Characterization of anisotropy in high angular resolution diffusion-weighted MRI. Magn Reson Med. 2002;47:1083–1099. doi: 10.1002/mrm.10156. [DOI] [PubMed] [Google Scholar]
- Hasan KM. A framework for quality control and parameter optimization in diffusion tensor imaging: theoretical analysis and validation. Magn Reson Imaging. 2007;25:1196–1202. doi: 10.1016/j.mri.2007.02.011. [DOI] [PMC free article] [PubMed] [Google Scholar]
- Hasan KM, Narayana PA. Computation of the fractional anisotropy and mean diffusivity maps without tensor decoding and diagonalization: Theoretical analysis and validation. Magn Reson Med. 2003;50:589–598. doi: 10.1002/mrm.10552. [DOI] [PubMed] [Google Scholar]
- Hasan KM, Parker DL, Alexander AL. Comparison of gradient encoding schemes for diffusion-tensor MRI. J Magn Reson Imaging. 2001;13:769–780. doi: 10.1002/jmri.1107. [DOI] [PubMed] [Google Scholar]
- Hess CP, Mukherjee P, Han ET, Xu D, Vigneron DB. Q-ball reconstruction of multimodal fiber orientations using the spherical harmonic basis. Magn Reson Med. 2006;56:104–117. doi: 10.1002/mrm.20931. [DOI] [PubMed] [Google Scholar]
- Jiang S, Xue H, Counsell S, Anjari M, Allsop J, Rutherford M, Rueckert D, Hajnal JV. Diffusion tensor imaging (DTI) of the brain in moving subjects: application to in-utero fetal and exutero studies. Magn Reson Med. 2009;62:645–655. doi: 10.1002/mrm.22032. [DOI] [PubMed] [Google Scholar]
- Jones DK. Determining and visualizing uncertainty in estimates of fiber orientation from diffusion tensor MRI. Magn Reson Med. 2003;49:7–12. doi: 10.1002/mrm.10331. [DOI] [PubMed] [Google Scholar]
- Jones DK, Horsfield MA, Simmons A. Optimal strategies for measuring diffusion in anisotropic systems by magnetic resonance imaging. Magn Reson Med. 1999;42:515–525. [PubMed] [Google Scholar]
- Kraus MF, Susmaras T, Caughlin BP, Walker CJ, Sweeney JA, Little DM. White matter integrity and cognition in chronic traumatic brain injury: a diffusion tensor imaging study. Brain. 2007;130:2508–2519. doi: 10.1093/brain/awm216. [DOI] [PubMed] [Google Scholar]
- Landman BA, Farrell JA, Jones CK, Smith SA, Prince JL, Mori S. Effects of diffusion weighting schemes on the reproducibility of DTI-derived fractional anisotropy, mean diffusivity, and principal eigenvector measurements at 1.5T. Neuroimage. 2007;36:1123–1138. doi: 10.1016/j.neuroimage.2007.02.056. [DOI] [PMC free article] [PubMed] [Google Scholar]
- Lipton ML, Gellella E, Lo C, Gold T, Ardekani BA, Shifteh K, Bello JA, Branch CA. Multifocal white matter ultrastructural abnormalities in mild traumatic brain injury with cognitive disability: a voxel-wise analysis of diffusion tensor imaging. J Neurotrauma. 2008;25:1335–1342. doi: 10.1089/neu.2008.0547. [DOI] [PubMed] [Google Scholar]
- Liu C, Bammer R, Acar B, Moseley ME. Characterizing non-Gaussian diffusion by using generalized diffusion tensors. Magn Reson Med. 2004;51:924–937. doi: 10.1002/mrm.20071. [DOI] [PubMed] [Google Scholar]
- Lu S, Ahn D, Johnson G, Cha S. Peritumoral diffusion tensor imaging of high-grade gliomas and metastatic brain tumors. AJNR Am J Neuroradiol. 2003;24:937–941. [PMC free article] [PubMed] [Google Scholar]
- Mori S, Van Zijl PC. Fiber tracking: principles and strategies - a technical review. NMR Biomed. 2002;15:468–480. doi: 10.1002/nbm.781. [DOI] [PubMed] [Google Scholar]
- Ordidge RJ, Helpern JA, Qing ZX, Knight RA, Nagesh V. Correction of motional artifacts in diffusion-weighted MR images using navigator echoes. Magn Reson Imaging. 1994;12:455–460. doi: 10.1016/0730-725x(94)92539-9. [DOI] [PubMed] [Google Scholar]
- Papadakis NG, Murrills CD, Hall LD, Huang CL, Adrian Carpenter T. Minimal gradient encoding for robust estimation of diffusion anisotropy. Magn Reson Imaging. 2000;18:671–679. doi: 10.1016/s0730-725x(00)00151-x. [DOI] [PubMed] [Google Scholar]
- Rose SE, Chen F, Chalk JB, Zelaya FO, Strugnell WE, Benson M, Semple J, Doddrell DM. Loss of connectivity in Alzheimer's disease: an evaluation of white matter tract integrity with colour coded MR diffusion tensor imaging. J Neurol Neurosurg Psychiatry. 2000;69:528–530. doi: 10.1136/jnnp.69.4.528. [DOI] [PMC free article] [PubMed] [Google Scholar]
- Skare S, Andersson JL. On the effects of gating in diffusion imaging of the brain using single shot EPI. Magn Reson Imaging. 2001;19:1125–1128. doi: 10.1016/s0730-725x(01)00415-5. [DOI] [PubMed] [Google Scholar]
- Skare S, Hedehus M, Moseley ME, Li TQ. Condition number as a measure of noise performance of diffusion tensor data acquisition schemes with MRI. J Magn Reson. 2000;147:340–352. doi: 10.1006/jmre.2000.2209. [DOI] [PubMed] [Google Scholar]
- Smith SM. Fast robust automated brain extraction. Hum Brain Mapp. 2002;17:143–155. doi: 10.1002/hbm.10062. [DOI] [PMC free article] [PubMed] [Google Scholar]
- Smith SM, Jenkinson M, Woolrich MW, Beckmann CF, Behrens TE, Johansen-Berg H, Bannister PR, De Luca M, Drobnjak I, Flitney DE, Niazy RK, Saunders J, Vickers J, Zhang Y, De Stefano N, Brady JM, Matthews PM. Advances in functional and structural MR image analysis and implementation as FSL. Neuroimage. 2004;23(Suppl 1):S208–S219. doi: 10.1016/j.neuroimage.2004.07.051. [DOI] [PubMed] [Google Scholar]
- Tournier JD, Calamante F, Gadian DG, Connelly A. Direct estimation of the fiber orientation density function from diffusion-weighted MRI data using spherical deconvolution. Neuroimage. 2004;23:1176–1185. doi: 10.1016/j.neuroimage.2004.07.037. [DOI] [PubMed] [Google Scholar]
- Tuch DS. Q-ball imaging. Magn Reson Med. 2004;52:1358–1372. doi: 10.1002/mrm.20279. [DOI] [PubMed] [Google Scholar]
- Tuch DS, Wisco JJ, Khachaturian MH, Ekstrom LB, Kotter R, Vanduffel W. Q-ball imaging of macaque white matter architecture. Philos Trans R Soc Lond B Biol Sci. 2005;360:869–879. doi: 10.1098/rstb.2005.1651. [DOI] [PMC free article] [PubMed] [Google Scholar]
- Tymofiyeva O, Hess CP, Ziv E, Lee PN, Glass HC, Ferriero DM, Barkovich AJ, Xu D. A DTI-based template-free cortical connectome study of brain maturation. PLoS One. 2013;8:e63310. doi: 10.1371/journal.pone.0063310. [DOI] [PMC free article] [PubMed] [Google Scholar]
- Wedeen VJ, Hagmann P, Tseng WY, Reese TG, Weisskoff RM. Mapping complex tissue architecture with diffusion spectrum magnetic resonance imaging. Magn Reson Med. 2005;54:1377–1386. doi: 10.1002/mrm.20642. [DOI] [PubMed] [Google Scholar]


