

Abstract
Purpose
To harmonize data acquisition and post-processing of single voxel proton magnetic resonance spectroscopy (1H-MRS) at 7 Tesla (7T), and to determine metabolite concentrations, accuracy and reproducibility of metabolite levels in the adult human brain.
Experimental
This study was performed in compliance with local Institutional Human Ethics Committees. The same seven subjects were each examined twice using four different 7T MR-systems from two different vendors using an identical semi-LASER spectroscopy sequence. Neurochemical profiles were obtained from the posterior cingulate cortex (GM) and the corona radiata (WM). Spectra were analyzed with LCModel, and sources of variation in concentrations (‘subject’, ‘institute’ & ‘random’) were identified with a variance components analysis.
Results
Concentrations of 10-11 metabolites, which were corrected for T1, T2, Magnetization Transfer-effects and partial volume effects, were obtained with mean Cramér-Rao Lower Bounds below 20%. Data variances and mean concentrations in GM and WM were comparable for all institutions. The primary source of variance for glutamate, myo-inositol, scyllo-inositol, total creatine and total choline was between-subjects. Variance sources for all other metabolites were associated to within-subject and system noise, except for total N-acetylaspartate, glutamine and glutathione, which related to differences in signal-to-noise and in shimming performance between vendors.
Conclusion
After multi-center harmonization of acquisition and post-processing protocols, metabolite concentrations and size and sources of their variations were established for neurochemical profiles in the healthy brain at 7T, which can be used as guidance in future studies quantifying metabolite and neurotransmitter concentrations with 1H-MRS at ultra-high magnetic field.
Keywords: Test-retest, reproducibility, Ultra-high field strength, magnetic resonance spectroscopy, 7 tesla, semi-LASER, neurochemical profiling
Introduction
For many years, proton magnetic resonance spectroscopy (1H-MRS) has been a promising tool for non-invasive assessment of the distribution of neurochemicals in the human brain. It has developed into a clinic-ready technique which, if used correctly, can contribute to patient management in brain tumors, neonatal and pediatric disorders, demyelinating disorders, and infectious brain lesions (1). Furthermore, monitoring brain neurochemistry provides comprehensive information on energy metabolism, neurotransmission, myelination, membrane metabolism, antioxidant and osmotic status (2), which could be provided by ultra-high field (UHF) systems (≥7 Tesla (T)). The gain in intrinsic signal-to-noise ratio (SNR) (3) provided by these systems enables reliable metabolite quantification as a result of the increased spectral dispersion (4), even in small voxels (<5ml) located in deep brain structures such as the substantia nigra (5). Additionally, short echo time (TE) MRS sequences at UHF have shown promise for detection of the inhibitory neurotransmitter γ-aminobutyric acid (GABA) (6).
A magnetic field strength of 7T imposes additional challenges over clinical field strengths for performing MRS examinations. Accurate voxel selection of the full spectral range of neurochemicals with limited available radio frequency (RF) power and at short TE is cumbersome, but can be achieved with the semi-LASER (partial localization by adiabatic selective refocusing) technique. It was first introduced in spectroscopic imaging mode (7), and shown to be reliable and reproducible at 3T (8). Additional technical adjustments (improved water suppression, phase cycling and outer volume suppression) enabled a successful single voxel implementation of the technique (9) with excellent 2-site reproducibility at 3T (10). The sequence was further demonstrated to perform better than other available spin- and stimulated-echo techniques for single voxel MRS at 7T (11).
An important impediment to widespread use of 1H-MRS is the lack of harmonization of acquisition and post-processing protocols between different MR-system vendors (1). Different pulse sequences on MR units from different vendors result in biases in quantitative MRS results from different sites. Identical MRS protocols at different sites would allow reference measurements for concentrations and corresponding standard deviations of neurochemicals. Therefore, the aim of this study was to harmonize data acquisition and post-processing of short TE single voxel 1H-MRS using the semi-LASER sequence at 7T across two different vendors, and to determine metabolite concentrations, accuracy and reproducibility in metabolite levels in the adult human brain by examining the same subjects twice at four different institutions.
Experimental
This multicenter study was performed in compliance with the regulations of the local institutional Human Ethics Committees. Seven healthy volunteers were scanned twice at each site after giving written informed consent. The time between scan and re-scan was at least one hour and was at maximum four days. The mean ± standard deviation (SD) age of the volunteers was 33 ± 5 years (6 males).
Institutions and hardware
Data were acquired using passively shielded 7T whole body magnets manufactured by Magnex, equipped with an MR console from either Philips (Philips Achiva 7T, Philips Healthcare, Cleveland, OH, USA; 2 sites) or Siemens (Siemens Magnetom 7T, Siemens Healthcare, Erlangen, Germany; 2 sites). The contributing institutes and corresponding scanner configurations were:
Erwin L. Hahn Institute (ELH), University Duisberg-Essen, Essen, Germany; Siemens. RF coil driven by 8kW RF power (eight 1kW RF amplifiers combined).
Center for Magnetic Resonance Research (CMRR), University of Minnesota, Minneapolis, Minnesota, USA; 90 cm 7T magnet horizontal bore, Magnex Scientific Inc., Oxford, UK, interfaced with Siemens TIM console. RF coil driven by sixteen 1kW RF amplifiers.
C.J. Gorter Center for High Field MRI, Department of Radiology, University Medical Center Leiden (LUMC), Leiden, the Netherlands; Philips. RF coil driven by two 4kW RF amplifiers.
Department of Radiology, University Medical Center Utrecht (UMCU), Utrecht, the Netherlands; Philips. RF coil driven by two 4kW RF amplifiers.
A commercially available head coil (NOVA Medical Inc., Burlington, OH, USA) was used at the European sites with a birdcage coil to excite and a 32-channel receive insert to acquire the MR signal. An in-house built 16-channel transmit/receive array was used at CMRR (12). At UMCU and CMRR, the transmit B1 power was optimized for the volume of interest (VOI) by means of RF-shimming (13), i.e. optimization of the input phases of the individual RF channels. At LUMC and ELH the coil was driven with a fixed phase setting of 90 degrees between the channels. The lowest maximum attainable RF transmit power from the four institutes was used to set the constraints in the RF pulses of the pulse sequence for all sites, assuring equal localization performance at all institutes.
Data Acquisition
Magnetization prepared 3D T1-weighted images were acquired to select the VOI. MRS data were acquired from two voxels, one in gray matter (GM) at the Posterior Cingulate Cortex (PCC, 20×20×20 mm3, Fig. 1A) and one in white matter (WM) at the Corona Radiata (CR, 18×18×18 mm3) in the left hemisphere (Fig. 1B).
Figure 1.

In vivo 1H MR spectra of a single subject obtained using four different 7T systems for each scan & rescan from the two volumes of interest (VOI) using the semi-LASER sequence. All spectra are normalized to NAA (2.01ppm). Left (A&C): localization of the VOI at the Posterior Cingulate Cortex and the spectra that were obtained from an 8cc voxel (primarily gray matter). Right (B&D): localization of the VOI at the Corona Radiata in the left hemisphere and the resulting spectra from a 5.8cc voxel (primarily white matter). Note that high quality spectra could be obtained at all institutes.
Localization was achieved by a previously described semi-LASER sequence (9) (TE=30ms, 64 averages, bandwidth (BW): 6000Hz, data points: 2048), which was implemented with equivalent RF and gradient waveforms and timings across both manufacturers (Fig. 2). Based on a maximum achievable transmit B1 of 23μT for both locations on all systems the following parameters could be used: the duration of the 8-pulse VAPOR water suppression pulses was 35ms, duration of each OVS pulse was 4.6ms (8 pulses, ran in sub-adiabatic regime), duration of the asymmetric slice selective excitation pulse was 4.2ms (maximum amplitude at 3.57ms, bandwidth 3.7kHz, adapted from (11)), and duration of the adiabatic slice selective refocusing pulses was 4.5ms (bandwidth 5.27kHz). These adiabatic refocusing pulses were designed to be optimal at B1 ≥23μT. The distance between the voxel and each OVS saturation band was 8 mm. The repetition time (TR) was set to 8 seconds to remain within specific absorption rate (SAR) guidelines for all sites, and to avoid T1-saturation of the metabolite signals.
Figure 2.

The pulse sequence diagram of the semi-LASER used in the current study (adapted from (9), reprinted with permission). To suppress the water signal an 8-pulse VAPOR scheme was used. To suppress unwanted signals from outside the region of interest outer volume suppression (OVS) was used, consisting of a few pairs of adiabatic pulses applied in different dimensions. The voxel is selected by an asymmetric excitation pulse followed by two pairs of adiabatic full passage pulses (AFP) to refocus the signal. Based on a maximum achievable transmit B1 of 23μT for both locations on all systems the following parameters could be used: the duration of the VAPOR water suppression pulses was 35ms (BW: ~0.5ppm, around water resonance), duration of OVS (hyperbolic secant; BW: 9.1kHz; played out in subadiabatic regime with nominal flip angle of 90 degrees) pulses was 4.6ms, duration of the asymmetric slice selective excitation pulse was 4.2ms (maximum amplitude at 3.57ms, bandwidth 3.7kHz, adapted from (11)), and duration of the adiabatic slice selective refocusing pulses was 4.5ms (bandwidth 5.27kHz). An echo time of 30ms and a repetition time of 8 seconds was used, which ensured that all measurements remained within SAR guidelines for all sites and that T1 saturation was avoided.
Each voxel was manually positioned on the T1-weighted image and was shimmed using a vendor specific FASTMAP implementation (14). On Siemens systems, four sequential acquisitions with different projections (3,6,6 and 6 projections, respectively) were used to calculate the final shim settings. On Philips systems, one acquisition with 13 projections was the basis for calculation of the shim settings. Then the RF power was calibrated (for each voxel separately), hence optimizing the excitation and water suppression pulses (VAPOR; Variable power and optimized relaxation delays (15)). After all calibrations, the spectra were acquired from the selected VOI. Additionally, unsuppressed water reference spectra (wref) were acquired from the same VOI by only turning off the VAPOR pulses. These spectra were used 1) to reconstruct spectra from phased array data, 2) to remove eddy-current effects and 3) as an internal reference to quantify metabolite concentrations (15,16).
Only on Siemens systems, additional water reference spectra (wref2) were acquired without the OVS modules to evaluate the saturation of the water signal in wref due to magnetization transfer (MT) effects (9). This additional wref2 could not be acquired on Philips systems, as the shimming procedure and water scan were fully automated into one scan, thereby overruling the shim settings of the water suppressed spectra. The saturation factor was determined for GM and WM separately, and used to correct metabolite concentrations (see details in Appendix). The protocol could be completed within one hour. Approximately 35 minutes were needed to locate, calibrate and acquire spectra from both voxels, and ~10minutes were needed to reposition voxels with respect to previous scans.
Post-processing & quality control
All spectra were processed offline using Matlab R2011a (Mathworks, Natick, MA, USA). Signals from individual receive channels were phased and amplitude weighted using wref, correcting for the different constant phase shift terms of the complex spectra using the sensitivity of each individual receive element at the VOI, before channel summation. Then, each acquisition was corrected for eddy-current effects (using wref) and corrected for phase and frequency variations caused by subject motion (using the NAA peak). The frequency and phase aligned acquisitions were summed to obtain the final metabolite spectrum, which was ported into LCModel (17).
The T1-weighted images were segmented using SPM8 (Wellcome Trust Centre for Neuroimaging, University College London, UK) to determine the partial volumes in each VOI, reported as %GM, %WM and %CSF (cerebrospinal fluid). These values were used to assess repositioning accuracy between scans and subjects and to correct for partial volume effects for both voxel positions in every subject (see details in Appendix).
Spectra with broad line widths (full width at half maximum (FWHM) of the respective wref over 20Hz) were excluded from analysis.
Spectral fitting
All spectra were quantified with LCModel using wref for water-scaling, using the following assumed water concentrations: 43.3M for GM, 35.9M for WM and 55.6M for CSF (18).
The model spectra of alanine (Ala), aspartate (Asp), ascorbate/vitamin C (Asc), glycerophosphocholine (GPC), phosphocholine (PCh), creatine (Cre), phosphocreatine (PCr), γ-aminobutyric acid (GABA), glucose (Glc), glutamine (Gln), glutamate (Glu), glycine (Gly), glutathione (GSH), myo-Inositol (mI), lactate (Lac), N-acetylaspartate (NAA), N-acetylaspartylglutamate (NAAG), phosphoethanolamine (PE), scyllo-inositol (Scyllo) and taurine (Tau) were generated (VESPA; Versatile Simulation, Pulses and Analysis package (19)) according to previously reported chemical shifts and coupling constants (20,21). A macromolecule (MM) profile (TR/TE/TI: 2000/28/685ms, averages: 128, subjects: 5, surface coil) acquired in a previous study at CMRR was included as one of the model spectra (Fig. 3) (22). Concentrations were corrected for T2-effects, partial volume (PV) effects and MT-effects (see Appendix for details).
Figure 3.

Results of metabolite fitting for the semi-LASER sequence (TE=30ms, TR=8s, 64 averages) in the posterior cingulate cortex. The contributions of alanine (Ala), aspartate (Asp), ascorbate/vitamin C (Asc), glycerophosphocholine (GPC), phosphocholine (PC), creatine (Cr), phosphocreatine (PCr), γ-aminobutyric acid (GABA), glucose (Glc), glutamine (Gln), glutamate (Glu), glycine (Gly), glutathione (GSH), myo-inositol (mI), lactate (Lac), N-acetylaspartyl (NAA), N-acetylaspartylglutamate (NAAG), phosphoethanolamine (PE), scyllo-inositol (Scyllo), taurine (Tau), macromolecules (MM) and baseline to the in vivo spectrum are shown.
Metabolite concentrations with a Cramér-Rao Lower Bound (CRLB, an estimated error of the metabolite quantification (18,23)) ≤ 50% in at least half of the spectra were used for statistical analysis. The sum of metabolites was reported when a high correlation existed between two metabolites (r < -0.5, from Fisher matrix).
Statistical analysis
Reliability and reproducibility were investigated by calculating descriptive parameters (mean and SD) and by calculating the test-retest coefficient of variation (CoV):
| (1) |
with σx representing the SD of the test and retest, μ̄x the mean concentration of the test and retest and CoVm the coefficient of variation, which is reported as average per metabolite.
The total variation in metabolite concentrations was decomposed into the factors (f) ‘subject’, ‘institute’ and ‘random’,
| (2) |
using a variance components analysis, treating ‘subject’ and ‘institute’ as random main factors. Modeling was performed using restricted maximum likelihood estimation in SPSS version 20.0 (IBM corp. Armonk, NY, USA). The intraclass correlation coefficients (ICC) for the different factors, reflecting their relative contributions to the total variance, were then calculated:
| (3) |
Additionally, a one-way ANOVA was performed to assess differences in FWHM and SNR between institutes.
Results
All subjects completed the full test-retest protocol on four different 7T MR systems, without the necessity to repeat any measurements. High quality spectra were obtained and fitted with LCModel (Fig. 1 & Fig. 3); only 4 out of 112 datasets (2 GM & 2 WM) were excluded because the corresponding wref FWHM was above 20Hz.
Reproducibility of spectral quality and localization
The pre-determined transmit power (B1+) requirement of 23μT was reached in 83 out of 112 examinations (ELH: 21/28, CMRR: 25/28, LUMC: 18/28, UMCU: 19/28). 86% of the cases with insufficient B1+ were in WM. Excellent water suppression was achieved in 81 examinations (water residual < NAA singlet intensity), in the remaining cases the residual water peak was as high as, or higher (up to 3 times), than the NAA singlet at 2.01ppm.
Line widths obtained (Table 1) were significantly different (12% on average) between vendors for both VOI’s (P<0.001), most likely due to the vendor-specific B0-shimming procedures. In addition, mean SNR was significantly different between sites for both VOI’s (Table 1, GM, P=0.0002; WM, P=0.001).
Table 1.
Line width and SNR evaluation for each institute and voxel location
| Institute | |||||
|---|---|---|---|---|---|
| Siemens | Philips | ||||
| ELH | CMRR | LUMC | UMCU | ||
| Linewidth (Hz) | Posterior Cingulate Cortex | 11.3 ± 0.6 | 11.7 ± 1.3 | 13.3 ± 1.6 | 12.6 ± 1.0 |
|
| |||||
| Corona Radiata | 13.0 ± 0.6 | 12.8 ± 0.6 | 16.2 ± 2.7 | 13.4 ± 0.7 | |
|
| |||||
| SNR | Posterior Cingulate Cortex | 42 ± 7 | 38 ± 16 | 31 ± 5 | 48 ± 11 |
|
| |||||
| Corona Radiata | 48 ± 8 | 35 ± 10 | 37 ± 7 | 44 ± 7 | |
Note. - Line widths were determined at full-width-half-max of the water reference spectra. SNR was determined by LCModel. Values reported are mean ± SD of all spectra included in the analysis per site. Line widths differ on average by 12% between vendor (P<0.001) and mean SNR is significantly different between sites for both VOI’s (GM: P<0.001 & WM P=0.001).
Deviations in partial volumes as a result of manual repositioning of the VOI were 9% in GM and 4% in WM (Table 2). The assumed water concentration was retrospectively corrected for a more accurate and subject dependent estimation of its concentration by 4.5 ± 5.8% for GM voxels (higher SD due to CSF contribution) and 3.1 ± 0.9% in WM voxels. The unsuppressed water signal was 9 ± 2% (GM) and 17 ± 1% (WM) higher without OVS than with OVS due to MT-effects (see Appendix), which was retrospectively corrected per subject.
Table 2.
Tissue percentages of target voxels, as measure for voxel repositioning and partial volume fractions.
| Subject | |||||||
|---|---|---|---|---|---|---|---|
| 1 | 2 | 3 | 4 | 5 | 6 | 7 | |
| Posterior Cingulate Cortex | 78.5 ± 4.7 (1.06±0.09) | 72.5 ± 4.8 (1.08±0.06) | 75.6 ± 6.0 (1.03±0.04) | 78.0 ± 5.4 (1.02±0.04) | 73.5 ± 6.7 (0.97±0.03) | 74.8 ± 1.3 (1.03±0.08) | 82.2 ± 6.6 (1.04±0.04) |
|
| |||||||
| Corona Radiata | 88.1 ± 2.0 (1.02±0.00) | 86.7 ± 2.1 (1.03±0.01) | 85.3 ± 2.8 (1.04±0.02) | 85.7 ± 3.2 (1.03±0.01) | 86.9 ± 3.7 (1.03±0.01) | 87.3 ± 1.4 (1.03±0.01) | 89.1 ± 2.0 (1.03±0.01) |
Note. - Partial volume effects are determined from each voxel for each volunteer across the four institutions. For the voxel at the posterior cingulate cortex (primarily gray matter) the percentage gray matter within the voxel was used to examine the repositioning, and for the voxel at the corona radiata (primarily white matter) the percentage of white matter was reported. These values were additionally used to calculate the actual water concentration and to determine the scaling factor for partial volume correction (between brackets).
Test-retest reproducibility
Similar spectral patterns were obtained from the same volunteer from both the Posterior Cingulate Cortex and Corona Radiata during all 8 examinations (Fig. 1C & D). 18 out 21 metabolites included in the basis set were quantified within the CRLB<50% threshold using LCModel. This resulted in quantification of 10-11 metabolites or metabolite sums with mean CRLB<20% (Table 3). Metabolites with high correlation as reported by the Fisher matrix were quantified as sum: total NAA (tNAA, NAA+NAAG), total Cre (tCre, Cre+PCr), total Cho (tCho, PCh+GPC) and Glc+Tau. Macromolecular profiles were fitted consistently between subjects per institute, but showed differences in absolute values between MR systems (~25%) of different MR manufacturers. These absolute differences were 7% between the two Siemens systems (ELH & CMRR) and 3% between the Philips systems (LUMC & UMCU, Fig. 4A). This was also reflected by comparable baseline fits for the different system manufacturers (Fig. 4B). Taking into account these differences in baseline and macromolecular profiles the average ± SD metabolite levels were reproducible between sites (Fig. 5). Excellent test-retest reproducibility was illustrated by low within-subject CoV values (Table 3). The average CoV and CRLB were below 5% for metabolites with high concentrations (tNAA, tCre, Glu, mI, tCho), while the CoV for low concentration metabolites (Asc, Asp, Gln, GSH, PE, Scyllo & Glc+Tau) was less than 15% in GM and less than 18% in WM (except for Scyllo 21% & Glc+Tau 23%). GABA (22% & 18%) and Lac (35% & 32%) had higher CoV for both VOI’s. Furthermore, scatter plots of the major metabolites from the repeated measurements showed that most points were close to the identity line (Fig. 6A & B). The distribution of the CoV is also visible in these plots, e.g. Gln has more points deviating from the identity line, hence has a higher CoV (8.8% & 17.7%, GM and WM), whereas tCre data points are very close to the identity line, which is consistent with a CoV of 2.9% (GM) and 2.7% (WM). The diagonal spread of tCre data points over the identity line indicates differences between subjects or institutes.
Table 3.
Quantification results and reproducibility of all detectable metabolites
| Metabolite: | |||||||||||||||
|---|---|---|---|---|---|---|---|---|---|---|---|---|---|---|---|
| Asc: | Asp: | GABA: | Gln: | Glu: | GSH: | mI: | Lac: | PE: | Scyllo: | NAA+NAAG: | Cre+PCr: | Glc+Tau: | GPC+PCh: | ||
| Posterior Cingulate Cortex | Mean (mM) | 2,0 | 3,8 | 1,3 | 5,2 | 9,4 | 1,2 | 6,4 | 0,8 | 1,6 | 0,3 | 12,1 | 8,1 | 2,3 | 1,3 |
|
| |||||||||||||||
| SD (mM) | 0,3 | 0,6 | 0,4 | 1,1 | 0,8 | 0,3 | 0,6 | 0,3 | 0,3 | 0,1 | 1,0 | 0,5 | 0,6 | 0,1 | |
|
| |||||||||||||||
| CoV (%) | 8,9 | 9,7 | 22,2 | 8,8 | 3,1 | 14,4 | 4,0 | 35,2 | 12,9 | 12,5 | 3,1 | 2,9 | 15,0 | 4,2 | |
|
| |||||||||||||||
| mean CRLB (%SD) | 14,2 | 14,5 | 28,9 | 6,5 | 3,1 | 13,2 | 4,1 | 23,8 | 11,7 | 20,2 | 1,4 | 1,9 | 13,3 | 4,2 | |
|
| |||||||||||||||
| N (after Q.C.) | 54 | 54 | 33 | 54 | 54 | 54 | 54 | 32 | 54 | 53 | 54 | 54 | 48 | 54 | |
|
| |||||||||||||||
| Corona Radiata | Mean (mM) | 2,0 | 2,9 | 1,3 | 2,4 | 7,2 | 1,2 | 6,2 | 0,9 | 1,4 | 0,3 | 13,6 | 7,8 | 1,3 | 1,9 |
|
| |||||||||||||||
| SD (mM) | 0,5 | 0,6 | 0,4 | 0,9 | 1,0 | 0,3 | 0,8 | 0,3 | 0,4 | 0,1 | 1,2 | 0,5 | 0,6 | 0,3 | |
|
| |||||||||||||||
| CoV (%) | 16,2 | 15,9 | 17,7 | 17,7 | 3,4 | 11,5 | 4,2 | 31,5 | 14,8 | 20,8 | 2,1 | 2,7 | 22,8 | 3,4 | |
|
| |||||||||||||||
| mean CRLB (%SD) | 15,0 | 20,3 | 30,9 | 15,5 | 3,9 | 12,6 | 3,6 | 22,3 | 13,5 | 20,7 | 1,2 | 2,0 | 19,2 | 3,3 | |
|
| |||||||||||||||
| N (after Q.C.) | 54 | 53 | 35 | 44 | 48 | 54 | 54 | 48 | 54 | 44 | 54 | 54 | 53 | 54 | |
Note. - Mean concentrations and standard deviations (SD) in mM of all quantifiable metabolites detected with Cramér-Rao Lower bound < 50% (CRLB) in at least half of the spectra. Also listed are the mean test-retest coefficient of variations (CoV), the mean CRLB and the number of spectra (N) that were used to determine listed values. In total 54 spectra from gray matter and 54 spectra from white matter were used, 4 spectra were excluded because of broad line widths. All reported concentrations are corrected for T2, magnetization transfer effects and partial volume, see Appendix for details. A list of abbreviations can be found in Figure 3.
Figure 4.
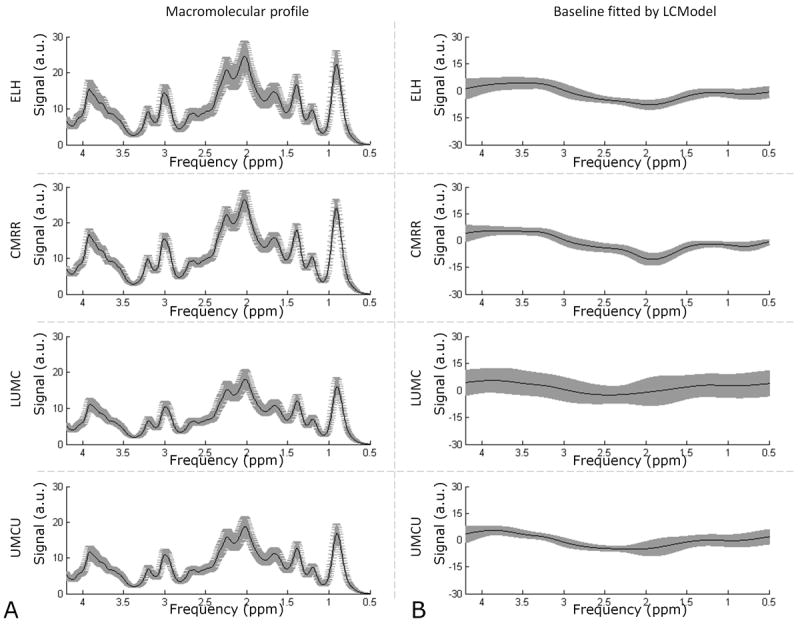
Fitting precision by LCModel of the macromolecular profiles and baselines per institute. The mean (black line) and standard deviation (gray area) of each fitted macromolecular profile and each fitted baseline is plotted per institute. (A) Differences in fitting of the macromolecular profiles are visible per site, but variations within sites are relatively small. (B) The baselines were fitted quite consistently by LCModel within both MR manufacturers.
Figure 5.
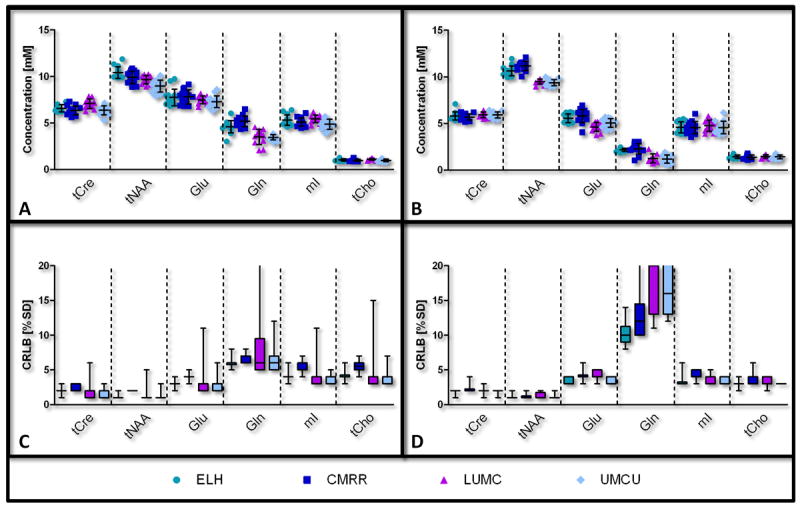
LCModel quantification results for selected metabolites per institute. The concentrations of the metabolites are shown as mean ± SD, as well as individual data points (A&B) and their corresponding Cramér-Rao Lower Bounds (CRLB) in box plots (C&D). Left: posterior cingulate cortex (A&C); right: corona radiata (B&D). Tissue levels of Cre+PCr (tCre), NAA+NAAG (tNAA), Glu, Gln, mI and tCho are shown. Note the minor deviations in total variance between the four contributing institutes. A list of abbreviations can be found in Figure 3.
Figure 6.

Repeatability of metabolites (A&B) presented in Figure 5. The concentrations obtained from the first scan (horizontal axis) are plotted against the concentrations from the second scan (vertical axis), with left – posterior cingulate cortex and right – corona radiata. Note that the close proximity of these metabolites to the identity line (x=y) reveals high test-retest reproducibility, also shown by the low CoV. The bottom row (C&D) shows a zoomed-in view of the tCho concentrations. The coefficient of variation (CoV) for this metabolite was 4.0% for gray matter (ICCsubject = 57%) and 3.4% for white matter (ICCsubject = 85%). It is clear that most variation results from differences between volunteers (markers, clustered), rather than from differences between institutes (colors, more randomly distributed).
Between subject/institute reproducibility
Unraveling the contributing factors to the total variances using the ICC analysis demonstrated that the highest fractions of the variance attributed to the factor ‘institute’ were found for tNAA (46% & 80%), Gln (66% & 63%), Glu (46% WM) and GSH (51% & 54%) (Table 4). In other metabolites, differences were more to variations between ‘subjects’: Glu (58% GM), mI (51% & 83%), Scyllo (69% GM), tCre (64% WM) and tCho (58% & 85%). Variances for all other metabolites were attributed to the factor ‘random’, i.e. representing within subject variations, repeatability or system noise: Asc (78% & 69%), Asp (50% & 86%), GABA (97% & 63%), Lac (96% & 94%), PE (76% & 80%), Scyllo (60% WM), tCre (62% GM) and Glc + Tau (57% & 76%). The distribution of points obtained from the tCho signal (Fig. 6C & D) shows that ‘subjects’ (represented by symbols) are more grouped together compared to ‘institutes’ (represented by colors).
Table 4.
Sources of variance determined for each detectable metabolite
| Metabolite: | |||||||||||||||
|---|---|---|---|---|---|---|---|---|---|---|---|---|---|---|---|
| Asc: | Asp: | GABA: | Gln: | Glu: | GSH: | mI: | Lac: | PE: | Scyllo: | NAA+NAAG: | Cre+PCr: | Glc+Tau: | GPC+PCh: | ||
| Posterior Cingulate Cortex | subject | 19 | 29 | 0 | 9 | 58 | 4 | 51 | 0 | 13 | 64 | 24 | 18 | 20 | 57 |
|
| |||||||||||||||
| institute | 3 | 21 | 3 | 66 | 14 | 51 | 14 | 0 | 11 | 4 | 46 | 19 | 24 | 9 | |
|
| |||||||||||||||
| random | 78 | 50 | 97 | 25 | 28 | 45 | 35 | 100 | 76 | 32 | 30 | 63 | 57 | 35 | |
|
| |||||||||||||||
| Corona Radiata | subject | 31 | 0 | 10 | 9 | 40 | 25 | 83 | 0 | 9 | 27 | 8 | 64 | 19 | 85 |
|
| |||||||||||||||
| institute | 0 | 12 | 23 | 63 | 46 | 53 | 0 | 5 | 11 | 13 | 80 | 8 | 0 | 1 | |
|
| |||||||||||||||
| random | 69 | 88 | 66 | 28 | 14 | 22 | 17 | 95 | 80 | 60 | 12 | 28 | 81 | 14 | |
Note. - Intraclass correlation coefficients based on the variance components analysis as obtained for all quantified metabolites. All percentages of 50% and higher are highlighted to show main effects. A list of abbreviations can be found in Figure 3.
Discussion
For this study an identical single voxel semi-LASER 1H-MRS pulse sequence was implemented on four different 7T systems manufactured by two different vendors, to assess metabolic variations and reproducibility in healthy volunteers by obtaining high quality, short echo time, 1H MR spectra from two clinically relevant brain regions. As such, this work initiates standardization efforts for MR spectroscopy at UHF, a critical step towards wide utility and impact of the methodology for neuroscience and clinical applications. We demonstrate a high test-retest and between-vendor reproducibility of neurochemical concentrations after harmonization of data acquisition and post-processing.
Differences in SNR of the spectra between institutes as reported by LCModel are in part due to differences between the MR-coils, but also in differences in line width. At CMRR, the 16-channel head coil had fewer and larger receive elements, decreasing SNR of the measured voxels. Since at ELH, LUMC and UMCU same size receive elements from a similar head coil were used, the lower SNR at LUMC was attributed to broader line widths, probably caused by the automated single step shimming procedure on the Philips scanners. Additionally, lower SNR can increase variability, since precision in fitting of the baselines could decrease and hence introduce additional variations between subjects. Note that in this study not only the amplitude of the macromolecular profiles differed per vendor, but also that baselines were more often fitted with higher negative values in the 2.5-2.0 ppm range at Siemens systems. This vendor-specific bias could have resulted in a systematic difference in the concentration of tNAA, Gln and Glu, and as such resulted in an increased contribution of the factor ‘institute’ to the total variance. We assumed the macromolecular profile to be the same for gray and white matter (22).
The average concentrations of quantified metabolites reported in this study matched reasonably well with recently reported values that were obtained from the same brain regions (4,6,8,24-27). In all 108 analyzed spectra, 10 (in WM) – 11 (in GM) metabolites were quantified with an average CRLB of less than 20%. Generally, disease-related alterations can be detected in individual spectra with 95% confidence if changes are greater than twice the CRLB (18). In this study the CoV was comparable to the average CRLB for most metabolites, suggesting that relatively small variations in metabolite concentrations may be detectable. For Asc, Asp, GABA and Scyllo the CoV was below the mean CRLB, which suggests that variations below the CRLB threshold can be reliably detected. CRLB’s can be larger that test-retest CoV, if they are calculated on the basis of the residuals from the fit to the data (as indeed is the case in LCModel), instead of calculated from white noise from a part of the spectrum without signal. Generally, residual signals could cause uncertainty on fits of the resonance at hand, which is why the CRLB incorporates these. However, if this residual is constant over multiple measurements, test-retest CoV could outperform CRLB.
In our analysis, we used the CRLB provided by LCModel as the measure for quality of the fit of individual resonances, and used a cutoff in this CRLB value of 50% to include the corresponding metabolite concentration value. This way of using a threshold, relative to the concentration, could introduce a bias towards higher concentrations in metabolites with CRLBs in the threshold range (close to 50%). When calculating absolute CRLBs first (excluding CRLBs above 200%), and then establishing an absolute CRLB threshold at 50% of the median of all concentrations, this bias could be removed and perhaps more concentration values can be included. Doing so for GABA in WM as an example, the median concentration of GABA was 1.2mM, and a 50% CRLB of this median value lead to an absolute CRLB threshold of 0.6 mM. With this absolute threshold 47 rather than 34 spectra had acceptable GABA fits, and mean level of GABA, SD, CoV and mean CRLB were 1.2 mM, 0.5mM, 25.6% and 41.6%, respectively. Indeed, more spectral fits were included and mean concentration of GABA was lower (though not significantly), as compared to using the relative threshold only (Table 3), at a cost of a larger uncertainty and CoV.
Several other studies have investigated the variation in the level of metabolites in the human brain using MRS on lower field strengths (≤3T) (8,10,26,27) and on UHF at a single site (4-6,11). The increased accuracy in detection of neurochemical profiles at UHF is supported by the lower CoV compared to other studies (8,10,25,26,28-33). This suggests that metabolites involved in inhibitory and excitatory neurotransmission, such as NAAG, Glu and Gln, can now be detected with higher accuracy. However, detection of neurotransmitters like GABA, Gly or antioxidants like GSH remains challenging due to their low concentrations and overlap with other metabolites (34). Alternatively, these metabolites can be detected using spectral editing techniques, which could provide higher precision, but at the cost of larger VOI’s and longer TE’s (35,36).
In this study the TR was set to 8 seconds to remain within SAR-limits. This long TR is advantageous for absolute quantification as all spins involved can return to full Boltzmann equilibrium, at the expense of in-efficiency in SNR. Shorter TR can only be chosen if the total RF power deposition is decreased, e.g. by removing or changing OVS pulses, or replacing the adiabatic refocusing pulses with gradient modulated offset-independent adiabatic pulses with less RF power demand (37), or by using B1+ shimming. However, shorter TR introduces a steady state in metabolite signal intensities, therefore an additional correction on the basis of assumed or measured T1 of the metabolites is needed to obtain absolute quantification.
Variations in concentrations of many metabolites can be attributed to differences between subjects and between institutes, as is shown by the ICCs for Glu, mI, Scyllo, tCre and tCho (highest ICCs for ‘subject’) and for Gln, GSH and tNAA (highest ICCs for ‘institute’). For the latter, absolute concentrations between institutes contain a bias that needs to be taken into account in future comparisons. This bias could be related to differences in SNR and in FWHM between vendors (12% differences on average, P<0.001). Especially in the low SNR regime a systematic difference in line width can lead to a bias in the corresponding metabolite concentrations (34). The ICC Table (Table 4) provides a handle to identify which metabolites can be measured with the used setup and parameters with a precision high enough to detect between-subject differences in healthy volunteers. It also illustrates that for metabolites with low concentrations the systematic noise in these measurements is higher than between-subject differences, which is directly related to repeatability. These data will allow assessments of whether disease-related metabolic changes in certain pathologies are indeed larger than naturally occurring between-subject concentration differences.
This study had several limitations. Firstly, the chosen voxel positions are representative for gray and white matter, but chosen at locations that are not difficult to shim. Shimming voxels closer to the skull or in deep brain will be more difficult, resulting in broader lines and less accurate metabolite quantification. Secondly, although supervised by two experienced operators, voxel (re-)positioning was performed manually, possibly introducing small differences in tissue partial volumes. Automated voxel positioning (38) would alleviate this problem and should be more widely implemented. Perhaps also the imaging pulse sequence would need exact homogenization between systems to have the exact same contrast between gray and white matter before segmentation. Thirdly, the initially determined maximum achievable B1-transmit amplitude of 23μT was somewhat high in retrospect. Due to different coil load by different subjects, a B1 of 23μT could not be reached in all cases, thereby decreasing the flip angle of the excitation pulse and slightly decreasing the amplitude (5%) of the adiabatic refocusing pulses. Poor water suppression coincided with the reduced peak power at a single site, especially for the voxel positioned in the corona radiata. This could be a result of the automatic water suppression calibration at the Philips sites. Lastly, correction of T2-relaxation effects was solely based on the T2 of Creatine as only a limited number of T2-values of different metabolites in brain for 7T was available (39).
To conclude, harmonization of data acquisition and post-processing of single voxel 1H-MRS produces very similar results at four different 7 Tesla systems. The accuracy and reproducibility obtained with the semi-LASER sequence in this multi-center, multi-vendor setting at ultra-high magnetic field strength of in-vivo measured neurochemical profiles can be used as guidance for quantifying metabolite concentrations in future (clinical) studies.
Acknowledgments
We would like to thank the staff of all contributing institutes for their help in arranging and planning the examinations. A very special thank you goes out to the volunteers for their support and collaboration within this study. This work was supported in part by the following grants:
CMRR: NIH R01 NS070815, P41 RR008079, P41 EB015894, P30 NS076408, S10 RR026783 & WM KECK Foundation
UMCU: STW NIG-10882 & STW-12211
List of abbreviations
- Ala
Alanine
- Asc
Ascorbate/vitamin C
- Asp
Aspartate
- BW
Bandwidth
- CMRR
Center for Magnetic Resonance Research
- CoV
Coefficient of variation
- CR
Corona radiata
- Cre
Creatine
- CRLB
Cramér-Rao Lower bound
- CSDE
Chemical shift displacement error
- CSF
Cerebral spinal fluid
- ELH
Erwin L. Hahn institute
- FWHM
Full width at half maximum
- GABA
γ-aminobutyric acid
- Glc
Glucose
- Gln
Glutamine
- GLT
Glc+Tau
- Glu
Glutamate
- Gly
Glycine
- GM
Gray matter
- GPC
Glycerophosphocholine
- GSH
Glutathione
- ICC
Intraclass correlation coefficient
- Lac
Lactate
- LUMC
Leiden University Medical Center
- mI
myo-Inositol
- MM
Macromolecules
- MRS(I)
Magnetic resonance spectroscopy (imaging)
- NAA
N-acetylaspartate
- NAAG
N-acetylaspartylglutamate
- OVS
Outer volume suppression
- PCC
Posterior cingulate cortex
- PCh
Phosphocholine
- PCr
Phosphocreatine
- PE
Phosphoethanolamine
- RF
Radio frequency
- Scyllo
Scyllo-inositol
- SD
Standard deviation
- Semi-LASER
Semi-Localization by adiabatic selective refocusing
- SNR
Signal-to-noise ratio
- Tau
Taurine
- tCho
PCh+GPC
- tCre
Cre+PCr
- TE
Echo time
- tNAA
NAA+NAAG
- TR
Repetition time
- UHF
Ultra-high field
- UMCU
Utrecht University Medical Center
- VAPOR
Variable power and optimized relaxation delays
- VESPA
Versatile Simulation, Pulses and Analysis package
- VOI
Volume of interest
- WM
White matter
- Wref(1,2)
Water reference spectra (1,2)
Appendix - Metabolite scaling factor
In this study a combination of four correction factors was used to calculate the metabolite concentrations. The concentrations were corrected for TE (T2), TR (T1), MT and partial volume (PV) effects. This correction scales the concentration and can be written as:
| (A.4) |
where each factor contributes to the scale factor fscale that was used to correct individual concentrations after the LCModel analysis (15):
| (A.5) |
with being the concentration of the individual metabolites given by LCModel and being the concentration of the individual metabolites after scaling.
We determined different scaling factors for both VOI’s and for each subject, to differentiate between gray and white matter and minimize variances between subjects. The factors described in formula (A.4) were calculated as follows:
Correction for TE
| (A.6) |
signals were corrected for T2-relaxation effects. In this study we used a TE of 30ms, which is long enough to attenuate signals as a result of T2-decay. The following parameters were used for this correction: TE = 30ms, and . This latter value is the mean T2-relaxation rate for the methyl (CH3, 3.03ppm) and methylene (CH2, 3.92ppm) protons of the total Cre signal (39). All signals in both GM and WM were corrected using this single value.
Correction for TR
| (A.7) |
no additional correction for T1-effects was needed. We used a long TR such that signal was not saturated by repetition, since TR = 8000ms, (GM) and 1550ms (WM) and , which is the mean T1-relaxation rate for the methyl and methylene protons of the tCre signal (40).
Correction for MT-effects
| (A.8) |
the unsuppressed water reference spectra used to quantify metabolite concentrations had less signal from water in the presence of OVS as a result of MT-effects (9). Signals from less mobile, off-resonant protons (exchanging with bulk water) within the voxel are suppressed by OVS and thereby decreasing the total water signal from the voxel. In this study corrections for MT-effects were performed per subject and per voxel, with mean effect sizes in percentages of 9 ± 2% in GM and 17 ± 1% in WM (fMTwref is the fractional change in wref per subject and per voxel).
Correction for partial volume
| (A.9) |
this last factor was used to correct the initial assumed water concentration, or partial volume based on the content of the separate fractions (GM, WM and CSF). Additionally, the factor 1/(1 − fCSF) corrects for the fact that the metabolites are only present in the gray matter and white matter tissue, rather than in CSF (18). Although we initially used assumed water concentrations of 43.3M for GM, 35.9M for WM and 55.6M for CSF (18), after determining partial volumes (ConcPV) at the locations of the voxels an additional correction was needed, because the water concentration (ConcRef) was underestimated by 4.5 ± 5.8% for GM voxels (due to CSF contribution) and by 3.1 ± 0.9% in WM voxels. Omission of this correction would result in overestimation of metabolite concentrations. We corrected partial volumes for GM & WM separately and for each subject (Table 2). Note that fGM + fWM + fCSF = 1.
References
- 1.Oz G, Alger JR, Barker PB, Bartha R, Bizzi A, Boesch C, Bolan PJ, Brindle KM, Cudalbu C, Dincer A, Dydak U, Emir UE, Frahm J, Gonzalez RG, Gruber S, Gruetter R, Gupta RK, Heerschap A, Henning A, Hetherington HP, Howe FA, Huppi PS, Hurd RE, Kantarci K, Klomp DW, Kreis R, Kruiskamp MJ, Leach MO, Lin AP, Luijten PR, Marjanska M, Maudsley AA, Meyerhoff DJ, Mountford CE, Nelson SJ, Pamir MN, Pan JW, Peet AC, Poptani H, Posse S, Pouwels PJ, Ratai EM, Ross BD, Scheenen TW, Schuster C, Smith IC, Soher BJ, Tkac I, Vigneron DB, Kauppinen RA. Clinical proton MR spectroscopy in central nervous system disorders. Radiology. 2014;270(3):658–679. doi: 10.1148/radiol.13130531. [DOI] [PMC free article] [PubMed] [Google Scholar]
- 2.Duarte JM, Lei H, Mlynarik V, Gruetter R. The neurochemical profile quantified by in vivo 1H NMR spectroscopy. Neuroimage. 2012;61(2):342–362. doi: 10.1016/j.neuroimage.2011.12.038. [DOI] [PubMed] [Google Scholar]
- 3.Ugurbil K, Adriany G, Andersen P, Chen W, Garwood M, Gruetter R, Henry PG, Kim SG, Lieu H, Tkac I, Vaughan T, Van De Moortele PF, Yacoub E, Zhu XH. Ultrahigh field magnetic resonance imaging and spectroscopy. Magnetic Resonance Imaging. 2003;21(10):1263–1281. doi: 10.1016/j.mri.2003.08.027. [DOI] [PubMed] [Google Scholar]
- 4.Tkac I, Oz G, Adriany G, Ugurbil K, Gruetter R. In vivo 1H NMR spectroscopy of the human brain at high magnetic fields: metabolite quantification at 4T vs. 7T. Magn Reson Med. 2009;62(4):868–879. doi: 10.1002/mrm.22086. [DOI] [PMC free article] [PubMed] [Google Scholar]
- 5.Emir UE, Auerbach EJ, Van De Moortele PF, Marjanska M, Ugurbil K, Terpstra M, Tkac I, Oz G. Regional neurochemical profiles in the human brain measured by (1)H MRS at 7 T using local B(1) shimming. NMR Biomed. 2012;25(1):152–160. doi: 10.1002/nbm.1727. [DOI] [PMC free article] [PubMed] [Google Scholar]
- 6.Mekle R, Mlynarik V, Gambarota G, Hergt M, Krueger G, Gruetter R. MR spectroscopy of the human brain with enhanced signal intensity at ultrashort echo times on a clinical platform at 3T and 7T. Magn Reson Med. 2009;61(6):1279–1285. doi: 10.1002/mrm.21961. [DOI] [PubMed] [Google Scholar]
- 7.Scheenen TW, Klomp DW, Wijnen JP, Heerschap A. Short echo time 1H-MRSI of the human brain at 3T with minimal chemical shift displacement errors using adiabatic refocusing pulses. Magn Reson Med. 2008;59(1):1–6. doi: 10.1002/mrm.21302. [DOI] [PubMed] [Google Scholar]
- 8.Wijnen JP, van Asten JJ, Klomp DW, Sjobakk TE, Gribbestad IS, Scheenen TW, Heerschap A. Short echo time 1H MRSI of the human brain at 3T with adiabatic slice-selective refocusing pulses; reproducibility and variance in a dual center setting. J Magn Reson Imaging. 2010;31(1):61–70. doi: 10.1002/jmri.21999. [DOI] [PubMed] [Google Scholar]
- 9.Oz G, Tkac I. Short-echo, single-shot, full-intensity proton magnetic resonance spectroscopy for neurochemical profiling at 4 T: validation in the cerebellum and brainstem. Magn Reson Med. 2011;65(4):901–910. doi: 10.1002/mrm.22708. [DOI] [PMC free article] [PubMed] [Google Scholar]
- 10.Deelchand DK, Adanyeguh IM, Emir UE, Nguyen TM, Valabregue R, Henry PG, Mochel F, Oz G. Two-site reproducibility of cerebellar and brainstem neurochemical profiles with short-echo, single-voxel MRS at 3T. Magn Reson Med. 2014 doi: 10.1002/mrm.25295. [DOI] [PMC free article] [PubMed] [Google Scholar]
- 11.Boer VO, van Lier AL, Hoogduin JM, Wijnen JP, Luijten PR, Klomp DW. 7-T (1) H MRS with adiabatic refocusing at short TE using radiofrequency focusing with a dual-channel volume transmit coil. NMR Biomed. 2011;24(9):1038–1046. doi: 10.1002/nbm.1641. [DOI] [PubMed] [Google Scholar]
- 12.Adriany G, Van de Moortele PF, Ritter J, Moeller S, Auerbach EJ, Akgun C, Snyder CJ, Vaughan T, Ugurbil K. A geometrically adjustable 16-channel transmit/receive transmission line array for improved RF efficiency and parallel imaging performance at 7 Tesla. Magn Reson Med. 2008;59(3):590–597. doi: 10.1002/mrm.21488. [DOI] [PubMed] [Google Scholar]
- 13.Metzger GJ, Snyder C, Akgun C, Vaughan T, Ugurbil K, Van de Moortele PF. Local B1+ shimming for prostate imaging with transceiver arrays at 7T based on subject-dependent transmit phase measurements. Magn Reson Med. 2008;59(2):396–409. doi: 10.1002/mrm.21476. [DOI] [PMC free article] [PubMed] [Google Scholar]
- 14.Gruetter R, Tkac I. Field mapping without reference scan using asymmetric echo-planar techniques. Magn Reson Med. 2000;43(2):319–323. doi: 10.1002/(sici)1522-2594(200002)43:2<319::aid-mrm22>3.0.co;2-1. [DOI] [PubMed] [Google Scholar]
- 15.Tkac I, Gruetter R. Methodology of H NMR Spectroscopy of the Human Brain at Very High Magnetic Fields. Appl Magn Reson. 2005;29(1):139–157. doi: 10.1007/BF03166960. [DOI] [PMC free article] [PubMed] [Google Scholar]
- 16.Soher BJ, Hurd RE, Sailasuta N, Barker PB. Quantitation of automated single-voxel proton MRS using cerebral water as an internal reference. Magn Reson Med. 1996;36(3):335–339. doi: 10.1002/mrm.1910360302. [DOI] [PubMed] [Google Scholar]
- 17.Provencher SW. Estimation of metabolite concentrations from localized in vivo proton NMR spectra. Magn Reson Med. 1993;30(6):672–679. doi: 10.1002/mrm.1910300604. [DOI] [PubMed] [Google Scholar]
- 18.Provencher SW. LCModel & LCMgui User’s Manual. 2012 [Google Scholar]
- 19.Soher BJ, Semanchuk P, Todd D, Steinberg J, Young K. VeSPA: Integrated applications for RF pulse design, spectral simulation and MRS data analysis. Proceedings of 19th Annual Meeting ISMRM; Montreal, Canada. 2011. p. 1410. [Google Scholar]
- 20.Govindaraju V, Young K, Maudsley AA. Proton NMR chemical shifts and coupling constants for brain metabolites. NMR Biomed. 2000;13(3):129–153. doi: 10.1002/1099-1492(200005)13:3<129::aid-nbm619>3.0.co;2-v. [DOI] [PubMed] [Google Scholar]
- 21.Tkac I. Refinement of simulated basis set for LCModel analysis. Proceedings of the 16th Annual Meeting ISMRM; Toronto, Canada. 2008. p. 1624. [Google Scholar]
- 22.Schaller B, Xin L, Gruetter R. Is the macromolecule signal tissue-specific in healthy human brain? A H MRS study at 7 tesla in the occipital lobe. Magn Reson Med. 2013 doi: 10.1002/mrm.24995. Epub ahead of print. [DOI] [PubMed] [Google Scholar]
- 23.Bolliger CS, Boesch C, Kreis R. On the use of Cramer-Rao minimum variance bounds for the design of magnetic resonance spectroscopy experiments. Neuroimage. 2013;83:1031–1040. doi: 10.1016/j.neuroimage.2013.07.062. [DOI] [PubMed] [Google Scholar]
- 24.Fuchs A, Luttje M, Boesiger P, Henning A. SPECIAL semi-LASER with lipid artifact compensation for 1H MRS at 7 T. Magn Reson Med. 2013;69(3):603–612. doi: 10.1002/mrm.24292. [DOI] [PubMed] [Google Scholar]
- 25.Brooks WM, Friedman SD, Stidley CA. Reproducibility of 1H-MRS in vivo. Magn Reson Med. 1999;41(1):193–197. doi: 10.1002/(sici)1522-2594(199901)41:1<193::aid-mrm27>3.0.co;2-p. [DOI] [PubMed] [Google Scholar]
- 26.Wiedermann D, Schuff N, Matson GB, Soher BJ, Du AT, Maudsley AA, Weiner MW. Short echo time multislice proton magnetic resonance spectroscopic imaging in human brain: metabolite distributions and reliability. Magnetic Resonance Imaging. 2001;19(8):1073–1080. doi: 10.1016/s0730-725x(01)00441-6. [DOI] [PubMed] [Google Scholar]
- 27.Michaelis T, Merboldt KD, Bruhn H, Hanicke W, Frahm J. Absolute concentrations of metabolites in the adult human brain in vivo: quantification of localized proton MR spectra. Radiology. 1993;187(1):219–227. doi: 10.1148/radiology.187.1.8451417. [DOI] [PubMed] [Google Scholar]
- 28.Hammen T, Stadlbauer A, Tomandl B, Ganslandt O, Pauli E, Huk W, Neundorfer B, Stefan H. Short TE single-voxel 1H-MR spectroscopy of hippocampal structures in healthy adults at 1.5 Tesla--how reproducible are the results? NMR Biomed. 2005;18(3):195–201. doi: 10.1002/nbm.958. [DOI] [PubMed] [Google Scholar]
- 29.Li BS, Babb JS, Soher BJ, Maudsley AA, Gonen O. Reproducibility of 3D proton spectroscopy in the human brain. Magn Reson Med. 2002;47(3):439–446. doi: 10.1002/mrm.10081. [DOI] [PubMed] [Google Scholar]
- 30.Gu M, Kim DH, Mayer D, Sullivan EV, Pfefferbaum A, Spielman DM. Reproducibility study of whole-brain 1H spectroscopic imaging with automated quantification. Magn Reson Med. 2008;60(3):542–547. doi: 10.1002/mrm.21713. [DOI] [PMC free article] [PubMed] [Google Scholar]
- 31.Wellard RM, Briellmann RS, Jennings C, Jackson GD. Physiologic variability of single-voxel proton MR spectroscopic measurements at 3T. AJNR Am J Neuroradiol. 2005;26(3):585–590. [PMC free article] [PubMed] [Google Scholar]
- 32.Chard DT, McLean MA, Parker GJ, MacManus DG, Miller DH. Reproducibility of in vivo metabolite quantification with proton magnetic resonance spectroscopic imaging. J Magn Reson Imaging. 2002;15(2):219–225. doi: 10.1002/jmri.10043. [DOI] [PubMed] [Google Scholar]
- 33.Marshall I, Wardlaw J, Cannon J, Slattery J, Sellar RJ. Reproducibility of metabolite peak areas in 1H MRS of brain. Magnetic Resonance Imaging. 1996;14(3):281–292. doi: 10.1016/0730-725x(95)02084-7. [DOI] [PubMed] [Google Scholar]
- 34.Near J, Andersson J, Maron E, Mekle R, Gruetter R, Cowen P, Jezzard P. Unedited in vivo detection and quantification of gamma-aminobutyric acid in the occipital cortex using short-TE MRS at 3 T. NMR Biomed. 2013;26(11):1353–1362. doi: 10.1002/nbm.2960. [DOI] [PubMed] [Google Scholar]
- 35.Terpstra M, Marjanska M, Henry PG, Tkac I, Gruetter R. Detection of an antioxidant profile in the human brain in vivo via double editing with MEGA-PRESS. Magn Reson Med. 2006;56(6):1192–1199. doi: 10.1002/mrm.21086. [DOI] [PubMed] [Google Scholar]
- 36.Trabesinger AH, Boesiger P. Improved selectivity of double quantum coherence filtering for the detection of glutathione in the human brain in vivo. Magn Reson Med. 2001;45(4):708–710. doi: 10.1002/mrm.1094. [DOI] [PubMed] [Google Scholar]
- 37.Tannus A, Garwood M. Adiabatic pulses. NMR Biomed. 1997;10(8):423–434. doi: 10.1002/(sici)1099-1492(199712)10:8<423::aid-nbm488>3.0.co;2-x. [DOI] [PubMed] [Google Scholar]
- 38.Hancu I, Blezek DJ, Dumoulin MC. Automatic repositioning of single voxels in longitudinal 1H MRS studies. NMR Biomed. 2005;18(6):352–361. doi: 10.1002/nbm.965. [DOI] [PubMed] [Google Scholar]
- 39.Marjanska M, Auerbach EJ, Valabregue R, Van de Moortele PF, Adriany G, Garwood M. Localized 1H NMR spectroscopy in different regions of human brain in vivo at 7 T: T2 relaxation times and concentrations of cerebral metabolites. NMR Biomed. 2012;25(2):332–339. doi: 10.1002/nbm.1754. [DOI] [PMC free article] [PubMed] [Google Scholar]
- 40.Xin L, Schaller B, Mlynarik V, Lu H, Gruetter R. Proton T1 relaxation times of metabolites in human occipital white and gray matter at 7 T. Magn Reson Med. 2013;69(4):931–936. doi: 10.1002/mrm.24352. [DOI] [PubMed] [Google Scholar]