

Abstract
The proliferation and diminishing costs of ‘omics’ approaches have finally opened the doors for small and medium laboratories to enter the ‘systems biology era’. This is a welcome evolution that requires a new framework to design, interpret and validate studies. Here we highlight some of the challenges, contributions, and prospects of the“cyst-ems biology” of polycystic kidney disease.
Introduction
In an age where ‘being connected’ is almost synonymous with being alive, it’s hardly surprising that the massive output of high-throughput (HTP) data came to be viewed as something that should be understood using a network framework. The roadmap seemed simple enough: if one accepts that biological systems have a scale-free topology (i.e. few hubs of highly connected elements in a sea of poorly connected elements) one ought to be able to use the mathematical properties of networks to infer biological function, such as identifying new factors important in normal and pathological conditions; clusters of enzymes/genes/proteins more susceptible to perturbations, etc 1, 2 This approach has yielded novel insights in a number of fields but unfortunately not in all. In this report, we review how such methods fared when used to understand polycystic kidney disease (PKD).
Clinical Problem
Autosomal dominant polycystic kidney disease (ADPKD; OMIM# 173900 and 613095) is considered the most common monogenic inherited kidney disease, with estimated prevalence ranging from 32.7 3 to 200 patients per 100,000 individuals 4. Caused by mutations in either PKD1 (~85%) or PKD2 (~15%), ADPKD’s main feature is the gradual replacement of normal kidney parenchyma by epithelial cysts arising in any nephron segment, leading to end-stage renal disease usually after the 5th decade of life 4. It is believed that cysts arise by clonal expansion of cells with inherited heterozygous germline mutations in which a somatic mutation inactivates the remaining normal allele, similar to the two-hit model proposed for some cancers 5, 6.
Polycystin-1 (PC1) and polycystin-2 (PC2), the proteins encoded by PKD1 and PKD2, respectively, form a complex in which PC1 is supposed to work as a sensor and PC2 as a channel 7. Despite the efforts of several groups over more than 15 years, what exactly PC1 senses and how that information is relayed to PC2 and beyond are still matters of debate 8. In fact, so many pathways have been implicated in PKD, including Ca+2, cAMP, Wnt, JAK2/STAT1/p21, ERK and mTOR 9–14, that one would imagine at least one of them must be true, an assumption questioned by a recent study proposing a yet unidentified signaling pathway to be the real culprit 15.
Furthermore, the link from any of these pathways to cyst formation is again far from clear. While proliferation is required for cyst formation – cysts, as mentioned earlier, are likely the result of clonal expansion – we and others have suggested that it is probably not the whole story 16. One of the reasons for this hypothesis is a set of experiments showing that inactivation of Pkd1 on or before 12 days of age (P12) in an orthologous ADPKD mouse model results in rapid cyst formation within days, but inactivation on or after day 14 (P14) results in delayed-onset cyst formation after months 17. And yet, proliferation rates at P14 are still considerably higher than in adult mice (which have a similar time course of cyst formation than P14 mice). We had also pointed out some inconsistencies, including the delayed-onset phenotype, between results and predictions of another main mechanism postulated for cyst formation: i.e. that PC1 and PC2 are involved in ciliary detection of luminal flow, which would be essential for maintenance of cell polarity and tubular diameter 16. If most explanations for ADPKD seemed incomplete or unsatisfactory, could unbiased HTP and network methods uncover novel relevant pathways/mechanisms?
‘Omics’ data
Charles Babbage, the 19th century mathematician who invented the first mechanical computer, famously wrote in his memories: “On two occasions I have been asked, — ‘ Pray, Mr. Babbage, if you put into the machine wrong figures, will the right answers come out?’ In one case a member of the Upper, and in the other a member of the Lower, House put this question. I am not able rightly to apprehend the kind of confusion of ideas that could provoke such a question.” 18. And thus was born the concept of “garbage in, garbage out”. The informativeness of any network analysis output is necessarily limited by the quality of the underlying dataset used to generate it. While this seems obvious, it is surprising how often, in the excitement of pursuing an “omics” approach to identify novel pathways causing disease, this simple truth has been overlooked. Therefore, a fitting place to begin a review of a field’s progress in this arena is to consider the quality of its studies.
Multiple groups (Table 1) have looked at gene expression data trying to understand ADPKD. The depth and scope of these studies vary considerably, and the items below seem to merit special attention:
-
Samples: studies have used cell lines, patient-derived material, and whole kidneys from rats or mice. Each type of sample provides a unique set of advantages and challenges. Human patient samples would seem ideal since they manifest the disease under investigation. However, ADPKD is characterized by cysts arising from every nephron segment, so comparing “cystic” vs. “control” patient cell lines could mean comparing different nephron segments, a fact rarely acknowledged or explicitly controlled for. Furthermore, these cysts, even if isolated from small cysts, may come from patients with chronic kidney disease, where uremia is likely to superimpose additional changes in gene expression patterns, hindering the identification of PKD-specific/early changes. Genetic and clonal heterogeneity (if using cell lines) are other confounders. Finally, because these studies use cysts as their source material, they are unlikely to capture the genetic signature of the earliest dysregulated pathways that result from inactivation of PKD genes that precede obvious cyst formation.
The use of rodent models circumvents some of these issues. One can obtain samples at any stage of disease, one can control for genetic heterogeneity, and one can minimize ascertainment bias by evaluating an entire kidney. They pose other problems, however: genetic heterogeneity (if the background is not controlled), inconsistent rates of inactivation (when conditional knockout models are used), contamination by non-cystic cells when whole kidneys are used as samples, and, even in the absence of obvious problems, the uncertainty of how closely they model the human disease.
Sample size: part of the scientific method is extrapolating from the anecdotal to the general, often through experiments involving sets of representative samples. While it may be hard to decide what is a realistic sample size, it is hard to argue that there need be no replicates. It is therefore not surprising that when low numbers are used, the results are not even consistent within the same study. Husson et al.19, for instance, used one control and one mutant cell line for either kidney or biliary epithelial cells and identified by SAGE 250 differentially expressed genes, which were then spotted on a custom array for the analysis of 14 human kidneys (8 mutant). Differential expression was confirmed in only 74 genes, 12 of which showed discordant (opposite) results with the SAGE patterns. Other studies are less straightforward in the description of their methods, and in a few cases the number of samples is not even reported 20, 21, 22.
Analysis: while one should be able to assume that the data were properly analyzed, it is not necessarily realistic to expect that the reviewers for every publication re-analyzed the data and confirmed the results. In fact, it is not safe to assume that data are available, nor that, if available, the results can be reproduced, as a repeatability study by Ioannidis et al. showed 23. PKD research is no exception. Re-analysis 24 of some of the published datasets identified methodological problems. Chen et al. 25, for instance, included in their analysis one sample that seemed to be an outlier (GSM339412) and another with likely hybridization artifacts (GSM339408). Pandey et al. 26 report results in which the “p” value was not corrected for multiple comparisons and identify differentially expressed genes with expression values within the range of the background that may not even be expressed in their samples.
Hypothesis-driven interpretation: much of the allure of gene array comes from the idea that one can find unsuspected, yet relevant, players. There are, however, two potential sources of biases: 1) not all genes are represented equally in the published literature, so “unbiased” approaches that rely on published data – as they must, if one wants to annotate findings – are more likely to find links and generate hypothesis centered around highly studied genes/pathways; 2) the experimental design may include samples so different that almost all genes are differentially expressed, and one is left to choose among all the possible differences, often based on prior assumptions. The study of Song et al. is perhaps an example of the latter: about 64% of 100,000 random sets of 50 probes (out of the 54,675) classify all samples used in the study correctly into minimally cystic vs. larger cysts (Menezes, unpublished data). This doesn’t mean that the identified differences are not real, but highlights the problem of pinpointing which of those differences are actually meaningful, particularly when constructing a plausible “story” that explains the data. Another problem with such datasets is that if the researcher looks at the data trying to find evidence that pathway X is altered, it is likely that such evidence will be found.
Table 1.
Gene expression studies in ADPKD.
| Ref. | Model | Sample size | Platform/ Method |
Goal | Main findings | Publication date |
|---|---|---|---|---|---|---|
| 27 | ADPKD patients and normal human kidney cells | Total 6: 3 mutant 3 control | BD Biosciences Clontech Atlas cDNA nylon array | Identify changes in genes involved in extracellular matrix function | β4 integrin and laminin 5 are aberrantly expressed | 2003 |
| 19 | ADPKD patients; cell lines | Total 4 (1 of each group): normal & cystic kidney cell line; normal & cystic biliary cell line | SAGE | define the differences at the molecular level between normal and cystic epithelia | 205 differentially expressed cDNAs | 2004 |
| 19 | ADPKD patients; cell lines | Total 14: 8 ADPKD kidneys; 6 normal | 205 cDNAs spotted array | validate SAGE results | 74 differentially expressed cDNAs, several with discordant results between SAGE and spotted array (up-regulated in one, down-regulated in the other) | 2004 |
| 29 | ADPKD patients | Total 41: 12 kidneys with end-stage PKD; 13 chronically rejected renal allografts; 16 normal renal tissues | 7 K cDNA microarray | differentiate polycystic kidneys in renal failure from normal kidneys and chronically rejected transplants | A total of 87 genes were specifically regulated in ADPKD; 26 of these 87 genes were typical for smooth muscle, likely from increased fibroblasts, possibly due to epithelial-to-myofibroblast transition (EMT) | 2006 |
| 28 | Han:SPRD rat | Total 8: 4 cy/cy; 4 wild type littermates | Agilent 60-mer rat oligomicroar-ray kit | systematic analysis of the global transcriptomal pattern | Among the 350 genes identified as being upregulated, ~30 genes involved in extracellular matrix metabolism. | 2006 |
| 30 | Pkd1 null mice (placenta) | Total 14: 3 littermate pairs at 15.5 d.p.c; 4 pairs at 14.5 d.p.c. | cDNA glass slide microarrays spotted with the NIA 15K gene set | understand the placental abnormalities resulting from inactivation of Pkd1 | dysregulated apolipoprotein expression, enhanced Hnf4α activity | 2006 |
| 22 | Cultured cells from ADPKD kidneys and normal human kidney (HNK) | Not available | Affymetrix HG-U133 Plus 2.0 arrays | compare relative expression of 38,500 known human genes between ADPKD and NHK cells. | Focused on ECM molecules | 2008 |
| 25 | Pkd1 hypo-expressing mouse line (kidney) | Total 13 pairs: progressively larger cysts: PNW1, n = 3; PNW2, n = 4; PNW3, n = 3; PNW3.5, n = 3 | Not available | understand disease progression | Genes in several categories, including immune defense, cell structure and motility, cellular proliferation, apoptosis and metabolic processes, and members of Wnt, Notch, and BMP pathways | 2008 |
| 31 | ADPKD patients | Total 18: Cells from cysts of different sizes (<1 ml, n = 5; 10–20 ml, n = 5; >50 ml, n = 3) and minimally cystic tissue (MCT, n = 5) | Affymetrix HG-U133 Plus 2.0 arrays | elucidate the molecular pathways that modulate renal cyst growth in ADPKD | Of the 637 pathways tested, found 212 (128 up- and 84 down-regulated) pathways were dysregulated in the renal cysts | 2009 |
| 20 | Han:SPRD and control rat kidneys at P3 and P7 | Total 9: 1 male of each genotype (+/+, Cy/+, and Cy/Cy) at post-natal day 3; 2 males of each genotype (+/+, Cy/+, and Cy/Cy) at post-natal day 7 | Agilent Rat Oligo Microarrays | identify the abnormally altered signaling pathways in early-stage cystic kidneys | RXR-mediated pathways | 2010 |
| 21 | PKD2 transgenic mice (kidney) | Not available; animals of 6, 12 and 18 months of age | UniSet Mouse Expression Bioarray | profile the gene expression related to inflammation and cystogenesis | s100a8 and s100a9 up-regulation | 2010 |
| 26 | Pkd1 null mice (embryonic kidneys) | Total 12: 3 pairs at E14.5; 3 pairs at E17.5 | Illumina Mouse Sentrix 6 version 2 Beadchips | Identify molecular pathways that modulate renal cyst formation by performing globtal gene expression profiling of embryonic Pkd1 null kidneys and compare to human ADPKD kidney data | dysregulation of developmental, metabolic, and signaling pathways and 9 miRNAs | 2011 |
| 24 | Pkd1 conditional mice (kidney) | Total 70: 36 mutants; 34 controls | Illumina's MouseRef-8 v1.0 or v2.0 BeadChip; Agilent miRNA arrays | understand early stages of cyst formation and identify modifier pathways | metabolic pathways are dysregulated and Hnf4α is a disease modifier; gene network architecture changes and is preserved in mutants | 2012 |
| 52 | Han:SPRD rat; substrains: PKD/Mhm and PKD/US | Total 54: 9 for each group substrain, phenotype (affected cy/+ or wild-type +/+) and gender (male or female). | Affymetrix GeneChip® rat expression array 230A | Use differences in phenotype between strains to identify modifiers | Identified catechol-O-methyltransferase (Comt) as a potential modifier gene and showed that a 3-month treatment with tolcapone, a selective inhibitor of Comt, slowed disease progression. | 2013 |
| 53 | Han:SPRD rat; substrain PKD/Mhm | Total 10: heterozygous (cy/+) and wild type (+/+) 36 days old animals | Affymetrix Rat 230_2 microarrays | profile mRNAs and miRNAs in slowly progressive cystic disease | 3,333 differentially expressed genes | 2013 |
So, with these caveats in mind, what did we learn from all these gene arrays studies? Much less than one would have hoped, with disconcerting small overlap, it turns out. As a cursory look at Table 1 will show, all sorts of pathways/processes were proposed: extracellular matrix defects 22, 27, 28, epithelial-to-myofibroblast transition 29, apolipoprotein expression 30, RXR pathways 20, and various miscellaneous, broad functional categories involving signaling, metabolic and developmental pathways 24, 26, 31. What wasn’t identified is a direct link between Pkd1/PC1 and any of these changes, nor an encompassing model of how each of the proposed pathways comes to be dysregulated. Perhaps this is all due to methodological/experimental design issues. But perhaps this suggests that there is no such linear model of one single pathway cascading down and bifurcating into various downstream effects/effectors, but rather small changes, too small to detect or value, compound into something like a phase-shift from normal to pathological.
A small number of proteomics studies were also performed (Table 2). A few analyzed cystic fluid 32–34 or exosome-like vesicles 35 to understand PKD pathogenesis. While such studies generated lists of differentially expressed proteins, even with some overlap (such as apolipoproteins and SERPINs), not many new insights seemed to emerge. Additional studies focused on urinary proteomics with the dual goal of identifying specific biomarkers and prognostic markers. The former was reasonably successful, with Kistler et al. 36 reporting a support vector machine (SVM) model with 142 peptides that identifies ADPKD urine with 84.5% sensitivity 90.8% specificity. Finding prognostic predictors proved less straightforward, but Kistler et al. developed predictive models which are being prospectively evaluated as new measurements of kidney volume and function continue to be gathered for some of the patients in their study 36. Liu et al. analyzed the phospho-proteome of ADPKD kidneys 37, and identified 38 dysregulated proteins, a number which, if one considers that EGF alone can trigger the phosphorylation of ~2,000 proteins 38, seems unrealistically small, suggesting that the sensitivity of the study may not have been optimal.
Table 2.
Proteomics and phospho-proteomics studies in ADPKD.
| Ref. | Model | Sample size | Main Findings | Publication date |
|---|---|---|---|---|
| 37 | human kidney tissue | Total 10: 5 cystic kidneys; 5 controls | 38 phospho-proteins | 2008 |
| 32 | human kidney cyst fluid | Total 5: cyst fluid samples of 4 ADPKD patients | 150 proteins (common to 3/5 of cysts) | 2008 |
| 34 | hepatic cyst fluid in a rodent model of autosomal recessive polycystic kidney disease, heterozygous (BALB/c-cpk/+) mice | Total 4: 1 pooled sample from 3 mice; 3 samples from multiple cysts of 1 individual mouse. | 123 identified protein groups | 2009 |
| 54 | ADPKD patients (urine) | Total 853: 41 ADPKD patients; 437 healthy controls; 375 patients with other kidney diseases | support vector machine (SVM) using 38 peptides identified ADPKD urine with variable specificity (68.5% to 95.3%) in different sample cohorts. | 2009 |
| 35 | human urinary exosome-like vesicles (ELVs), fraction enriched for PC1 and PC2 | Total 4: pooled ELVs from 4 healthy volunteers | 552 proteins | 2009 |
| 33 | human kidney cyst fluid | Total 5:4 ADPKD patients (same samples used in 32) | Albumin-bound proteome: 142 proteins (44 common to 2/4 cysts) | 2009 |
| 55 | ADPKD patients (urine) | Total 178: 54 ADPKD patients with slightly reduced eGFR (95.5±27.7 ml/min per 1.73 m2); 10 ADPKD patients on dialysis; 68 patients with other kidney diseases; 46 healthy volunteers | profile of 51 proteins predicted ADPKD 85.0±3.1% accuracy | 2011 |
| 56 | ADPKD patients (urine) | Total 60: 30 ADPKD patients; 30 healthy controls | 155 proteins with different levels in ADPKD | 2012 |
| 36 | ADPKD patients (urine) | Total 1,048: 292 ADPKD patients; 481 patients with non-cystic renal disease; 275 healthy controls | support vector machine (SVM) model using 142 peptides identified ADPKD urine with 84.5% sensitivity 90.8% specificity; prognostic predictor models still being evaluated | 2013 |
A few studies performed metabolic profiling of either urine or plasma samples (Table 3). While the models were different, some of the likely dysregulated pathways were identified in more than one study, and subsequent metabolic profiling of Pkd1−/− cells conditioned media 39 suggested abnormal glucose and lactate concentrations, consistent with altered metabolism in some of the pathways identified by the in vivo metabolomics studies. These results are consistent with the idea that metabolic changes may be integral to PKD, a hypothesis further discussed in the next section (Networks). Another contribution of metabolomics was that it generated lists of potential biomarkers, but more work is necessary to validate these findings.
Table 3.
Metabolomics studies in ADPKD.
| Ref. | Model | Sample size | Main Findings | Publication date |
|---|---|---|---|---|
| 57 | jck female mice urine samples | Total 57: mutant--10, 9, and 10 wild-type mice--9, 10, and 9; age 26, 45, and 64 days | 84 metabolites, suggestive of altered activity in purine metabolism; amino, sugar, and nucleotide sugar metabolism; pentose and gluconuronate interconversions; pentose phosphate pathway;trypthophan metabolism; glucosinolate metabolism | 2010 |
| 58 | Han:SPRD rat plasma samples | Total 10: 5 Cy+/− mutants; 5 littermate controls | 41 metabolites, including proposed new biomarkers (2-deoxycytidine and decanoate) | 2011 |
| 59 | rat urine samples | Total 13: 6 LPK rats; 7 Lewis control rats | ~100 identified metabolites; 12 most discriminating metabolites included 2-ketoglutaric acid, uric acid, allantoin, glucose and hippuric acid | 2012 |
| 24 | mouse urine samples | Total 84: 38 Pkd1 mutant mice | 84 metabolites with KEGG ids, suggestive of altered activity in tyrosine metabolism, oxidative phosphorylation and purine metabolism | 2012 |
Networks
As mentioned earlier, we had previously shown that the kinetics of cyst formation after Pkd1 inactivation in mice was extremely sensitive to the age of the mice; in our hands, specifically between days 12 (P12) and 14 (P14) of age 17. After ruling out some of the obvious explanations for this phenomenon (inactivation rate and proliferation), we set out to understand what happened during the P12-P14 interval that had such a drastic modifier effect on PKD. We focused on gene expression changes and used a large number (70) of genetically homogeneous mice 24. Gene-list strategies were not that enlightening, so we turned to network approaches.
As one thinks of networks, there seems to be different views of what they represent. There is an unrestrictive view where everything is considered part of some network. In this sense, all studies are network studies. Or, at least, they add information to a large network of interconnected knowledge that one taps when trying to assign meaning to data. A restrictive view understands network synthesis as a sort of blueprint wire diagram connecting all relevant components of a system. In theory, an alien with such a blueprint could simulate everything that goes on in that system, without ever seeing it. The former view is too broad to be of any use, the latter feels a bit like Mein Herr’s map in Lewis Carroll’s story: so comprehensive that it was it was made “on the scale of a mile to a mile” 40. We take a very modest approach: can one learn anything by looking at networks “on the scale of an atom to a mile”?
To our knowledge, ours 24 is so far the only study that applied co-expression network analysis (WGCNA) 41 to PKD. The hypothesis is simple: if many genes are differentially expressed, but few have significant fold changes, maybe a multitude of minor alterations adds up to significant biological effects. When we looked at a large dataset of mice with induced deletion of Pkd1 within the first week of life, this seemed to be indeed the case: few genes were highly over/under-expressed at the early stages of cyst formation, but the changes were enough to confer a distinct gene expression pattern that clustered mutant and controls separately. Analyzing co-expression of genes across conditions, we clustered genes into sets (gene modules) that behaved similarly under different conditions (age and genotype status). WGCNA then allows these modules to be represented by a single “eigengene”, which is basically the same sort of trick that allows one to watch a soccer game by focusing on the ball and players, rather than keeping track of all the individual atoms. Usual microarray analysis would try to make sense of all the atoms, which is in theory possible, but may be misleading, if one inadvertently focuses on the atoms of the banana peel that an unhappy fan threw on the court. By determining how these gene modules interact with each other, one can then extract some guiding principles (like inferring that the game is basketball, not soccer, if one module keeps bouncing up and down while larger modules run back and forth).
Our analysis provided several interesting insights into PKD biology. First, from a gene network perspective, mutant kidneys are not that dissimilar from normal kidneys: genes and gene modules seem to be similarly correlated in both conditions. While this is perhaps a bit counterintuitive (given the distinct gene profiles), it actually makes sense: clusters of highly correlated genes remain highly correlated, and highly correlated clusters tend to remain correlated. The lack of change in correlation patterns supports the notion that one could, in theory, try to revert a cystic phenotype without running into the problem of having to globally re-wire gene connections. In contrast to the network preservation between mutant and controls, module correlations changed between P12 and P14 in both wild type and control mice. This seemed remarkable: there was more network re-wiring during the 2-day kidney maturation phase than during cystogenesis (Figure 1). Furthermore, wild type and mutant animals seemed to have the same changes in gene network structure during development, suggesting that the epithelium in PKD is not dedifferentiating, but rather develops normally. This conclusion is consistent with the observation that cystic kidneys undergo a normal age-dependent decrease in proliferation 24. Finally, the main module that changed correlation between P12 and P14 was enriched in metabolic pathways, suggesting for the first time that the exquisite age-sensitivity of Pkd1 inactivation could be due to the metabolic status.
Figure 1. Changes in gene networks reflect ageing rather than Pkd1 inactivation.

Dendogram summarizing correlation structure of WGCNA module eigengenes and corresponding kidney histology. Results suggest that the network structure changes more dramatically with age than with genotype, in contrast to kidney morphology (arrows: dilated tubes and kidney cysts; red line: arbitrary cut height of dendrogram, separating clusters of correlated eigengenes). Modified from 24.
Validating networks
As mentioned above, networks come in different flavors: from the very specific/detailed to the very generic. Davidson’s diagrams for sea urchin development fall in the first category, where validation is intrinsic to network construction 42. In this schema, gene A is inferred to determine the expression of gene B. If gene A is knocked out and B’s expression is changed as predicted, the network relationship is confirmed; otherwise the model is refuted. In contrast, “low magnification” networks, such as the results we just described, are not as easily validated. Here, failure to validate doesn’t necessarily mean the model is wrong: there could always be additional modifiers one didn’t take into account. This boils down to a philosophical argument: is the failure to design experiments that can falsify a model grounds for excluding it from science? According to Popper, science makes universal predictions that should be falsifiable 43. In this sense, WGCNA (and, in fact, much of biology, as Stamos pointed out 44) is not “genuine science”.
A more lenient and pragmatic view is to gauge scientific validity based on whether predictions can be made and then experimentally checked 45, where “validation” is not a yes/no answer, but measured by the distance between the inferred and the hypothesized “real” network (itself an investigator-derived model that could be wrong). Whether these are realizable goals is outside the scope of this review, but the reader should bear in mind that when one says that a network was validated, there may not be a real consensus of what this statement actually means.
Yet another approach is to try to validate/falsify the predictions, not necessarily the networks. It may be the case that the network itself is just a scaffold which one uses to build a useful theory of the phenomenon. That done, the scaffold is taken apart and the real job is to poke holes at the theory. In our study, whether the genes in the relevant clusters are really those exact genes, or whether the correlations really have those exact values, is to some extent irrelevant to PKD biology: what really matters is whether the novel understanding of PKD is true or misleading. If many instances of the former happen when using network methods to various phenomena, one may feel more confident that using such methods will bear fruits, but it will still likely not prove that the networks are “true”. This view has the advantage that one can anchor the experiments on the more relevant predictions, which may not necessarily be the most informative, from a network-building perspective.
That said, did any of our network predictions pan out? We identified metabolic pathways as likely modifiers, while at the same time more traditional gene-list knowledge-based network algorithms suggested that literature links between Hnf4α and PKD differentially expressed genes occurred more often than chance would predict. We reasoned that if metabolic pathways were modifiers, Hnf4α, given its known role as a metabolic regulator, would be a good target for perturbation. Consistent with this prediction, knocking out Hnf4α in the context of Pkd1 inactivation changed the disease severity 24. Subsequently, Rowe et al. showed that manipulating glycolysis in PKD altered the phenotype 39. Additional studies in our lab are further testing the role of metabolic manipulation in PKD, but the results so far seem to support the notion that metabolic changes may underlie PKD biology.
Future Directions
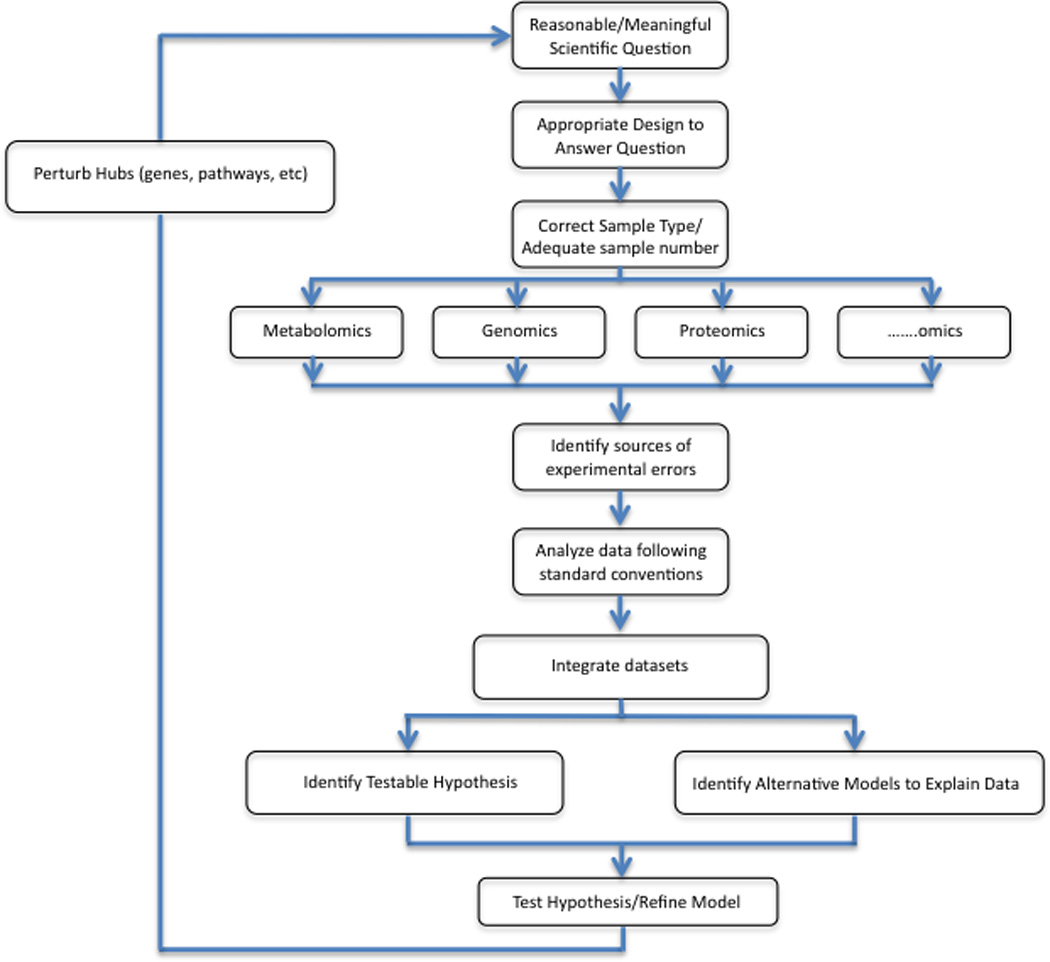
So where do we go from here? In Box 1, we provide a conceptual framework for moving forward. This approach can be used to understand PKD pathobiology using a wide variety of models and types of HTP data. The key elements include a clear articulation of the question to be addressed, a research design appropriate to answer it, HTP data capture from a sufficiently large number of samples, integration of the newly acquired data with other datasets, hypothesis generation and experimental validation by perturbation of hubs or factors predicted to be relevant.
Box 1: Diagram highlighting the proposed strategy to generate and analyze data.
Everything follows a well-posed and meaningful question. For PKD, relevant questions might be, can we identify all of the genes/factors required to maintain a tubule, or identify factors that modulate cystic disease severity or determine why some forms of PKD present with large cystic kidneys and others with smaller, fibrocystic patterns? The question should naturally guide experimental design and sample selection. This might mean comparing samples from a simple cell culture system under a variety of conditions or kidney specimens from humans and a variety of orthologous animal models. Regardless of which approach is pursued, it is imperative that the number of specimens for any given condition or analysis be sufficient to control for methodological and biological variability intrinsic to the model and to the experimental method.
After analyzing the data following standard conventions, integrating the new information with what is already known and other available datasets is key. This may mean looking at the same type of data across conditions or models (ie. gene expression), integrating different types of data (ie. metabolomics, proteomics and microarray) from a single model system, or in the most comprehensive approach, seeking to integrate all possible data for multiple different types of animal and cell culture models. Ultimately, the goal is to identify both obvious testable hypotheses and, equally important, less obvious alternative hypotheses that address seemingly incompatible aspects of the data. The latter are particularly invaluable as they may provide the most novel insights into the phenomena. The final step in this algorithm is to use the hypotheses to identify manipulations that can be introduced into the system and then reassessed in an iterative manner.
There are a few additional caveats to keep in mind. As discussed in the text, the investigator may not necessarily be interested in networks and correlations between obscure pathways; conversely, the “computer” may not be interested in some gene inconsistently detected above background. However, if the investigators know that this obscure gene happens to be Pkd1, as in our dataset, manipulating it might be a reasonable thing to do. It also is important to note that much of the data to be integrated is not completely comparable: genomic changes may not be converted into the corresponding proteomic change, and vice versa. Integrating data is therefore not as simple as looking at concordance of results, but should include assigning probabilities to the accuracy and representativeness of the results and then building models that explain the result. For instance, if a protein is predicted, with 100% certainty, to be up-regulated but the proteomics show with 100% certainty that it is down-regulated, the investigator/algorithm should be able to conclude that degradation pathways are enhanced, and then test this hypothesis. Finally, designing studies that seek to understand inconsistencies not due to experimental or methodologic errors may pose a practical conundrum to the investigator. He/she may find it tempting to focus on studies that support “widely accepted” hypotheses as these may be easier to publish, but the field might move forward in a more meaningful direction if hypotheses that break models were prioritized. We believe that identifying alternative models that explain the data and using a Bayesian framework to score them seems a good compromise.
One interesting approach would be to use this strategy to compare the different forms of cystic renal disease. While autosomal dominant polycystic kidney disease is by far the most common form of PKD, many other conditions have renal cysts as a prominent phenotypic feature. In fact, renal cysts are now considered one of the characteristic manifestations of “ciliopathies”, a relatively newly recognized group of disorders that result from defects in the function of the primary cilia 46. The primary cilium is a microtubule-based structure that protrudes from the surface of most cells and is thought to function as a cellular sensor. Most forms of renal cystic disease, including ADPKD, are thought to result from dysfunction of ciliary factors or ciliary-regulated signaling systems. Mutations in over 30 genes have been linked to ciliary dysfunction, and proteomic studies have linked some of their gene products in protein networks 47. The mutant genes are associated with a broad range of phenotypes besides renal cysts, and the genes that encode interacting proteins often result in the most similar clinical presentations when mutated.
There are a number of unsolved mysteries, however. In some cases, mutations of a single gene can result in either a mostly fibrotic or mostly cystic kidney. In the case of Pkd1 and Pkd2 mouse mutants, renal cysts arise long before they are observed in mice lacking cilia in the kidney due to induced loss of other ciliary genes 16 suggesting additional non-ciliary functions for PC1 and PC2. Interestingly, acquired disruption of ciliary function in Pkd1 mutant mice actually lessens disease severity. These data suggest that too little or too much ciliary signaling can cause cystic disease, depending on context. Finally, it is poorly understood how most of the proteins encoded by “ciliopathy” genes actually cause cysts to form.
HTP studies might help provide answers. By systematically examining all cystic diseases at pre-, early and later stages, one might identify pathways common to all that are the key final steps essential for cyst formation. These pathways would make ideal targets for therapies that are universally effective for all forms of cystic disease. Likewise, one might identify patterns unique for each disease gene, and buried within these might be clues to the gene’s actual function. In the composite, an integrated, systematic analysis of all of the models would likely generate a comprehensive picture of the many factors and pathways whose coordinated activity function to regulate tubular diameter.
As highlighted in the prior sections, there are unfortunately at least two major barriers to pursuing this approach. The first is the current state of the data. While numerous studies have been performed using multiple models, their variable quality and methodology greatly limits what can be currently achieved. The “Babbage dictum” warns us of the dangers of pursuing this approach. The second problem is that even if the data were available, methods to test the network maps are limiting. Perturbing gene function in mice is expensive, time-consuming and relatively low-throughput (even with CRISPR technology) limiting its value. Zebrafish might be an alternative model organism but has other drawbacks. Mammalian renal epithelial cells are topped by a single apical primary cilium while zebrafish renal tubules are lined with cells with motile cilia. What affect this might have is difficult to predict. Another problem is that there is a reasonable likelihood that changes in the architecture/logic of transcriptional networks is an important facet of evolution, so developmental signaling pathways may not be precisely preserved 48. Finally, the zebrafish phenotype is still incompletely understood. For example, Pkd2 morpholinos are reported to cause renal cysts but germline mutation of Pkd2 does not 49. Curiously the cystic phenotype is incompletely penetrant in Pkd1 morphants despite complete knock-down of Pkd1 gene expression 50.
Does this mean that there is no way forward? We think one practical alternative might be to use a simple cell culture model that accurately encapsulates key features of the disease and then design experiments to iteratively go through steps of HTP data acquisition, prediction making, perturbation (knocking down key players, for instance), and then repeating. Key network nodes can then be tested in relevant rodent models. This is expensive/hard work, and requires reproducible readouts that represent likely disease outcomes, but it might be the only practical way forward to move HTP data from lists of things (genes, proteins, metabolites) to meaningful systems of important functional networks.
Finally, one can also use HTP methods to test well-founded hypotheses, but the analysis should perhaps be different than what historically has been done. Unlike single experiments, here one can simultaneously look at several different hypotheses/explanations, so one is in reality not testing hypothesis H1 (pathway X is relevant) versus H0 (pathway X is not relevant), but rather asking which of the possible testable hypotheses H1….Hn best explains the results. This transports the problem from the realm of inferential statistics (where all the alternative hypothesis are treated equally), to the realm of Bayesian statistics, where priors (knowledge, probabilities, etc) have to be taken into account 51. This approach also has the advantage that it naturally incorporates new data to update priors. If, for instance, one has reasons to believe that pathway X should be altered, the failure to see changes in several experiments should update the way one analyzes new data in such a way that new instances in which pathway X is seen as differentially regulated are “weighed down”, rather than up, as currently done.
As a systems approach to PKD goes through its toddler years, the challenge for biologists is to design “plug-n-play” experimental platforms that can be easily used by the whole community, adopt these platforms to generate a common language of results, and apply the best available tools to analyze the data. The challenge for the bioinformatics community is to come up with user-friendly ways to analyze complex datasets creating interfaces in which biological knowledge flow into and out of the statistical models. The ultimate judgment about the virtues of this approach will hang on its ability to generate new, robust network maps that can be used to predict biology and to identify novel therapeutic opportunities.
Acknowledgement
This research was supported by the Intramural Research Program of the NIH, The National Institute of Diabetes and Digestive and Kidney Diseases (NIDDK), grant 1ZIADK075042-05.
References
- 1.Barabási A, Oltvai Z. Network biology: understanding the cell's functional organization. Nat Rev Genet. 2004;5:101–113. doi: 10.1038/nrg1272. [DOI] [PubMed] [Google Scholar]
- 2.Barabási AL, Gulbahce N, Loscalzo J. Network medicine: a network-based approach to human disease. Nat Rev Genet. 2011;12:56–68. doi: 10.1038/nrg2918. [DOI] [PMC free article] [PubMed] [Google Scholar]
- 3.Neumann HP, Jilg C, Bacher J, Nabulsi Z, Malinoc A, Hummel B, Hoffmann MM, Ortiz-Bruechle N, Glasker S, Pisarski P, et al. Epidemiology of autosomal-dominant polycystic kidney disease: an in-depth clinical study for south-western Germany. Nephrol Dial Transplant. 2013;28:1472–1487. doi: 10.1093/ndt/gfs551. [DOI] [PubMed] [Google Scholar]
- 4.Pei Y, Watnick T. Diagnosis and screening of autosomal dominant polycystic kidney disease. Adv Chronic Kidney Dis. 2010;17:140–152. doi: 10.1053/j.ackd.2009.12.001. [DOI] [PMC free article] [PubMed] [Google Scholar]
- 5.Qian F, Watnick TJ, Onuchic LF, Germino GG. The molecular basis of focal cyst formation in human autosomal dominant polycystic kidney disease type I. Cell. 1996;87:979–987. doi: 10.1016/s0092-8674(00)81793-6. [DOI] [PubMed] [Google Scholar]
- 6.Pei Y, Watnick T, He N, Wang K, Liang Y, Parfrey P, Germino G, St George-Hyslop P. Somatic PKD2 mutations in individual kidney and liver cysts support a "two-hit" model of cystogenesis in type 2 autosomal dominant polycystic kidney disease. J Am Soc Nephrol. 1999;10:1524–1529. doi: 10.1681/ASN.V1071524. [DOI] [PubMed] [Google Scholar]
- 7.Gallagher AR, Germino GG, Somlo S. Molecular advances in autosomal dominant polycystic kidney disease. Adv Chronic Kidney Dis. 2010;17:118–130. doi: 10.1053/j.ackd.2010.01.002. [DOI] [PMC free article] [PubMed] [Google Scholar]
- 8.Watnick TJ, Germino GG. Polycystic kidney disease: Polycystin-1 and polycystin-2--it's complicated. Nat Rev Nephrol. 2013;9:249–250. doi: 10.1038/nrneph.2013.73. [DOI] [PubMed] [Google Scholar]
- 9.Hanaoka K, Qian F, Boletta A, Bhunia A, Piontek K, Tsiokas L, Sukhatme V, Guggino W, Germino G. Co-assembly of polycystin-1 and -2 produces unique cation-permeable currents. Nature. 2000;408:990–994. doi: 10.1038/35050128. [DOI] [PubMed] [Google Scholar]
- 10.Yamaguchi T, Pelling J, Ramaswamy N, Eppler J, Wallace D, Nagao S, Rome L, Sullivan L, Grantham J. cAMP stimulates the in vitro proliferation of renal cyst epithelial cells by activating the extracellular signal-regulated kinase pathway. Kidney Int. 2000;57:1460–1471. doi: 10.1046/j.1523-1755.2000.00991.x. [DOI] [PubMed] [Google Scholar]
- 11.Lal M, Song X, Pluznick J, Di Giovanni V, Merrick D, Rosenblum N, Chauvet V, Gottardi C, Pei Y, Caplan M. Polycystin-1 C-terminal tail associates with beta-catenin and inhibits canonical Wnt signaling. Hum Mol Genet. 2008;17:3105–3117. doi: 10.1093/hmg/ddn208. [DOI] [PMC free article] [PubMed] [Google Scholar]
- 12.Kim E, Arnould T, Sellin L, Benzing T, Fan M, Grüning W, Sokol S, Drummond I, Walz G. The polycystic kidney disease 1 gene product modulates Wnt signaling. J Biol Chem. 1999;274:4947–4953. doi: 10.1074/jbc.274.8.4947. [DOI] [PubMed] [Google Scholar]
- 13.Bhunia A, Piontek K, Boletta A, Liu L, Qian F, Xu P, Germino F, Germino G. PKD1 induces p21(waf1) and regulation of the cell cycle via direct activation of the JAK-STAT signaling pathway in a process requiring PKD2. Cell. 2002;109:157–168. doi: 10.1016/s0092-8674(02)00716-x. [DOI] [PubMed] [Google Scholar]
- 14.Distefano G, Boca M, Rowe I, Wodarczyk C, Ma L, Piontek K, Germino G, Pandolfi P, Boletta A. Polycystin-1 regulates extracellular signal-regulated kinase-dependent phosphorylation of tuberin to control cell size through mTOR and its downstream effectors S6K and 4EBP1. Mol Cell Biol. 2009;29:2359–2371. doi: 10.1128/MCB.01259-08. [DOI] [PMC free article] [PubMed] [Google Scholar]
- 15.Ma M, Tian X, Igarashi P, Pazour GJ, Somlo S. Loss of cilia suppresses cyst growth in genetic models of autosomal dominant polycystic kidney disease. Nat Genet. 2013;45:1004–1012. doi: 10.1038/ng.2715. [DOI] [PMC free article] [PubMed] [Google Scholar]
- 16.Menezes L, Germino G. Polycystic kidney disease, cilia, and planar polarity. Methods Cell Biol. 2009;94:273–297. doi: 10.1016/S0091-679X(08)94014-0. [DOI] [PubMed] [Google Scholar]
- 17.Piontek K, Menezes L, Garcia-Gonzalez M, Huso D, Germino G. A critical developmental switch defines the kinetics of kidney cyst formation after loss of Pkd1. Nat Med. 2007;13:1490–1495. doi: 10.1038/nm1675. [DOI] [PMC free article] [PubMed] [Google Scholar]
- 18.Babbage C. Passages from the life of a philosopher. Rutgers University Press; 1994. (Orginally published in 1864) [Google Scholar]
- 19.Husson H, Manavalan P, Akmaev V, Russo R, Cook B, Richards B, Barberio D, Liu D, Cao X, Landes G, et al. New insights into ADPKD molecular pathways using combination of SAGE and microarray technologies. Genomics. 2004;84:497–510. doi: 10.1016/j.ygeno.2004.03.009. [DOI] [PubMed] [Google Scholar]
- 20.Kugita M, Nishii K, Morita M, Yoshihara D, Kowa-Sugiyama H, Yamada K, Yamaguchi T, Wallace D, Calvet J, Kurahashi H, et al. Global gene expression profiling in early-stage polycystic kidney disease in the Han:SPRD Cy rat identifies a role for RXR signaling. Am J Physiol Renal Physiol. 2010 doi: 10.1152/ajprenal.00470.2010. [DOI] [PubMed] [Google Scholar]
- 21.Park EY, Seo MJ, Park JH. Effects of specific genes activating RAGE on polycystic kidney disease. Am J Nephrol. 2010;32:169–178. doi: 10.1159/000315859. [DOI] [PubMed] [Google Scholar]
- 22.Wallace DP, Quante MT, Reif GA, Nivens E, Ahmed F, Hempson SJ, Blanco G, Yamaguchi T. Periostin induces proliferation of human autosomal dominant polycystic kidney cells through alphaV-integrin receptor. Am J Physiol Renal Physiol. 2008;295:F1463–F1471. doi: 10.1152/ajprenal.90266.2008. [DOI] [PMC free article] [PubMed] [Google Scholar]
- 23.Ioannidis JP, Allison DB, Ball CA, Coulibaly I, Cui X, Culhane AC, Falchi M, Furlanello C, Game L, Jurman G, et al. Repeatability of published microarray gene expression analyses. Nat Genet. 2009;41:149–155. doi: 10.1038/ng.295. [DOI] [PubMed] [Google Scholar]
- 24.Menezes LF, Zhou F, Patterson AD, Piontek KB, Krausz KW, Gonzalez FJ, Germino GG. Network Analysis of a Pkd1-Mouse Model of Autosomal Dominant Polycystic Kidney Disease Identifies HNF4α as a Disease Modifier. PLoS Genet. 2012;8:e1003053. doi: 10.1371/journal.pgen.1003053. [DOI] [PMC free article] [PubMed] [Google Scholar]
- 25.Chen W, Tzeng Y, Li H. Gene expression in early and progression phases of autosomal dominant polycystic kidney disease. BMC Res Notes. 2008;1:131. doi: 10.1186/1756-0500-1-131. [DOI] [PMC free article] [PubMed] [Google Scholar]
- 26.Pandey P, Qin S, Ho J, Zhou J, Kreidberg JA. Systems biology approach to identify transcriptome reprogramming and candidate microRNA targets during the progression of polycystic kidney disease. BMC Syst Biol. 2011;5:56. doi: 10.1186/1752-0509-5-56. [DOI] [PMC free article] [PubMed] [Google Scholar]
- 27.Joly D, Morel V, Hummel A, Ruello A, Nusbaum P, Patey N, Noël LH, Rousselle P, Knebelmann B. Beta4 integrin and laminin 5 are aberrantly expressed in polycystic kidney disease: role in increased cell adhesion and migration. Am J Pathol. 2003;163:1791–1800. doi: 10.1016/s0002-9440(10)63539-0. [DOI] [PMC free article] [PubMed] [Google Scholar]
- 28.Riera M, Burtey S, Fontés M. Transcriptome analysis of a rat PKD model: Importance of genes involved in extracellular matrix metabolism. Kidney Int. 2006;69:1558–1563. doi: 10.1038/sj.ki.5000309. [DOI] [PubMed] [Google Scholar]
- 29.Schieren G, Rumberger B, Klein M, Kreutz C, Wilpert J, Geyer M, Faller D, Timmer J, Quack I, Rump LC, et al. Gene profiling of polycystic kidneys. Nephrol Dial Transplant. 2006;21:1816–1824. doi: 10.1093/ndt/gfl071. [DOI] [PubMed] [Google Scholar]
- 30.Allen E, Piontek K, Garrett-Mayer E, Garcia-Gonzalez M, Gorelick K, Germino G. Loss of polycystin-1 or polycystin-2 results in dysregulated apolipoprotein expression in murine tissues via alterations in nuclear hormone receptors. Hum Mol Genet. 2006;15:11–21. doi: 10.1093/hmg/ddi421. [DOI] [PMC free article] [PubMed] [Google Scholar]
- 31.Song X, Di Giovanni V, He N, Wang K, Ingram A, Rosenblum N, Pei Y. Systems biology of autosomal dominant polycystic kidney disease (ADPKD): computational identification of gene expression pathways and integrated regulatory networks. Hum Mol Genet. 2009;18:2328–2343. doi: 10.1093/hmg/ddp165. [DOI] [PubMed] [Google Scholar]
- 32.Lai X, Bacallao RL, Blazer-Yost BL, Hong D, Mason SB, Witzmann FA. Characterization of the renal cyst fluid proteome in autosomal dominant polycystic kidney disease (ADPKD) patients. Proteomics Clin Appl. 2008;2:1140–1152. doi: 10.1002/prca.200780140. [DOI] [PMC free article] [PubMed] [Google Scholar]
- 33.Mason SB, Lai X, Bacallao RL, Blazer-Yost BL, Gattone VH, Wang KC, Witzmann FA. The biomarker enriched proteome of autosomal dominant polycystic kidney disease cyst fluid. Proteomics Clin Appl. 2009;3:1247–1250. doi: 10.1002/prca.200800163. [DOI] [PMC free article] [PubMed] [Google Scholar]
- 34.Lai X, Blazer-Yost BL, Gattone VH, Muchatuta MN, Witzmann FA. Protein composition of liver cyst fluid from the BALB/c-cpk/+ mouse model of autosomal recessive polycystic kidney disease. Proteomics. 2009;9:3775–3782. doi: 10.1002/pmic.200800379. [DOI] [PubMed] [Google Scholar]
- 35.Hogan MC, Manganelli L, Woollard JR, Masyuk AI, Masyuk TV, Tammachote R, Huang BQ, Leontovich AA, Beito TG, Madden BJ, et al. Characterization of PKD protein-positive exosome-like vesicles. J Am Soc Nephrol. 2009;20:278–288. doi: 10.1681/ASN.2008060564. [DOI] [PMC free article] [PubMed] [Google Scholar]
- 36.Kistler AD, Serra AL, Siwy J, Poster D, Krauer F, Torres VE, Mrug M, Grantham JJ, Bae KT, Bost JE, et al. Urinary proteomic biomarkers for diagnosis and risk stratification of autosomal dominant polycystic kidney disease: a multicentric study. PLoS One. 2013;8:e53016. doi: 10.1371/journal.pone.0053016. [DOI] [PMC free article] [PubMed] [Google Scholar]
- 37.Liu Y, Dai B, Mei C, Zhang Y, Xiong X, Sandford R. Identification of phosphoproteins in kidney tissues from patients with autosomal dominant polycystic kidney disease. Proteomics Clin Appl. 2008;2:1153–1166. doi: 10.1002/prca.200780172. [DOI] [PubMed] [Google Scholar]
- 38.Olsen JV, Blagoev B, Gnad F, Macek B, Kumar C, Mortensen P, Mann M. Global, in vivo, and site-specific phosphorylation dynamics in signaling networks. Cell. 2006;127:635–648. doi: 10.1016/j.cell.2006.09.026. [DOI] [PubMed] [Google Scholar]
- 39.Rowe I, Chiaravalli M, Mannella V, Ulisse V, Quilici G, Pema M, Song XW, Xu H, Mari S, Qian F, et al. Defective glucose metabolism in polycystic kidney disease identifies a new therapeutic strategy. Nat Med. 2013;19:488–493. doi: 10.1038/nm.3092. [DOI] [PMC free article] [PubMed] [Google Scholar]
- 40.Carroll L. Sylvie and Bruno concluded. MacMillan and Co; 1893. [Google Scholar]
- 41.Langfelder P, Horvath S. WGCNA: an R package for weighted correlation network analysis. BMC Bioinformatics. 2008;9:559. doi: 10.1186/1471-2105-9-559. [DOI] [PMC free article] [PubMed] [Google Scholar]
- 42.Oliveri P, Davidson E. Gene regulatory network analysis in sea urchin embryos. Methods Cell Biol. 2004;74:775–794. doi: 10.1016/s0091-679x(04)74032-7. [DOI] [PubMed] [Google Scholar]
- 43.Popper K. The Logic of Scientific Discovery. Routledge; 1959. (reprinted 2002) [Google Scholar]
- 44.Stamos DN. Popper, laws, and the exclusion of biology from genuine science. Acta Biotheor. 2007;55:357–375. doi: 10.1007/s10441-007-9025-6. [DOI] [PubMed] [Google Scholar]
- 45.Dougherty ER. Validation of gene regulatory networks: scientific and inferential. Brief Bioinform. 2011;12:245–252. doi: 10.1093/bib/bbq078. [DOI] [PubMed] [Google Scholar]
- 46.Yuan S, Sun Z. Expanding horizons: ciliary proteins reach beyond cilia. Annu Rev Genet. 2013;47:353–376. doi: 10.1146/annurev-genet-111212-133243. [DOI] [PMC free article] [PubMed] [Google Scholar]
- 47.Nachury MV, Loktev AV, Zhang Q, Westlake CJ, Peränen J, Merdes A, Slusarski DC, Scheller RH, Bazan JF, Sheffield VC, et al. A core complex of BBS proteins cooperates with the GTPase Rab8 to promote ciliary membrane biogenesis. Cell. 2007;129:1201–1213. doi: 10.1016/j.cell.2007.03.053. [DOI] [PubMed] [Google Scholar]
- 48.Payne JL, Wagner A. The robustness and evolvability of transcription factor binding sites. Science. 2014;343:875–877. doi: 10.1126/science.1249046. [DOI] [PubMed] [Google Scholar]
- 49.Sun Z, Amsterdam A, Pazour GJ, Cole DG, Miller MS, Hopkins N. A genetic screen in zebrafish identifies cilia genes as a principal cause of cystic kidney. Development. 2004;131:4085–4093. doi: 10.1242/dev.01240. [DOI] [PubMed] [Google Scholar]
- 50.Mangos S, Lam PY, Zhao A, Liu Y, Mudumana S, Vasilyev A, Liu A, Drummond IA. The ADPKD genes pkd1a/b and pkd2 regulate extracellular matrix formation. Dis Model Mech. 2010;3:354–365. doi: 10.1242/dmm.003194. [DOI] [PMC free article] [PubMed] [Google Scholar]
- 51.Nuzzo R. Scientific method: statistical errors. Nature. 2014;506:150–152. doi: 10.1038/506150a. [DOI] [PubMed] [Google Scholar]
- 52.Boehn SN, Spahn S, Neudecker S, Keppler A, Bihoreau MT, Kränzlin B, Pandey P, Hoffmann SC, Li L, Torres VE, et al. Inhibition of Comt with tolcapone slows progression of polycystic kidney disease in the more severely affected PKD/Mhm (cy/+) substrain of the Hannover Sprague-Dawley rat. Nephrol Dial Transplant. 2013;28:2045–2058. doi: 10.1093/ndt/gft014. [DOI] [PMC free article] [PubMed] [Google Scholar]
- 53.Dweep H, Sticht C, Kharkar A, Pandey P, Gretz N. Parallel analysis of mRNA and microRNA microarray profiles to explore functional regulatory patterns in polycystic kidney disease: using PKD/Mhm rat model. PLoS One. 2013;8:e53780. doi: 10.1371/journal.pone.0053780. [DOI] [PMC free article] [PubMed] [Google Scholar]
- 54.Kistler AD, Mischak H, Poster D, Dakna M, Wüthrich RP, Serra AL. Identification of a unique urinary biomarker profile in patients with autosomal dominant polycystic kidney disease. Kidney Int. 2009;76:89–96. doi: 10.1038/ki.2009.93. [DOI] [PubMed] [Google Scholar]
- 55.Gronwald W, Klein MS, Zeltner R, Schulze BD, Reinhold SW, Deutschmann M, Immervoll AK, Böger CA, Banas B, Eckardt KU, et al. Detection of autosomal dominant polycystic kidney disease by NMR spectroscopic fingerprinting of urine. Kidney Int. 2011;79:1244–1253. doi: 10.1038/ki.2011.30. [DOI] [PubMed] [Google Scholar]
- 56.Bakun M, Niemczyk M, Domanski D, Jazwiec R, Perzanowska A, Niemczyk S, Kistowski M, Fabijanska A, Borowiec A, Paczek L, et al. Urine proteome of autosomal dominant polycystic kidney disease patients. Clin Proteomics. 2012;9:13. doi: 10.1186/1559-0275-9-13. [DOI] [PMC free article] [PubMed] [Google Scholar]
- 57.Taylor SL, Ganti S, Bukanov NO, Chapman A, Fiehn O, Osier M, Kim K, Weiss RH. A metabolomics approach using juvenile cystic mice to identify urinary biomarkers and altered pathways in polycystic kidney disease. Am J Physiol Renal Physiol. 2010;298:F909–F922. doi: 10.1152/ajprenal.00722.2009. [DOI] [PMC free article] [PubMed] [Google Scholar]
- 58.Toyohara T, Suzuki T, Akiyama Y, Yoshihara D, Takeuchi Y, Mishima E, Kikuchi K, Suzuki C, Tanemoto M, Ito S, et al. Metabolomic profiling of the autosomal dominant polycystic kidney disease rat model. Clin Exp Nephrol. 2011;15:676–687. doi: 10.1007/s10157-011-0467-4. [DOI] [PubMed] [Google Scholar]
- 59.Abbiss H, Maker GL, Gummer J, Sharman MJ, Phillips JK, Boyce M, Trengove RD. Development of a non-targeted metabolomics method to investigate urine in a rat model of polycystic kidney disease. Nephrology (Carlton) 2012;17:104–110. doi: 10.1111/j.1440-1797.2011.01532.x. [DOI] [PubMed] [Google Scholar]