

Abstract
The mammalian immune system is a dynamic multiscale system composed of a hierarchically organized set of molecular, cellular, and organismal networks that act in concert to promote effective host defense. These networks range from those involving gene regulatory and protein–protein interactions underlying intracellular signaling pathways and single‐cell responses to increasingly complex networks of in vivo cellular interaction, positioning, and migration that determine the overall immune response of an organism. Immunity is thus not the product of simple signaling events but rather nonlinear behaviors arising from dynamic, feedback‐regulated interactions among many components. One of the major goals of systems immunology is to quantitatively measure these complex multiscale spatial and temporal interactions, permitting development of computational models that can be used to predict responses to perturbation. Recent technological advances permit collection of comprehensive datasets at multiple molecular and cellular levels, while advances in network biology support representation of the relationships of components at each level as physical or functional interaction networks. The latter facilitate effective visualization of patterns and recognition of emergent properties arising from the many interactions of genes, molecules, and cells of the immune system. We illustrate the power of integrating ‘omics’ and network modeling approaches for unbiased reconstruction of signaling and transcriptional networks with a focus on applications involving the innate immune system. We further discuss future possibilities for reconstruction of increasingly complex cellular‐ and organism‐level networks and development of sophisticated computational tools for prediction of emergent immune behavior arising from the concerted action of these networks. WIREs Syst Biol Med 2015, 7:13–38. doi: 10.1002/wsbm.1288
This article is categorized under:
-
1
Analytical and Computational Methods > Computational Methods
-
2
Laboratory Methods and Technologies > Macromolecular Interactions, Methods
INTRODUCTION
Decades of reductionist biological study have resulted in cataloging the enormous numbers of components (genes, gene products, metabolic intermediates, macromolecules, and cells) that make up a living creature, especially complex metazoans. In an effort to place these extensive lists of parts into a coherent framework that helps illuminate their functional and/or structural relationships and that can also help provide insight into how perturbations of the cellular or organismal environment lead to changes in cell or organism behavior, biologists have increasingly invested in building network models of these relationships. A network is an artificial construct that organizes complex multivariate relations in a structured format for systematic mathematical analysis and intuitive visual representation. Nodes and edges are the building blocks of any network, also called a graph, where nodes represent variables and edges represent relationships between the variables. As this is a fairly general concept, network analysis has been applied to several fields, including sociology, air‐traffic, electric power grids, and counter‐terrorism.1, 2, 3 In recent times, network analysis has also been applied extensively in biology, especially in computational and systems biology research.4, 5 In most biological networks, nodes are macromolecules, such as genes, RNAs, proteins, metabolites, or cells, and a given network can be composed of more than one type of macromolecule or cell. The edges in these networks can depict connections between entities under general or specific conditions, and can represent anything from a physical interaction to regulatory or functional relationships.
Comprehensive reviews have appeared on molecular networks and their applications.4, 5, 6, 7, 8, 9 In this article, we focus specifically on network concepts in the context of the immune system, which is composed of many dynamic, multiscalar processes. Immune cells sense infection and other environmental cues through a variety of extracellular and intracellular receptors. Ligation of these receptors leads to signaling cascades consisting of many dynamic processes including signal‐induced protein binding, phosphorylation, degradation, and nuclear localization. These signaling events lead to changes in gene expression, and subsequently to the production of both effector proteins required to combat infection and proteins involved in regulation of the ensuing, potentially host‐damaging, response. The number of molecular players or variables involved in any such activity can vary from hundreds to thousands, making immune responses immensely complex. This complexity is amplified by the multiscalar nature of the immune system, as these signaling and transcriptional responses occur in the context of diverse and dynamic cell–cell interactions. The different types of immune cells, from innate myeloid cells to lymphocytes, receive cues from different classes of receptors, produce distinct effector molecules, and depend on cues from each other as well as from the tissue microenvironment to respond appropriately. Pathogen invasion of host cells further exaggerates this complexity; while immune cells mount an inflammatory response to contain infection, pathogens attempt to evade immune recognition and modulate the host response by secreting a variety of virulence factors. The nature and magnitude of the host immune response is therefore dictated by extensive dynamic molecular and cellular interactions within and between host and pathogen, which can be represented by multiple types of networks.
Given the intricate interactions that underlie immune function, the use of networks as mathematical abstractions of complex relationships is not only suitable but also necessary for understanding immune responses.10, 11 Here, we apply network concepts at different molecular and cellular scales to elucidate some of the unique aspects of the immune system that make it particularly suitable for network‐based studies. In section Molecular Networks, we introduce different types of molecular networks and the resources through which they can be accessed. In section Intracellular Molecular Networks in Innate Immunity, we discuss how application of network analysis methods can provide insights into intracellular molecular networks underlying the innate immune response. In addition to intracellular interactions, crosstalk between immune cells as well as their spatial organization and migration within tissues in vivo are critical to the effective development of innate and adaptive immune responses. These intercellular interactions, which are functions of space and time, are represented as networks in section Intercellular and Organismal Networks. Another unique aspect of immunity, i.e., host–pathogen crosstalk, is represented as interaction between host and pathogen networks in section A Network Perspective of Host‐Pathogen Interactions (HPIs). Each of these areas is large in and of itself and we cannot be comprehensive in this short review; our objective is to introduce general network biology concepts and elucidate how network analysis can be used to represent and interrogate different aspects of the immune system.
MOLECULAR NETWORKS
Network analysis has mostly been applied to biological systems to model macromolecules at the genome scale. In this section, we discuss the general concepts of these molecular networks, available resources, and their applications. Based on the types of macromolecules and the nature of their interactions, networks can be classified into different categories, such as metabolic, gene regulatory, protein–protein interaction (PPI), genetic interaction and signaling networks.7 These networks have been created using a combination of experimental and computational approaches. Technological breakthroughs and computer‐aided automation have enabled high‐throughput experiments and the efficient generation of large unbiased datasets that are particularly valuable for network construction. Molecular networks have also been created by manual curation of vast amounts of existing literature by domain experts. Although this process is painstakingly long and labor intensive, the resulting molecular networks are of good quality with low false‐positive rates. An alternate approach is to apply text‐mining algorithms to scientific articles and abstracts to predict molecular networks. As expected, this strategy may expedite the process of network construction at the cost of increased false‐positive rates. A list and brief description of databases for gene regulatory, PPI, and signaling networks is provided in Table 1.
Table 1.
A List of Some of the Widely Used Resources for Different Types of Networks and Their Availability
| Name | Website | Description | |
|---|---|---|---|
| Transcription regulatory network | TRANSFAC12 | http://www.gene-regulation.com/pub/databases.html | Most comprehensive database with public and professional (requires subscription) versions. The professional version contains information on ∼20k transcription factors (TFs), ∼80k target genes, ∼40k DNA sites, and ∼300k promoter sequences. |
| AnimalTFDB13 | http://www.bioguo.org/AnimalTFDB/ | A database of TFs classified into 72 families based on their DNA‐binding domains predicted in 50 sequenced animal genomes. Also contains information on transcription cofactors and chromatin remodeling factors from these genomes. | |
| TFdb14 | http://genome.gsc.riken.jp/TFdb/ | Enlists mouse TF genes, their related genes, and the associated gene ontology (GO) terms. | |
| TFCat15 | http://www.tfcat.ca | Literature curated catalog of mouse and human TFs and sequence‐based prediction of additional TFs. | |
| ITFP16 | http://itfp.biosino.org/itfp/ | A platform for computational prediction and classification of TFs from protein sequence of human, mouse and rat. TF target genes are predicted from gene expression data using ARACNE algorithm. | |
| Gerstein Lab17 | http://info.gersteinlab.org/Rewiring_hierarchy | A resource of transcriptional regulatory networks for human, mouse, rat, Escherichia coli, Mycobacterium tuberculosis, and yeast compiled from different sources. | |
| Interaction network | STRING18 | http://string-db.org | A database of known and predicted protein interactions obtained from diverse sources, such as experimental repositories, computational predictions, and public text collections. It contains around 2.5 million proteins from 630 organisms and includes physical and functional interactions. |
| BIND19 | http://bind.ca | Stores information on interacting partners of a protein, such as RNA, DNA, other proteins, molecular complexes, and small molecules. Molecular interactions were obtained from published literature. | |
| HPRD20 | http://www.hprd.org | A database of manually curated high‐confidence protein interactions in human. It also stores information on protein domain architecture, post‐translational modification, and disease associations. | |
| MIPS21 | http://mips.helmholtz-muenchen.de/proj/ppi/ | A repository of manually curated protein–protein interactions (PPIs) in mammalians collected from the scientific literature. Only reliable physical interactions are included in the database. | |
| IntAct22 | http://www.ebi.ac.uk/intact/main.xhtml | Stores protein interaction data that are either curated from literature or from direct user submission. IntAct recently merged with MINT, which is another PPI database. | |
| Signaling pathway/network | KEGG23 | http://www.genome.jp/kegg/ | A large collection of signaling pathways for nearly 1500 species. The pathways can be browsed and data can be freely downloaded in KGML format. |
| REACTOME24 | http://www.reactome.org | A manually curated and peer‐reviewed database of biochemical reaction networks in human. For several species, such as mouse, fly, worm, plant, and bacteria, the reaction network is inferred through orthologous events. The network can be visualized through web browsers and downloaded in multiple formats. | |
| Pathway Interaction Database25 | http://pid.nci.nih.gov | A database of human pathways. Contains pathways curated by NCI‐Nature and combines them with BioCarta and Reactome databases. | |
| BioCarta | http://www.biocarta.com/Default.aspx | A repository of signaling pathways in human and mouse that allows rendering of pathways as networks. | |
| WikiPathways26 | http://wikipathways.org/index.php/WikiPathways | A freely available resource for visualizing and downloading pathways for ∼25 species. Unlike other databases, the WikiPathways resource relies on participation by the scientific community. Pathways can be created and edited by users. | |
| Immune network resources | InnateDB27 | http://www.innatedb.com | A well‐curated and widely used resource of the genes and proteins involved in mammalian innate immunity and their interaction network. The web interface allows different systems biology analyses, such as enrichment of pathways and GO terms, network, and TF‐binding site analyses. |
| PathogenPortal | http://pathogenportal.org | This website stores, updates, and integrates genomic, transcriptomic, metagenomic, and proteomic data for diverse hosts, pathogens, and vectors. The interactions between hosts, pathogens, and vectors can be visualized as networks from the user‐friendly interface. | |
| TB Database28 | http://www.tbdb.org | An integrated database of multiple 'omics' data from ∼28 M. tuberculosis strains under different conditions, and available drugs, vaccines, and biomarkers. Allows users to reconstruct regulatory networks from chromatin immunoprecipitation‐seq data and overlay gene expression data onto metabolic networks. | |
| Systems Virology Center | https://www.systemsvirology.org | Provides analysis tools and multiple 'omics' data to obtain a better understanding of how viruses interact with and regulate host networks. | |
| Systems Influenza29 | http://www.systemsinfluenza.org | A knowledgebase of transcriptomics, proteomics, and lipidomics data for studying interaction of influenza virus with the host immune system. | |
| ImmGen30 | http://www.immgen.org | A collaborative project that generated gene expression data under carefully standardized conditions surveying all cell types of lymphoid and myeloid lineage in mice. The data, metadata, genomic modules, and networks can be accessed through web browsers. |
Gene regulatory networks (GRNs) represent control of gene expression or gene‐specific RNA amounts by regulatory components such as transcription factors (TFs), activators, repressors, and microRNAs (miRNAs). Hence, each node in the GRN either corresponds to a target gene or a regulator of the gene or its RNA product. Several experimental and computational methods have been used for constructing GRNs. Two complementary experimental approaches are often used to generate data for these networks; Yeast one‐hybrid assays can identify TFs that regulate a gene,31 while ChIP (chromatin immunoprecipitation)‐chip and ChIP‐seq experiments can predict potential target genes of a TF32 by mapping protein–DNA interactions. Several algorithms have been developed for computationally predicting GRNs, which are categorized and compared in two recent review articles.33, 34 Recently, a collaborative and community‐driven approach was used for predicting GRNs through the consortium DREAM (Dialogue on Reverse Engineering Assessment and Methods).35
Many biological processes are dependent on physical interactions between individual proteins and spatial patterns of movement of numerous proteins within the cell. Thus, elucidating and interpreting these interactions is essential for understanding the resulting biological function. PPI networks attempt to capture large‐scale interaction information, where each node represents a protein and edges correspond to physical interactions. High‐throughput experimental techniques, such as yeast two‐hybrid (Y2H)36, 37, 38, 39 and affinity purification–mass spectrometry (AP‐MS),40, 41, 42 are the most widely used methods for identifying PPIs. While Y2H can identify physical and binary interactions between a protein pair in vivo, AP‐MS is suitable for identifying whole protein complexes with multiple interacting partners. Computational approaches use different types of information, such as evolutionary relationships, three‐dimensional protein structure, and the presence of specific protein domains, to predict PPI networks. Network representation of protein–protein and gene regulatory interactions allows us to study the topological properties of these interactions. In Figure 1(a) and (b), we highlight the contrast between the architecture of PPI networks and GRNs.
Figure 1.
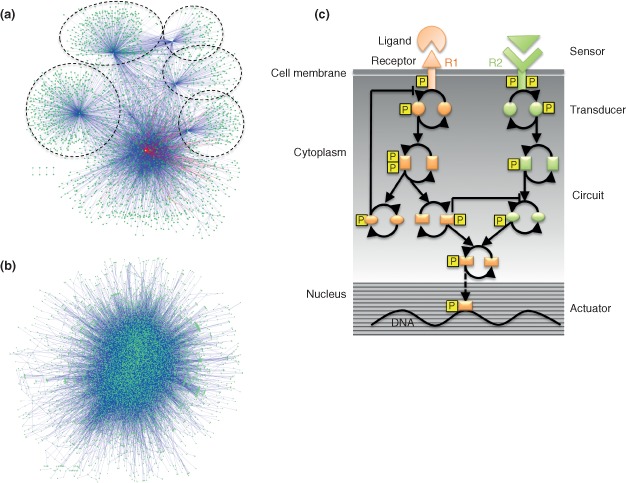
Architecture of human gene regulatory and protein–protein interaction networks. (a) Human transcription factor regulatory network (TRN). The human TRN was downloaded from Ref 17. The network is displayed using the Cytoscape force‐directed layout. Each node in the network is a transcription factor (TF), and edges represent transcriptional regulation. As transcriptional regulation is directed, network edges are directional from a TF to its target. The network has 3107 nodes and 6887 edges. The network clearly shows a hierarchical architecture as observed in Ref 17. Only a small subset of TFs regulate most of the other TFs, which is obvious from the modularity of the network architecture. The network can be divided into regions that are either autocratic or democratic. In the autocratic regions, a TF is usually regulated by a single TF whereas in the democratic regions a TF is regulated by multiple TFs. Circles highlight some of the autocratic regions. (b) Human protein–protein interaction (PPI) network. The network was downloaded from the Human Protein Reference Database (HPRD) and displayed using the Cytoscape force‐directed layout. Each node in this network is a protein. The edges of the network represent protein–protein associations observed in the literature and manually curated in the database. As PPIs do not have directionality, the network edges are nondirectional. The PPI network has 9251 nodes and 38,869 edges, hence it is much bigger compared with the gene regulatory network (GRN). Unlike the GRN, the PPI network shows lack of hierarchy. (c) A schematic representation of a typical signaling network. Ligands are sensed by specific membrane‐bound receptors (R1 and R2) followed by signal transduction, often mediated by adapter proteins that associate with the effector domains of receptors. The complex signaling circuitry further propagates and processes the signal through multiple steps, including signal integration, amplification [for instance by phosphorylation (P) or dephosphorylation of specific mediators], and noise reduction. Finally, the actuator, usually a TF, directs expression of appropriate target genes based on the processed signal. Different cellular components and their analogs in electric circuits are indicated on the left and right, respectively.
One concern in the PPI network construction community is the lack of reproducibility among networks generated in different laboratories using different (and in some cases, nominally the same) experimental methods, implying a high rate of false‐positive and/or false‐negative interaction calls in the various studies.43 Some computational algorithms have attempted to address this issue by assigning confidence scores to each of the interactions,44 but others have focused on the lack of standard operating procedures among laboratories using a single method such as MS to study PPIs. Indeed, standardization of protocols between laboratories has markedly increased the agreement in PPI networks derived from such studies.45
Signaling networks respond to inputs from extracellular and intracellular stimuli, process the inputs to distill signal from noise, and ultimately integrate the incoming information to ensure an appropriate functional response (Figure 1(c)). These networks show architectural similarity to electric circuits, as they have distinct components for sensing, processing/filtering, and transmission of signals.46 Unlike GRNs and PPI networks, the nature of the nodes and edges of signaling networks can be diverse. Nodes in a typical signaling network most often represent proteins and protein complexes, but can also represent genes, RNAs, chemical compounds, or any variable that can impact transmission of the signal from the starting point, often a receptor, to the end of the cascade, for example, a TF or gene. The edges of signaling networks can be physical binding, phosphorylation, ubiquitination, glycosylation, or transcriptional regulation, as in the case of signal‐induced transcription of signaling components.
While global molecular networks represent all possible interactions and regulations that can be achieved by the components, overlaying high‐throughput data obtained from experimental perturbations onto the network can identify regions of the network functionally active under a specific condition. By analogy, if a global network represents the comprehensive street map of a city, overlaying data can indicate regions of high traffic volume at a specific time of the day. Several algorithms that integrate high‐throughput data with GRNs,6, 47 PPI networks,48, 49 and signaling networks50, 51 have been developed. The performance of these algorithms depends on the choice of network resource, signal‐to‐noise levels in high‐throughput data, sensitivity and specificity of the scoring metric, and statistical tests for estimating the significance.
Representing complex relationships using networks facilitates effective visualization, which in turn aids in easy recognition of patterns and emergent properties arising from these interactions. In network visualization, nodes can be laid out in different ways, e.g., random, circular, hierarchical, or spring embedded. Different properties of the nodes and edges can also be represented by their color, size, shape, and border. Table 2 enlists some of the visualization tools widely used for rendering molecular networks. Among these tools, Cytoscape is one of the oldest and the most widely used. Some of the reasons behind this popularity are its user‐friendly interface and its open‐source platform, which allow any developer to create plug‐in software.61 Most of the plug‐ins not only help in network rendition but also allow different network‐based analyses within the interactive visualization framework. Similarly, several visualization and analysis tools are also available through R Bioconductor, which is the biggest repository of bioinformatics tools. The igraph package provides a large number of sophisticated analysis tools along with network visualization tools, and is used by diverse research communities. Unlike Cytoscape, use of R Bioconductor or igraph tools requires programming experience. STRING18 and Pathway Commons60 are examples of web‐based resources for visualizing smaller networks, typically interacting partners of queried gene(s).
Table 2.
Visualization of Biological Networks (Following Are Some of the Major Tools for Visualization of Networks and Pathways)
| Tool | Plugin/Package (Total Downloads) | Description |
|---|---|---|
| Cytoscape | ClueGO (13822)52 | Identifies enriched gene ontology (GO) and pathway terms from a list of genes and represents interrelations of enriched terms as a network. |
| BiNGO (9975)53 | Determines which GO categories are statistically overrepresented in a set of genes or a subgraph of a biological network. | |
| GeneMANIA (7981)54 | Predicts function of a query gene set using guilt‐by‐association approach from a large database of functional interaction networks. | |
| CluePedia (6801)55 | Extends the ClueGO plug‐in by rendering a network of genes corresponding to each enriched GO and pathway term using data and existing knowledge. | |
| MCODE (6425)56 | Finds densely connected regions or clusters in a biological network. The biological interpretation of the clusters depends on the type of network. | |
| jActiveModules (5728)48 | Overlays gene expression data on biological networks to identify expression‐activated subnetworks or network hotspots. | |
| R Bioconductor | Rgraphviz (63259) | Renders R graph objects and provides multiple options for layout, node, and edge properties. It is used by several Bioconductor packages for network rendering. |
| Pathview (7726)57 | Overlays gene expression data onto KEGG canonical pathway map. | |
| BioNet (5309)58 | Scores each node by differential expression and identifies significantly differentially expressed subgraphs from large biological networks. Subgraphs are rendered using 2D and 3D visualization. | |
| RedeR (3851)59 | A package that combines R‐based computational analysis with Java‐based visualization for dynamic network visualization and manipulation. | |
| cisPath (2722) | A package for management, visualization, and editing of PPI networks. cisPath creates HTML files, which can be visualized using standard web browsers. | |
| igraph | A general‐purpose graph package in R and Python language. Provides hundreds of functions for creating, manipulating, optimizing, and rendering graphs. | |
| Web‐tools | STRING18 | The web interface can render a network of query gene(s) and their direct neighbors from the underlying network database, which is created by combining different sources, e.g., co‐expression, text mining, and co‐occurrence. |
| Pathway Commons60 | Allows the user to search, visualize, and download network neighbors of query genes from publicly available pathway databases. |
Deriving conclusions from computational and visual analyses of any large‐scale network is a formidable challenge. Some researchers have focused on studying topological properties of the nodes and finding their biological relevance. For example, Barabasi and Albert62 argued that genetic and signaling networks are scale‐free (i.e., network degree distribution follows a power law) and the networks were developed through preferential attachment during evolution. In scale‐free networks, ‘hub’ nodes (i.e., nodes with large numbers of interacting partners) play the most important roles and the network will cease functioning if these nodes are deleted. In a complementary study, Yu et al.63 observed that it is not the hub nodes but the nodes with high betweenness centrality (i.e., network nodes that have many ‘shortest paths’ going through them) that are essential in a protein network. Specific experimentally testable hypotheses are often derived from a network by combining its topological properties with biological information. In the next section, we discuss specific examples where network analysis has led up to experimentally testable hypotheses.
INTRACELLULAR MOLECULAR NETWORKS IN INNATE IMMUNITY
The functions of the immune system, such as protective host defense under normal conditions or autoimmune disease when dysregulated, are encoded in interactions between its constituents operating in underlying complex dynamic molecular and cellular networks. These include GRNs, PPI networks, and signaling and metabolic networks introduced in section Molecular Networks. In this section, we discuss these networks in the context of the innate immune system, which detects microbial infection or tissue damage by employing a repertoire of pattern recognition receptors (PRRs), which are present on the surface of the cell or in the cytoplasm. These include the Toll‐like receptors (TLRs), nucleotide binding and oligomerization domain‐like receptors (NLRs), C‐type lectin receptors (CLRs), the retinoic acid‐inducible gene I‐like receptors (RLRs),64 as well as several putative sensors of intracellular DNA.65
The processes that enable an effective innate response can be broadly grouped into four categories, namely transcriptional, translational, spatial, and functional networks (Figure 2), which are higher level processes encompassing the GRNs, PPI networks, and signaling networks discussed previously. Each node in these diverse networks is a complex biological entity (e.g., innate sensors such as TLRs, NLRs, RLRs, and CLRs) or a biological process (e.g., transcription, translation, subcellular location, signaling, and heterogeneity) that is itself comprised of underlying subnetworks (Figure 2). That is, each node in the functional cellular network can be recast as a more complex subgraph that explodes the higher level node into its constituent parts with new nodes and edges. For instance, the process of ‘transcription’ in turn comprises of the nodes ‘cofactor, TF, promoter/enhancer’ and edges depicting connections between these constituent nodes (Figure 2). The edges in the higher order network represent functional connections in the context of an innate insult such as pathogen invasion or exposure to endogenous signals arising from tissue damage.
Figure 2.
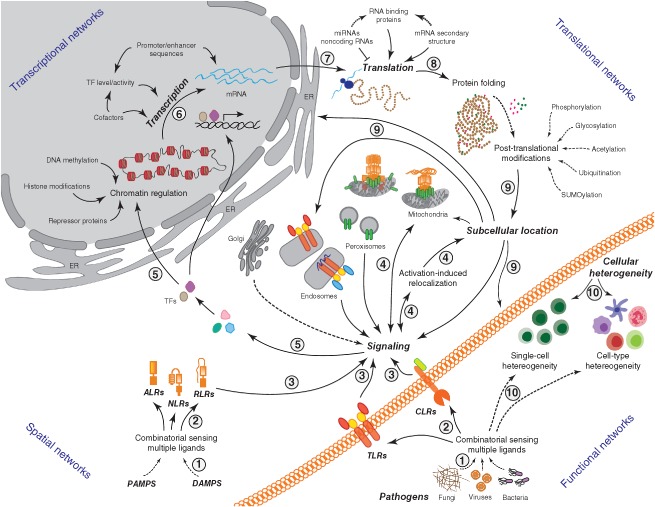
Intracellular molecular networks in innate immunity. Transcriptional, translational, spatial, and functional networks controlling innate immune responses are shown. Pathogens present diverse ligands (1) that are sensed by single or combinations of innate sensors including but not limited to Toll‐like receptors (TLRs), C‐type lectin receptors (CLRs), Nod‐like receptors (NLRs), RIG‐like receptors (RLRs), and AIM2‐like receptors (ALRs) (2). Such sensing triggers differential downstream signaling (3), which in turn can be promoted by preexisting compartmentalization of innate sensors (e.g., TLRs on the plasma membrane or endosomes) or their spatial relocation to membrane‐bound organelles (e.g., relocation of RIG‐I and NLRP3 to mitochondria) that provide suitable platforms for optimal assembly of signaling complexes (4). This leads to activation and/or production of downstream mediators (5) such as transcription factors (e.g., NF‐κB, AP‐1, and IRFs) that translocate to the nucleus to promote transcription of target genes (6) followed by their translation, appropriate protein folding, and post‐translational modifications (7 and 8). Cellular proteins may localize to specific subcellular compartments based on their domain sequences, post‐translational modifications, or association with suitable chaperones (9). Intercellular and intracellular heterogeneity is an important regulator of the innate response (10). Rewiring of the above connections can be expected depending upon the nature of the immune cell encountered (e.g., macrophage, dendritic cell, neutrophil, T cell, or B cell) as well as variations between single cells of seemingly homogeneous immune cell populations (e.g., heterogeneity due to cell state, stochastic nature of molecular interactions, and/or subtle differences in gene or protein expression). Dotted lines indicate indirect connections where the nodes may be separated by more than one degree(s) of freedom.
To perform network analysis of a complex system such as the innate immune system, information must thus be captured and integrated from many hierarchical levels. These levels include genomic information (DNA sequences and associated polymorphisms, epigenetic regulation), transcriptional information (RNA sequences and abundances, alternate splice forms, noncoding RNAs such as lnc RNAs and miRNAs), translational information (protein abundances, RNA‐binding regulatory proteins, post‐translational modifications), spatial information (protein localization to subcellular structures such as cell membranes, cytosol mitochondria, endosomes, or peroxisomes), cellular signaling processes (protein–protein and protein–DNA interactions, organization of proteins, lipids, and other molecular entities into pathways), cellular heterogeneity (information on functionally distinct cell subtypes or stochastic differences between single cells of the same subtype), cell–cell interactions, and organization of cells into tissues, organs, organ systems, and ultimately the resulting phenotypes (Figure 2). Recent technological advances have enabled us to query these many levels through acquisition of large‐scale ‘omics’ datasets that have facilitated network biology research in the context of innate immune molecular mechanisms. Genomics (sequencing of whole genomes) is complemented by transcriptomics (characterization and quantification of mRNA species), proteomics (characterization and quantification of proteins and associated modifications), and more recently with metabolomics and lipidomics (comprehensive characterization of abundance of lipids and metabolites). The wiring of networks representing the data gathered in this manner can in turn be expected to vary depending upon the nature of the immune cell [e.g., macrophage, dendritic cell (DC), neutrophil, T cell, or B cell] as well as between single cells of seemingly homogeneous immune cell populations.66 Below, we discuss several prominent examples in which network analysis methods have been applied to varying types of experimental datasets to provide new insights into the innate immune response.
Transcriptional/Gene Regulatory Networks
Most studies utilizing network biology approaches to elucidate innate immune responses have focused on deciphering transcriptional networks and GRNs controlled by TLRs,67 very recently extending to include other innate immune sensors. This is because many functional responses to TLR ligands can be readily recapitulated in vitro using bone marrow‐derived macrophages and DCs. Early studies utilized microarray‐based transcriptome analysis over multiple time points and clustering of genes with similar expression kinetics.68, 69, 70 In one such example, gene clusters from TLR4‐stimulated macrophages were mined for both induced TFs and for cis‐regulatory elements68 to identify a prominent group of genes regulated by activating TF 3 (ATF3). Network analysis and visualization predicted ATF3 as part of a transcriptional complex that also contains members of the nuclear factor (NF)‐κB family of TFs. Probable ATF3‐associated TFs were selected and potential transcriptional targets of the ATF3 regulatory complex were identified based on enrichment of ATF3, NF‐κB, and associated TF‐binding sites within close proximity. Using this method, 30 target genes were identified, many of which were validated using a ChIP‐to‐chip approach whereby ATF3‐bound DNA was assessed for enrichment of selected genes.
Scanning for TF‐binding sequence motifs and gene expression dynamics have since been used to elucidate macrophage transcriptional networks on a larger scale. In one study, time‐lagged expression correlation between TF genes and clusters of potential target genes was used to infer a network of associations in response to multiple TLR agonists.70 As an independent measure of association, the promoters of differentially expressed genes were scanned for the presence of TF‐binding motifs. A combined P‐value based on both the time‐lag correlation and motif scanning was determined and TF–gene cluster pairs were ordered based on this combined P‐value to construct a regulatory network that was further expanded through the inclusion of TF interaction data from publicly available sources. The inferred network of associations between TF genes and co‐expressed gene clusters was validated with targeted ChIP‐on‐chip experiments, and yielded insights into the macrophage activation program. One of the major findings was the identification of a novel regulator, TGFB‐induced factor homeobox 1 (Tgif1), which was only detected using the integration of both expression data and promoter scanning evidence. In another example, a combination of gene expression analysis and TF‐binding site motif scanning algorithms was used to infer a network of associations between TFs and target genes in macrophages activated with dsRNA.71 This network of associations predicted that a member of the forkhead family of TFs, FOXO3, acts as a negative regulator of the type 1 interferon (IFN) response, a linkage that was confirmed experimentally using FOXO3‐null macrophages. Genome‐wide ChIP‐seq analysis identified the IRF7 gene as one of the critical targets of FOXO3; this observation was functionally validated by gene deletion studies that in turn identified FOXO3 as a negative regulator of IRF7 transcription. FOXO3, IRF7, and type 1 IFN were further demonstrated to form a coherent feed‐forward regulatory circuit that was experimentally validated by ChIP analysis, in vitro functional assays, and in vivo during vesicular stomatitis virus lung infection of FOXO3 KO and IRF7 KO mice. Together, these findings established the FOXO3–IRF7 regulatory loop as a critical circuit that optimizes the antiviral response to achieve the appropriate balance between host defense and unchecked, potentially host‐detrimental inflammation.
The study of transcriptional networks has also yielded insights into human responses to PRR ligands (pathogen‐associated molecular patterns, PAMPs) in vivo. In one study, microarray data were generated from peripheral blood leukocytes isolated from human subjects at various times after injection of bacterial endotoxin.72 Using Ingenuity Systems Inc. knowledgebase and network analysis tool, the authors constructed a prototypical interaction network in blood leukocytes containing 292 genes and their direct interactions, and a global endotoxin‐induced gene interaction network of 1556 genes. This approach was used to identify changes in functional modules at different times during an endotoxin‐induced immune response. Using the same human microarray dataset, a more recent study used network component analysis to derive a dynamic regulatory network including 10 TFs, 99 target genes, and 149 regulatory interactions.73 By incorporating regulatory network information, this method facilitated prediction of TF activities over time and allowed for the identification of novel co‐regulated gene clusters and target genes within these clusters.
The integration of genome‐wide mRNA expression data with network perturbation using methods such as RNAi knockdown has further facilitated construction of biologically relevant innate immune transcriptional networks. One particularly extensive study employed a combination of gene expression and RNAi perturbation to reconstruct a transcriptional network controlling responses of DCs to distinct PAMPs.74 Specifically, gene expression profiles obtained at different time points poststimulation with PAMPs were used to identify candidate regulators that were then perturbed using lentiviral shRNA knockdown to determine how these regulators affect the target genes. This overall approach identified 2322 significant regulatory connections and revealed the functions of 125 TFs, chromatin modifiers, and RNA‐binding proteins. These data enabled the construction of a network model consisting of 24 hub regulators and 76 fine‐tuners that help to explain how pathogen‐sensing pathways achieve specificity. Non‐negative matrix factorization was used to define two major states induced by the PAMPs, namely ‘inflammatory’ versus ‘antiviral’ programs as well as distinct subnetworks for each state. Within each subnetwork, the authors found the predominance of multiple feed‐forward circuits. The network reconstruction strategy utilized in this study has been reviewed by the authors.75 Recently, the same group has developed a high‐throughput ChIP method to reconstruct the genome‐wide dynamic binding network of 25 TFs and 4 chromatin marks at four time points following LPS stimulation of DCs. Analysis of over 180,000 TF–DNA interactions revealed a temporally multilayered architecture of TF networks.76 Coupling these two approaches, i.e., unbiased perturbation of TFs74 with genome‐wide binding of the same factors,76 will be a robust approach for systematically elucidating the GRNs controlling the innate immune response.
In addition to construction of GRNs underlying the innate immune response, integrative systems approaches based on genome‐wide RNAi screens have been used to identify useful interventions in infection. One especially exhaustive study employed genome‐wide RNAi screening to identify host factors required for influenza virus replication as potential targets for therapeutic intervention.77 An arrayed siRNA library targeting more than 19,000 human genes was used to transfect human lung epithelial cells. Data from two independent screens analyzed using an integrative analysis approach, including redundant siRNA activity, interactome, and ontology‐based analysis, identified 295 host cell factors required for early‐stage influenza virus replication. Protein interaction data derived from Y2H databases, including published datasets,39, 78 Hynet and curated molecular interaction databases including Reactome, BIND, HPRD, and MINT (Table 1), were used to construct a host–pathogen interaction (HPI) map depicting associations between the identified host factors, viral‐encoded proteins, and other cellular proteins. The integration of RNAi and interactome datasets produced a network containing 181 confirmed host cellular factors that mediate 4266 interactions between viral or cellular proteins, and act as rate‐limiting ‘hubs’ in cellular pathways or processes required for influenza virus replication. A number of candidate genes involved in influenza virus replication were biologically validated by experiments showing that depletion of these genes resulted in reduced viral gene expression. Further functional assays were performed to identify factors specifically involved in virus entry or postentry viral replication. Finally, small‐molecule inhibitors of several host factors including vATPase (vacuolar ATPase) and CAMK2B (a ubiquitously expressed calcium sensor that regulates diverse cellular functions) were shown to antagonize influenza virus replication providing new opportunities for the development of host factor‐directed antiviral therapies.
Considerable interest has also focused on the analysis of GRNs that direct cellular diversity and cell fate decisions within the innate immune system. A combination of ChIP‐on‐chip data and analysis of TF‐binding sites has been used to demonstrate a regulatory network involving the TFs PU.1 and Gfi1 that orchestrate innate (macrophage) and adaptive (B lymphocyte) immune cell fates in multipotential progenitors in vivo.79 This network was experimentally validated in vitro and in vivo by following B‐cell development in Gfi1 knock out and PU.1 heterozygous animals. The same group has previously assembled and mathematically modeled a GRN that controls macrophage versus neutrophil cell fate choice and that accounts for the onset and resolution of mixed lineage patterns during cell fate determination.80 Another study has used a network perturbation approach to investigate causal influences or crosstalk between signaling modules involved in the cytoskeletal response of neutrophils to chemoattractant.81 More recently, network analyses have been employed to reveal a spectrum of macrophage activation states extending the current M1‐ versus M2‐polarization model.82 The authors generated a dataset of 299 macrophage transcriptomes by stimulating macrophages with diverse activation signals including PRR ligands, cytokines, and metabolic cues. Network analyses revealed common transcriptional regulators associated with all types of macrophage activation states as well as regulators related to stimulus‐specific programs. Finally, the Immunological Genome Project (ImmGen) consortium database has been utilized to elucidate transcriptional regulatory networks that control lineage commitment and functional diversification of DCs (DC progenitor cells, lymphoid‐tissue, nonlymphoid‐tissue DCs, and migratory DCs) across the murine immune system83 (Table 1). Thus, network analysis of transcriptional and ChIP data has also aided in identification of GRNs underlying distinct immune cell phenotypes and cell states in homeostatic and activated conditions.
Genome‐wide mRNA expression profiling followed by network analysis has also been applied to study cell fate determination within the adaptive immune system. One such study focused on elucidating the molecular mechanisms by which naïve T cells develop into effector Th17 cells.84 Network analysis of transcription profiles from wild‐type and IL‐23R KO T cells following in vitro exposure to Th17 polarizing conditions (TGF‐β1 and IL‐6 with or without IL‐23) identified serum glucocorticoid kinase 1 (SGK1), an inducible salt‐sensing kinase, as an essential node downstream of IL‐23 signaling. A curated database of PPIs was used to construct a network model that connects known proteins of the IL‐23R signaling pathway to the TFs whose function is dysregulated in IL‐23R KO cells. The network's nodes were ranked based on a centrality measure, i.e., the fraction of IL‐23R‐affected TFs downstream of that node in the network. SGK1 emerged as the highest ranking node suggesting that it acts both as a transcriptional target of IL‐23R signaling and as a kinase that may mediate the transcriptional effects of the pathway. These predictions were tested by examining the differentiation and maintenance of Th17 cells in SGK1 KO mice, as well as in mice lacking SGK1 specifically in IL‐17‐producing CD4+ T cells. The results showed that SGK1 was indispensible for IL‐23R‐dependent stability and maintenance of Th17 cells. Furthermore, mice fed a high salt diet (SGK1 is salt‐inducible) showed a marked increase in the frequency of Th17 cells in the gut and developed a more severe form of experimental autoimmune encephalitis than mice fed a normal diet. This increased severity was dramatically reduced in SGK1‐deficient mice, confirming the role of SGK1 in induction of pathogenic Th17 cells.
Another emerging area of focus is the elucidation of GRNs established during cellular reprogramming to derive clinically relevant cells for regenerative medicine. A network biology platform called CellNet has recently been developed to quantify how closely GRNs of in vitro engineered or reprogrammed cells resemble those of their in vivo counterparts, diagnose aberrant GRNs, and prioritize candidate transcriptional regulators to enhance cellular engineering.85, 86 The authors analyzed expression data from 56 published reports and using CellNet to compare the GRNs of in vitro engineered cells with those of their target cell types in vivo, and they found that cells derived via directed differentiation from embryonic stem cells more closely resemble their in vivo counterparts than products of direct conversion by ectopic expression of lineage‐specific TFs. They further discovered that directly converted cells fail to adequately silence expression programs of the starting population and that the establishment of unintended GRNs is common to virtually every cellular engineering paradigm. CellNet was used to spot aberrant regulatory networks and predict candidate transcriptional regulators that could be targeted for improving cell derivations. Experimental testing of these predictions showed that as predicted, improved B‐cell to macrophage conversion, both transcriptionally and functionally, was observed by knocking down the B‐cell regulators Pou2af1 and Ebf1. In addition, CellNet revealed an unexpected intestinal program controlled by the master regulator Cdx2 during conversion of fibroblasts into induced hepatocytes (iHeps), and experimental validation of this prediction showed long‐term functional engraftment of mouse colon by iHeps, thereby establishing their broader potential as endoderm progenitors and demonstrating direct conversion of fibroblasts into intestinal epithelium.
Signaling Networks
While the accessibility of gene expression datasets generated from PAMP‐stimulated cells has contributed to the prevalence of large‐scale transcriptional networks, elucidation of signaling networks demands incorporation of protein expression and PPI data into network analysis methods. This has been accomplished by advances in MS, which have allowed for acquisition of extensive proteomic datasets. In one such study, the authors systematically explored the signal transduction pathways responsible for regulating cellular antiviral defense and IFN production by using a comprehensive proteomic approach to assess the human innate immunity interactome controlling production of type 1 IFN.87 In a pull‐down approach, 58 genes with known involvement in the regulation of type 1 IFN were used as baits for interacting proteins; a total of 264 complexes were purified and analyzed by MS.87 Using these data, the authors mapped a network of 260 interacting proteins and 401 unique interactions. Many of the interactions not present in existing BioGRID or STRING databases were independently validated by immunoprecipitation and Cytoscape was used to visualize the interconnectivity of the network and combine the interactions into a single map. Functional consequences of these interactions on antiviral responses were assessed using overexpression and/or RNAi analyses. Dynamic changes in this interaction network were observed upon stimulation with several distinct PAMPs, revealing nodes of potential receptor crosstalk.
Integrative systems approaches combining genomic, proteomic, and network perturbation methods have yielded further insights into complex signaling circuits. A study combining transcriptional profiling, lentiviral shRNA‐mediated knockdown, small‐molecule perturbations, and SILAC‐based quantitative phosphoproteomics, uncovered 35 signaling regulators, including 16 known regulators, involved in the TLR4 response of mouse DCs.88 In particular, they identified CRKL, a tyrosine kinase adaptor, as an important modulator, and polo‐like kinases 2 and 4 as critical activators of the antiviral response. More recently, the same group has used an integrative approach to identify genes involved in the cytosolic DNA‐sensing network.89 They selected 809 candidates after transcriptomic and quantitative proteomic analyses (protein–protein and protein–DNA interactions) and perturbed the candidates using high‐throughput RNAi and small‐molecule inhibition to functionally validate the network. These networks, generated from integrated datasets, provide a major resource for immunologists to mine and identify novel players in signaling pathways and can aid in the construction of comprehensive computational models to generate predictions of the innate response.
Spatial Networks
Activation of signal transduction networks by extracellular or intracellular PRRs is encoded not only into transcriptional networks, GRNs, and PPI networks but also into spatial patterns of activation and relocation of numerous proteins. Many proteins are targeted with exquisite precision to specific locations in the cell, or undergo rapid directed changes in localization that influence the outcome of or are essential to signal generation. In many cases, innate sensors and/or adaptors must relocalize to specific cellular compartments or intracellular membranes for optimal assembly of signaling complexes and effector function. For instance, TLRs signal from the plasma membrane or endosomes90; RIG‐I, MDA‐5, and NLRP3 relocalize to mitochondria upon activation via association with MAVS91, 92, 93, 94; and NOD1 and NOD2 signal from endosomes.95, 96, 97 The nature of subcellular association can also influence the quality and duration of the response. This has been observed in the context of viral infection, where peroxisomal MAVS induces rapid IFN‐independent expression of defense factors that provide short‐term protection, whereas mitochondrial MAVS activates an IFN‐dependent signaling pathway with delayed kinetics, which amplifies and stabilizes the antiviral response.98 Thus, there is increasing evidence that organellar structures and intracellular movement are integral to the development of an effective immune response. Integration of this additional dimension into network analysis and visualization methods through development of appropriate tools should allow for a more holistic representation of innate networks as well as prediction of emergent properties that arise from the concerted action of these networks.
Functional Networks
Most studies discussed thus far have assessed responses to single, purified PRR ligands; however, this is a scenario far from biological reality. During a natural infection, pathogens present a cocktail of ligands that activate diverse cell surface‐associated and intracellular PRRs to initiate combinatorial signaling cascades99 (Figure 2). Crosstalk between these signaling cascades gives rise to multifaceted, pliable, and functional networks in which dynamic interactions between the underlying components dictate the quality, magnitude, and duration of the ensuing host response. In this context, each ‘signaling pathway’ linked to a PRR‐innate sensor is in reality a much more extensive multicomponent network comprised of several nodes representing constituent signaling molecules and edges representing the spatial, temporal, and functional connections between these constituents. The existence of such a multifactorial network composed of multiple innate sensors with some degree of functional redundancy may enable macrophages, DCs, and other immune cells to detect pathogens or danger with greater precision resulting in robust synergistic responses. For instance, synergistic inflammatory responses have been observed upon simultaneous stimulation of myeloid cells with different TLR ligands,100 TLR and NLR ligands,101 and TLR and CLR ligands.102 Crosstalk can also occur between PRRs and other receptors expressed by immune cells. For instance, dual B‐cell receptor and TLR and/or NLR engagement can fine‐tune functional B‐cell responses.103, 104 Similarly, crosstalk between PRRs and phagocytic receptors is indicated by the observation that phagosomal TLR agonists enhance major histocompatibility complex (MHC) class II–mediated antigen presentation.105 Additionally, synergy between PRRs and cytokine receptors can be inferred from the observation that IFN‐γ augments TLR‐induced gene transcription.106 Finally, transcriptional induction of some PRRs by microbial signals allows for sequential triggering of PRRs that may permit greater accuracy in mounting a response commensurate to the nature and extent of the threat while preventing excessive inflammation. For instance, triggering of TLRs is critical for priming NLRP3 expression and subsequent inflammasome activation.107 Thus, functional innate responses result from crosstalk within and between PRR, cytokine, phagocytic, and other pathways upon recognition of multiple antigens simultaneously presented by a microbe. Assessment of responses to combined rather than single stimuli is therefore an essential parameter that should be incorporated in the study of these complex signaling networks engaged by pathogens.
INTERCELLULAR AND ORGANISMAL NETWORKS
The existence of several different types of immune cells and their diverse cellular states lends additional levels of complexity that make holistic analysis of the immune system a challenging task. New advances in single‐cell technologies such as single‐cell microfluidics,108, 109 transcriptomics,110 quantitative proteomics,111 multiparameter flow cytometry, mass cytometry,112 and live cell imaging113 are allowing researchers to understand how immune populations may generate and leverage cellular heterogeneity to achieve the range and plasticity required during dynamic processes such as cellular differentiation or host defense.66, 114 One study combined molecular profiling data and database mining approaches to elucidate intercellular communication networks that dictate blood stem cell fate decisions and showed that intracellular and intercellular networks, and their interactions, are dynamic as differentiation occurs over time.115 Therefore, the nominal definition of a cell fails to convey the dynamic nature of cellular states, as intercellular communications change intracellular networks that define cellular behavior.
Given the dynamic nature of cell–cell interactions, there has been a growing interest in representing and modeling complex intercellular interactions in multicellular systems as networks with the ultimate goal of understanding and predicting their global behavior in a systematic and scalable way.116 Several large‐scale analyses to describe the structure and dynamics of intercellular networks have been performed, some in the context of the immune system. One such study probed the cytokine‐mediated connections between cells of the immune system (immune cells), parenchymal and stromal cells within tissues (body cells), and between ‘immune’ and ‘body’ cells.117 This cytokine network was constructed using available databases and revealed a tiered connectivity between immune cells, whereas body cells lacked such a connectivity pattern. The structural motifs of the immune cytokine network resembled those present in the social and World Wide Web superfamilies owing to the presence of clique motifs. The apparently greater degree of interconnectivity among immune cells, relative to other nonimmunological physiological systems as evidenced by this particular study, highlights the possible particular importance of visualizing immune responses as networks at the cellular level. When intercellular interactions are investigated in vivo, in the context of biological systems, the three‐dimensional positioning of cells within tissues must be also considered, just as intracellular physical positioning of network components is crucial to efficient signaling, as described above. In a recent study of intercellular metabolic networks in the human brain, consideration of the tissue microenvironment in the model generation process added an additional layer of information that rendered networks more representative of the in vivo experience.118
As a result of extensive studies involving sophisticated static and live imaging techniques combined with more traditional immunological assays, the murine lymph node (LN) is an optimal example of a tissue environment in which the many dimensions of immunologically relevant cellular interactions have been studied in great detail.119 Here, we provide an illustrative example of an innate immune response network in the LN. The lymphatic system is a network of open‐ended structures that collect interstitial fluid that even under normal conditions extravasates into tissues.120 Interspersed along lymphatic vessels are LNs. These complex structures are classically considered the site where adaptive immune responses are initiated. However, it has recently been shown that a multicellular innate immune network is at play in the LN protecting the host from systemic dissemination of lymph‐borne organisms.121 In Figure 3 we graphically display this complex biological system in parallel with a network rendition of the intercellular connections. Under steady‐state conditions (Figure 3(a)) a heterogeneous population of innate immune cells is located in close proximity to the macrophages that line the subcapsular sinus, where lymph drains. The physical proximity of the innate cells and macrophages allows for efficient intercellular communication via secreted cytokines following a perturbation (i.e., infection with an intracellular or extracellular bacterium, e.g., as seen in Figure 3(b) and (c)). In the network rendition, we emphasize the spatial positioning requirements for effective intercellular interactions by only highlighting those nodes that can display a potential connection (dotted line) with the central node and graying out the others. Figure 3(b) and (c) represents the system after infection with an intracellular or extracellular organism, respectively. The sequence and timing of events is indicated by the gradual color progression from light gray (earlier events) to black (later events) and the thickness of the edges indicates the relative contribution of a particular pathway. For example, following infection with an extracellular bacterium (depicted in Figure 3(c)), the main pathway that is activated involves IL‐1β release from the subcapsular sinus macrophages, which in turn recruits neutrophils to the LN, culminating in containment of the infection.
Figure 3.
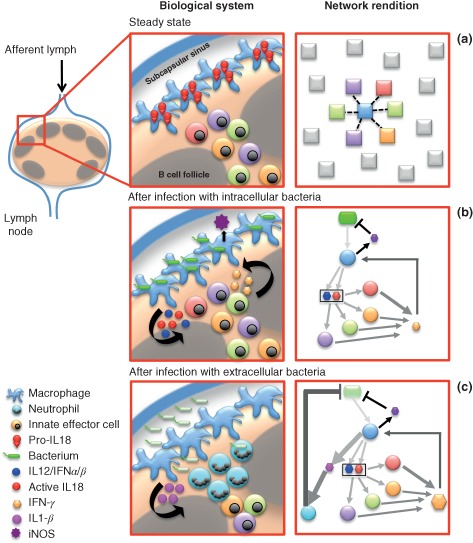
A multicellular innate immune network in lymph nodes. An innate immune response circuit in the lymph node (LN) shown as a biological system (left panels) and a network (right panels). Left panels: (a) Innate effector cells are prepositioned in proximity to subcapsular sinus macrophages under steady‐state conditions. (b) Upon exposure to intracellular bacteria draining to the LN through the lymphatic system, macrophages are activated, release cytokines, and engage innate effector cells. Their activation, in turn, leads to cytokine production that enables the macrophages to contain the infection. (c) Exposure to extracellular organisms also leads to macrophage activation. Production of IL‐1β leads indirectly to neutrophil recruitment from the circulation, which leads to containment of the infection. Right panels: Network rendition of the biological system. Dotted edges in (a) represent potential connections. The color progressions of edges from light gray to black in (b) and (c) indicate the temporal progression of events. Thickness of the edges indicates the relative contribution of a particular connection.
Cellular migration between tissues is the next level in further defining dynamic networks as they apply to complex biological communities. Upon immune challenge in the periphery, antigen can drain freely or be actively transported into the draining LN via afferent lymphatics. Here, antigen processing and presentation by professional antigen‐presenting cells (APCs) takes place. T lymphocytes constitutively circulate through lymphoid organs, entering LNs through specialized venules and then migrating within the LN in search for cognate antigen. This migratory pattern is directed by encounters with APCs and by the stromal network in the LN.122, 123 Upon cognate antigen recognition, as during an immune challenge, T‐cell activation and proliferation occur. T cells exit the LN via lymphatics and enter the systemic circulation. Effector T cells then have the ability to home to sites of infection. It has been suggested that T cells receive instructive signals that direct them preferentially to certain sites of inflammation during the initial phase of priming.124 Once in the tissue, activated T cells carry out their effector function, in part through the secretion of cytokines.
Visualization of a network that is dynamic in four dimensions poses several challenges. In Figure 4(b), we depict a complex network of temporal and spatial variations in organization representing the biological system in Figure 4(a). Each node in this complex environment is an active and dynamic multifaceted network on its own. For example, the naïve T‐cell node must contain information about the migratory behavior of the cells, which in itself is a set of intracellular molecular events that allow the cell to interact with the extracellular matrix.119, 123 T‐cell migratory behavior influences the likelihood of antigen encounter in the LN.125, 126 Therefore, there must also be information on intercellular interactions between T cells and APCs in the LN, as this interaction allows for the activation of T cells in the presence of cognate antigen. Additionally, each edge in this network represents an intricate set of molecular events, such as a change in the state of a cell (edge between naïve T cell and activated T cell) or in migration of a cell to distant organs (edge connecting blood to skin). We use different colors to indicate behavior under steady‐state conditions (red arrows in Figure 4(b)) and make use of the color progression to indicate temporally sequential events (light gray to black). With the help of this example, we delineate the response of the host immune system as an interaction network, representing dynamic, spatial, and contextual interactions between diverse immune cells. As we learn more about the link between structure and function and the temporal evolution of immune responses, one must develop the tools to integrate these additional dimensions of information into network renditions or predictions of complex biological systems. A final layer of complexity can be added when one seeks to represent the interaction between the networks of a multiscalar host and an invading pathogen discussed in the next section.
Figure 4.
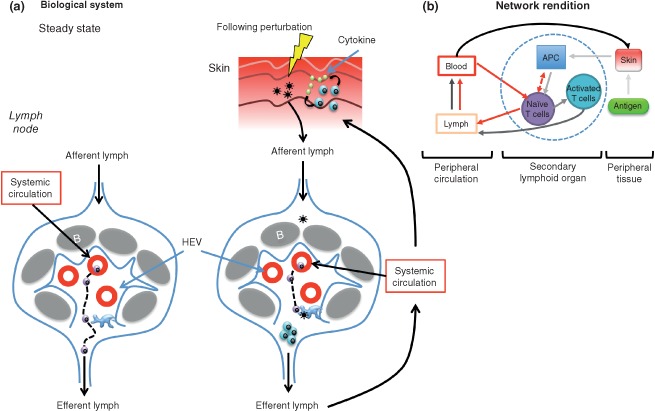
Illustration of an organ‐level network in adaptive immunity. (a) Generation of an adaptive immune response after exposure to an antigen in the periphery represented as a biological system. Under steady‐state conditions (a, left), T cells enter lymph nodes (LNs) via high endothelial venules (HEVs) and then migrate within LNs in search for antigen. They then exit the LN via efferent lymphatics and eventually return to the systemic circulation. Exposure to antigen in the periphery (a, right), for example, through skin injury, leads to either active transport or passive drainage of antigens into the draining LN. Here, antigens can be taken up, processed, and presented by LN‐resident antigen‐presenting cells (APCs) on major histocompatibility complex (MHC) molecules. Upon recognition of cognate peptide–MHC complex, naïve T cells are activated, proliferate, and subsequently exit the LN via lymphatic conduits. The lymphatic system then connects to the venous circulation and therefore activated T cells have access to perfused peripheral tissues. Activated T cells migrate within the affected tissue and upon receiving appropriate signals secrete effector cytokines. (b) Network rendition of the biological system in (a). Red arrows on the left hand side of the panel represent circulation of naïve T cells within the lymphatic and circulatory system. Dotted edges are potential connections. The color progression from light gray to black indicates the temporal progression of events in the setting of exposure to a pathogen in the periphery leading to the generation of an adaptive response in the draining LN, culminating in the arrival of activated T cells at the site of injury. B, B‐cell follicle.
A NETWORK PERSPECTIVE OF HPIs
Despite significant progress in medicine, infectious diseases such as HIV/AIDS, tuberculosis, malaria, and hemorrhagic fever, continue to remain major killers worldwide. Several pathogens can modulate host defense mechanisms to their advantage and actively manipulate the host immune response by producing a variety of virulence factors, thereby influencing the outcome of infection.127, 128, 129 Similarly, host factors can influence the pathogen; for instance, host‐derived lysophospholipids can enhance secretion of a key virulence factor flagellin from Salmonella,130 and IFN‐γ stimulates the transcription of Pseudomonas aeruginosa virulence factors.131 A deeper understanding of the underlying pathophysiology and molecular interactions between the host and pathogen is therefore central to overcoming the challenges posed by infections. From a network biology perspective, HPIs can be conceptualized as crosstalk between two molecular networks: one corresponding to the host and the other to the pathogen. These molecular networks have specific points of interaction and quite often pathogen proteins mimic eukaryotic PPI domains to invade the host PPI network. For example, the nonstructural protein 1 (NS1) of influenza A virus contains domains that bind to SH2 and SH3 domains of the regulatory subunits of host PI3K.132 Other studies have shown that interaction between host and influenza A PPI domains can determine the virulence of the virus.133 Similar examples of host molecular mimicry exist in bacteria; for instance, interaction of the Escherichia coli type III effector protein espF with human sorting nexin 9 protein (SNX9) induces host membrane remodeling.134 These studies suggest that interactions between host and pathogen molecular networks are not random but rather well orchestrated, directed events that can influence both host and pathogen behavior. A holistic view of HPIs therefore requires a systematic and comprehensive study of host and pathogen molecular networks separately and in combination.
The different databases available for host genome‐scale PPIs are reviewed in detail in section Molecular Networks. As virus genomes are much smaller, genome‐scale PPIs were first generated in E. coli bacteriophage T7135; this PPI consisted of only 25 viral‐protein interactions. Subsequently, genome‐scale PPI maps have also been generated for other viruses, such as hepatitis C,136 vaccinia,137 herpes,138, 139, 140 and SARS‐associated coronavirus.141 All these studies used Y2H experiments to identify the interactions. Most viruses, except herpesviruses, have fairly small PPIs. For two members of the herpesvirus family, i.e., Kaposi sarcoma‐associated herpesvirus and varicella‐zoster virus, a comparatively large number of PPIs, 123 and 173, respectively, have been identified. Topological analyses of PPI networks of several viruses have revealed that nodes in viral PPI networks tend to form a single and highly connected module with many hubs and few peripheral nodes.139 This observation is in striking contrast to the network topology of eukaryotic PPIs that have few hubs and several peripheral nodes.62
Compared to viral PPI networks, bacterial PPI networks are much larger and more complex. PPI networks have been generated for several bacteria including Helicobacter pylori,38 Campylobacter jejuni,142 Treponema pallidum,143 Mycobacterium tuberculosis,144 and Bacillus subtilis.145 Several studies have identified PPI networks in E. coli, a well‐characterized Gram‐negative bacterium, using experimental and computational approaches.40, 146 The E. coli PPI network is one of the largest bacterial networks currently available with more than 10,000 interactions.147 These experimental PPI networks have been most widely generated using two methods, namely Y2H systems and tandem AP‐MS. Topological analyses of bacterial PPI networks have revealed that they follow power‐law distributions, i.e., they have few hubs and many peripheral proteins.62 Similar to bacterial PPI networks, protozoan pathogen PPI networks as in the case of Plasmodium falciparum 148 also follow scale‐free distribution.147
Collection of HPI data in a high‐throughput and systematic way has become available only in recent times. Several web‐based resources are currently available that compile HPI data from different sources, including high‐throughput experiments, literature curation, and computational predictions. A list of some of the widely used resources and their descriptions are included in Table 3. All these resources have come up with their knowledge base, which stores data in a systematic format and provides tools to query the database and display results through their web interface. Some of these applications also provide sophisticated tools to visualize interactive HPI networks. As most of the databases mainly rely on similar sources, the results are expected to overlap. However, some discordance between the results is not completely unexpected. Some databases are tailored for host‐ and pathogen‐specific information. For example, GPS‐Prot156 stores only human–HIV interactions, while PATRIC153 is a repository of bacterial interactions with many host species. A few recent studies have created meta‐databases, such as PHISTO,149 PHI‐base,150 and HPIDB,151 that combine interactions from a large number of host and pathogen species. Topological analysis of proteins involved in interaction of host and pathogen networks indicates that both bacterial and viral pathogens in general target hub and bottleneck proteins in host networks.147 These target proteins are associated with processes that help propagate infection or evade host defense mechanisms, for instance, evasion of apoptosis, inhibition of innate immunity, and reorganization of the actin cytoskeleton.157
Table 3.
Publicly Available Host–Pathogen Interaction Databases and Tools
| Database | Website | Description |
|---|---|---|
| PHISTO149 | http://www.phisto.org | This meta‐database combines interaction data from different sources using computational tools and currently contains ∼2400 interactions between human and 300 pathogen strains (247 viral, 45 bacterial, 3 fungal, and 5 protozoan). The web interface also allows for network analysis and visualization. |
| PHI‐base150 | http://www.phi-base.org | A comprehensive database containing experimentally verified pathogenicity, virulence, and effector genes from bacterial, fungal, and oomycete pathogens, which infect a broad range of hosts, such as plant, vertebrate, and fungal species. The data can be easily downloaded and visualized with network‐rendering tools. The current version contains more than 4000 interactions between 166 pathogens and 110 hosts. |
| HPIDB151 | http://agbase.msstate.edu/hpi/main.html | A host–pathogen interaction (HPI) meta‐database that contains 22,841 unique interactions between 49 hosts and 319 pathogens obtained by combining interspecies interaction data from six publicly available databases, i.e., BIND, MINT, PIG, GENERIF, REACTOME, and IntAct. The website does not provide network visualization, but the interaction network information can be downloaded and visualized using tools such as Cytoscape. |
| Phinet152 | http://www.phidias.us/phinet/ | A HPI network visualization tool that uses PHIDIAS knowledgebase created by combining manually curated data with existing databases, such as KEGG and MiNet. PHIDIAS database currently includes 100 pathogens, including 58 bacteria, 37 viruses, 2 parasites, and 3 fungi. The multilayered and interactive network rendition also provides detailed information on cellular localization of host–pathogen proteins and complexes. |
| PATRIC153 | http://www.patricbrc.org | A database that provides diverse types of data and bioinformatic tools specifically for bacterial pathogens. Host‐bacterial protein–protein interactions (PPIs) can be downloaded and viewed using interactive network diagrams. |
| VirhostNet154 | http://pbildb1.univ-lyon1.fr/virhostnet/login.php | A manually curated database of high‐confidence virus–virus and human–virus PPIs for 180 distinct viral species. It also provides additional information about the proteins, such as structural and functional annotation, gene ontology term, pathway membership, and INTERPRO domain. |
| CAPIH155 | http://bioinfo-dbb.nhri.org.tw/capih | A web‐based tool for comparison of PPIs between HIV and four different hosts, i.e., human, chimpanzee, rhesus macaque, and mouse. CAPIH can highlight host‐specific interactions due to genetic differences and displays the results, including HPI networks, through interactive Java Applets. |
| GPS‐Prot156 | http://www.gpsprot.org | A meta‐database that integrates PPI data between human and HIV from three publicly available databases, including MINT, BioGRID, and HPRD. It also provides Java Applet‐based interactive tool for interactive visualization of HPI networks. |
Computational predictions of HPI are useful when experimental data are unavailable, incomplete, or noisy. Several types of computational approaches have been used for this purpose; for instance, machine learning‐based approaches have been applied for automated mining of scientific literature to predict HPIs.158, 159 Although these methods are cheap and scalable, their performance should be carefully measured by estimating sensitivity and specificity. Interactions between human proteins and several pathogen proteins have also been predicted based on interlogs, an approach that extends protein interactions based on sequence homology and orthology.160, 161 Because proteins usually interact through specific domains, algorithms for predicting domain–domain interactions can help identify potential PPIs.162, 163, 164 For instance, computational prediction of short linear sequence motifs common to both HIV‐1 and human proteins has provided the basis for understanding the interaction with and modification of the host PPI network by the virus.165, 166 To improve computational predictions, pipelines can be created that include combinations of the above approaches and impose additional constraints.157 For example, interaction between a pair of host and pathogen proteins can be predicted based on availability of interacting domain pairs from relevant databases. Once all such pairwise interactions have been predicted, the results can be filtered to retain only hub genes in the host PPI network, as these genes are the ones most likely to be targeted by pathogen proteins to gain access to the host network(s).
CONCLUSIONS AND TRANSLATIONAL IMPLICATIONS
The immune system is particularly well suited for the application of network reconstruction methods. From dynamic molecular interactions underlying intracellular signaling pathways, controlled by GRNs and also regulated by epigenetic modifications, to intercellular crosstalk between the many distinct immune cell subtypes, organization of cells into tissues and organs, and finally, to the overall response of an organism, there are multiple hierarchical levels that are amenable to network‐based modeling and visualization. Although we are still far from the eventual goal of applying network‐based approaches to the construction of comprehensive predictive models of the immune response to diverse perturbations, the examples described in the preceding sections highlight how systems‐level network analyses have accelerated our understanding of molecular interactions underlying the immune response. Large‐scale ‘omics’ approaches need to be combined with recent advances in computational biology and mathematical tools to allow for the generation of comprehensive quantitative and predictive network models across multiple scales of organization in the immune system. Iterative refinements of such dynamic models through experimental validation should eventually allow us to simulate immune behavior and infer responses that cannot be predicted a priori.
In addition to deciphering networks that underlie the immune response, the field of immune network biology also holds promise for unraveling genetic and molecular networks that drive complex human diseases, and drug‐target networks that can help power new drug discovery. Unbiased genetic approaches, such as genome‐wide association studies (GWAS), have uncovered many genetic loci and processes that are dysregulated in human immune disorders.167 These causal genetic alleles and the products they encode are in turn rooted within complex molecular and cellular networks.168 Each disease‐associated allele can thus result in dysregulation of multiple circuits,169 and disease states can be considered emergent properties of molecular networks rather than the result of single gene mutations.170 Integrating large‐scale high‐dimensional data such as genome‐wide single‐nucleotide polymorphism genotyping data, GWAS data, whole genome transcriptome, next‐generation sequencing, and ChIP‐seq data will provide a more comprehensive view of disease states and will be a key to better understanding of the molecular networks underlying physiological states associated with disease. A major challenge will be construction of predictive probabilistic networks that can infer causality between disease phenotypes and underlying molecular circuits. Development of sophisticated computational methods for statistically associating specific network behaviors with upstream gene alleles and downstream clinical outcomes will be critical to define causality, and to determine biomarkers of disease, and candidate targets for therapeutic intervention.
Finally, network‐based approaches hold potential for the identification of novel actionable drug targets as well as the repositioning of established targets. This may be accomplished by the integration of drug‐target networks with PPI and other biological networks.171, 172 Recently, the recognition that disease‐causing alleles are embedded in complex molecular and cellular networks has shifted the focus of drug discovery from the ‘one‐target, one‐drug’ model to a ‘multitarget, multidrug’ model aimed at systemically modulating multiple nodes in a network. In addition, studies have revealed that many diseases have common genetic origins and that drug targets are often involved in multiple diseases, indicating potential for application of known drugs to new diseases.173, 174 The ultimate goal will be to integrate information from large‐scale ‘omics’ approaches with causal disease pathways and drug‐target analysis in order to build a comprehensive computational platform to drive multitarget multidrug discovery. In future clinical applications, we envision construction of individual‐specific network models for personalized medicine that may empower physicians to treat patients according to previously unutilized and uncoordinated levels of biological information. Integrating this information from multiple biological levels remains a challenge that will lay the cornerstone for a functional systems approach to human immunology that can reveal the precise cellular and molecular networks that contribute to human diseases and how they can be targeted to ameliorate disease.
ACKNOWLEDGMENTS
This work was generously supported by the Intramural Research Program of the National Institute of Allergy and Infectious Diseases, and institutional support funds from the Institute for Systems Biology to NS.
Conflict of interest: The authors have declared no conflicts of interest for this article.
REFERENCES
- 1. Albert R, Jeong H, Barabasi AL. Error and attack tolerance of complex networks. Nature 2000, 406:378–382. [DOI] [PubMed] [Google Scholar]
- 2. Barabasi AL. Network science: luck or reason. Nature 2012, 489:507–508. [DOI] [PubMed] [Google Scholar]
- 3. Strogatz SH. Exploring complex networks. Nature 2001, 410:268–276. [DOI] [PubMed] [Google Scholar]
- 4. Califano A, Butte AJ, Friend S, Ideker T, Schadt E. Leveraging models of cell regulation and GWAS data in integrative network‐based association studies. Nat Genet 2012, 44:841–847. [DOI] [PMC free article] [PubMed] [Google Scholar]
- 5. Barabasi AL, Gulbahce N, Loscalzo J. Network medicine: a network‐based approach to human disease. Nat Rev Genet 2011, 12:56–68. [DOI] [PMC free article] [PubMed] [Google Scholar]
- 6. Veiga DF, Dutta B, Balazsi G. Network inference and network response identification: moving genome‐scale data to the next level of biological discovery. Mol Biosyst 2010, 6:469–480. [DOI] [PMC free article] [PubMed] [Google Scholar]
- 7. Vital‐Lopez FG, Memišević V, Dutta B. Tutorial on biological networks. WIREs Data Mining Knowl Discov 2012, 2:298–325. [Google Scholar]
- 8. Chen B, Butte AJ. Network medicine in disease analysis and therapeutics. Clin Pharmacol Ther 2013, 94:627–629. [DOI] [PMC free article] [PubMed] [Google Scholar]
- 9. Barabasi AL, Oltvai ZN. Network biology: understanding the cell's functional organization. Nat Rev Genet 2004, 5:101–113. [DOI] [PubMed] [Google Scholar]
- 10. Fraser ID, Germain RN. Navigating the network: signaling cross‐talk in hematopoietic cells. Nat Immunol 2009, 10:327–331. [DOI] [PMC free article] [PubMed] [Google Scholar]
- 11. Kidd BA, Peters LA, Schadt EE, Dudley JT. Unifying immunology with informatics and multiscale biology. Nat Immunol 2014, 15:118–127. [DOI] [PMC free article] [PubMed] [Google Scholar]
- 12. Wingender E. The TRANSFAC project as an example of framework technology that supports the analysis of genomic regulation. Brief Bioinform 2008, 9:326–332. [DOI] [PubMed] [Google Scholar]
- 13. Zhang HM, Chen H, Liu W, Liu H, Gong J, Wang H, Guo AY. AnimalTFDB: a comprehensive animal transcription factor database. Nucleic Acids Res 2012, 40:D144–D149. [DOI] [PMC free article] [PubMed] [Google Scholar]
- 14. Kanamori M, Konno H, Osato N, Kawai J, Hayashizaki Y, Suzuki H. A genome‐wide and nonredundant mouse transcription factor database. Biochem Biophys Res Commun 2004, 322:787–793. [DOI] [PubMed] [Google Scholar]
- 15. Fulton DL, Sundararajan S, Badis G, Hughes TR, Wasserman WW, Roach JC, Sladek R. TFCat: the curated catalog of mouse and human transcription factors. Genome Biol 2009, 10:R29. [DOI] [PMC free article] [PubMed] [Google Scholar]
- 16. Zheng G, Tu K, Yang Q, Xiong Y, Wei C, Xie L, Zhu Y, Li Y. ITFP: an integrated platform of mammalian transcription factors. Bioinformatics 2008, 24:2416–2417. [DOI] [PubMed] [Google Scholar]
- 17. Bhardwaj N, Yan KK, Gerstein MB. Analysis of diverse regulatory networks in a hierarchical context shows consistent tendencies for collaboration in the middle levels. Proc Natl Acad Sci USA 2010, 107:6841–6846. [DOI] [PMC free article] [PubMed] [Google Scholar]
- 18. Franceschini A, Szklarczyk D, Frankild S, Kuhn M, Simonovic M, Roth A, Lin J, Minguez P, Bork P, von Mering C, et al. STRING v9.1: protein‐protein interaction networks, with increased coverage and integration. Nucleic Acids Res 2013, 41:D808–D815. [DOI] [PMC free article] [PubMed] [Google Scholar]
- 19. Bader GD, Betel D, Hogue CW. BIND: the Biomolecular Interaction Network Database. Nucleic Acids Res 2003, 31:248–250. [DOI] [PMC free article] [PubMed] [Google Scholar]
- 20. Prasad TS, Kandasamy K, Pandey A. Human Protein Reference Database and Human Proteinpedia as discovery tools for systems biology. Methods Mol Biol 2009, 577:67–79. [DOI] [PubMed] [Google Scholar]
- 21. Pagel P, Kovac S, Oesterheld M, Brauner B, Dunger‐Kaltenbach I, Frishman G, Montrone C, Mark P, Stumpflen V, Mewes HW, et al. The MIPS mammalian protein‐protein interaction database. Bioinformatics 2005, 21:832–834. [DOI] [PubMed] [Google Scholar]
- 22. Orchard S, Ammari M, Aranda B, Breuza L, Briganti L, Broackes‐Carter F, Campbell NH, Chavali G, Chen C, del‐Toro N, et al. The MIntAct project—IntAct as a common curation platform for 11 molecular interaction databases. Nucleic Acids Res 2014, 42:D358–D363. [DOI] [PMC free article] [PubMed] [Google Scholar]
- 23. Kanehisa M, Goto S, Sato Y, Furumichi M, Tanabe M. KEGG for integration and interpretation of large‐scale molecular data sets. Nucleic Acids Res 2012, 40:D109–D114. [DOI] [PMC free article] [PubMed] [Google Scholar]
- 24. Croft D, Mundo AF, Haw R, Milacic M, Weiser J, Wu G, Caudy M, Garapati P, Gillespie M, Kamdar MR, et al. The Reactome pathway knowledgebase. Nucleic Acids Res 2014, 42:D472–D477. [DOI] [PMC free article] [PubMed] [Google Scholar]
- 25. Schaefer CF, Anthony K, Krupa S, Buchoff J, Day M, Hannay T, Buetow KH. PID: the Pathway Interaction Database. Nucleic Acids Res 2009, 37:D674–D679. [DOI] [PMC free article] [PubMed] [Google Scholar]
- 26. Kelder T, van Iersel MP, Hanspers K, Kutmon M, Conklin BR, Evelo CT, Pico AR. WikiPathways: building research communities on biological pathways. Nucleic Acids Res 2012, 40:D1301–D1307. [DOI] [PMC free article] [PubMed] [Google Scholar]
- 27. Breuer K, Foroushani AK, Laird MR, Chen C, Sribnaia A, Lo R, Winsor GL, Hancock RE, Brinkman FS, Lynn DJ. InnateDB: systems biology of innate immunity and beyond—recent updates and continuing curation. Nucleic Acids Res 2013, 41:D1228–D1233. [DOI] [PMC free article] [PubMed] [Google Scholar]
- 28. Galagan JE, Sisk P, Stolte C, Weiner B, Koehrsen M, Wymore F, Reddy TB, Zucker JD, Engels R, Gellesch M, et al. TB database 2010: overview and update. Tuberculosis (Edinb) 2010, 90:225–235. [DOI] [PubMed] [Google Scholar]
- 29. Aderem A, Adkins JN, Ansong C, Galagan J, Kaiser S, Korth MJ, Law GL, McDermott JG, Proll SC, Rosenberger C, et al. A systems biology approach to infectious disease research: innovating the pathogen‐host research paradigm. MBio 2011, 2:e00325–e00410. [DOI] [PMC free article] [PubMed] [Google Scholar]
- 30. Shay T, Kang J. Immunological genome project and systems immunology. Trends Immunol 2013, 34:602–609. [DOI] [PMC free article] [PubMed] [Google Scholar]
- 31. Arda HE, Walhout AJ. Gene‐centered regulatory networks. Brief Funct Genomics 2010, 9:4–12. [DOI] [PMC free article] [PubMed] [Google Scholar]
- 32. Park PJ. ChIP‐seq: advantages and challenges of a maturing technology. Nat Rev Genet 2009, 10:669–680. [DOI] [PMC free article] [PubMed] [Google Scholar]
- 33. Lee WP, Tzou WS. Computational methods for discovering gene networks from expression data. Brief Bioinform 2009, 10:408–423. [DOI] [PubMed] [Google Scholar]
- 34. De Smet R, Marchal K. Advantages and limitations of current network inference methods. Nat Rev Microbiol 2010, 8:717–729. [DOI] [PubMed] [Google Scholar]
- 35. Marbach D, Costello JC, Kuffner R, Vega NM, Prill RJ, Camacho DM, Allison KR, Consortium D, Kellis M, Collins JJ, et al. Wisdom of crowds for robust gene network inference. Nat Methods 2012, 9:796–804. [DOI] [PMC free article] [PubMed] [Google Scholar]
- 36. Ruffner H, Bauer A, Bouwmeester T. Human protein‐protein interaction networks and the value for drug discovery. Drug Discov Today 2007, 12:709–716. [DOI] [PubMed] [Google Scholar]
- 37. Li S, Armstrong CM, Bertin N, Ge H, Milstein S, Boxem M, Vidalain PO, Han JD, Chesneau A, Hao T, et al. A map of the interactome network of the metazoan C. elegans . Science 2004, 303:540–543. [DOI] [PMC free article] [PubMed] [Google Scholar]
- 38. Rain JC, Selig L, De Reuse H, Battaglia V, Reverdy C, Simon S, Lenzen G, Petel F, Wojcik J, Schachter V, et al. The protein‐protein interaction map of Helicobacter pylori . Nature 2001, 409:211–215. [DOI] [PubMed] [Google Scholar]
- 39. Stelzl U, Worm U, Lalowski M, Haenig C, Brembeck FH, Goehler H, Stroedicke M, Zenkner M, Schoenherr A, Koeppen S, et al. A human protein‐protein interaction network: a resource for annotating the proteome. Cell 2005, 122:957–968. [DOI] [PubMed] [Google Scholar]
- 40. Butland G, Peregrin‐Alvarez JM, Li J, Yang W, Yang X, Canadien V, Starostine A, Richards D, Beattie B, Krogan N, et al. Interaction network containing conserved and essential protein complexes in Escherichia coli . Nature 2005, 433:531–537. [DOI] [PubMed] [Google Scholar]
- 41. Ewing RM, Chu P, Elisma F, Li H, Taylor P, Climie S, McBroom‐Cerajewski L, Robinson MD, O'Connor L, Li M, et al. Large‐scale mapping of human protein‐protein interactions by mass spectrometry. Mol Syst Biol 2007, 3:89. [DOI] [PMC free article] [PubMed] [Google Scholar]
- 42. Gavin AC, Bosche M, Krause R, Grandi P, Marzioch M, Bauer A, Schultz J, Rick JM, Michon AM, Cruciat CM, et al. Functional organization of the yeast proteome by systematic analysis of protein complexes. Nature 2002, 415:141–147. [DOI] [PubMed] [Google Scholar]
- 43. Gupta S, Wallqvist A, Bondugula R, Ivanic J, Reifman J. Unraveling the conundrum of seemingly discordant protein‐protein interaction datasets. Conf Proc IEEE Eng Med Biol Soc 2010, 2010:783–786. [DOI] [PubMed] [Google Scholar]
- 44. Ivanic J, Yu X, Wallqvist A, Reifman J. Influence of protein abundance on high‐throughput protein‐protein interaction detection. PLoS One 2009, 4:e5815. [DOI] [PMC free article] [PubMed] [Google Scholar]
- 45. Varjosalo M, Sacco R, Stukalov A, van Drogen A, Planyavsky M, Hauri S, Aebersold R, Bennett KL, Colinge J, Gstaiger M, et al. Interlaboratory reproducibility of large‐scale human protein‐complex analysis by standardized AP‐MS. Nat Methods 2013, 10:307–314. [DOI] [PubMed] [Google Scholar]
- 46. Hyduke DR, Palsson BO. Towards genome‐scale signalling network reconstructions. Nat Rev Genet 2010, 11:297–307. [DOI] [PubMed] [Google Scholar]
- 47. Balazsi G, Barabasi AL, Oltvai ZN. Topological units of environmental signal processing in the transcriptional regulatory network of Escherichia coli . Proc Natl Acad Sci USA 2005, 102:7841–7846. [DOI] [PMC free article] [PubMed] [Google Scholar]
- 48. Chuang HY, Lee E, Liu YT, Lee D, Ideker T. Network‐based classification of breast cancer metastasis. Mol Syst Biol 2007, 3:140. [DOI] [PMC free article] [PubMed] [Google Scholar]
- 49. Dutta B, Pusztai L, Qi Y, Andre F, Lazar V, Bianchini G, Ueno N, Agarwal R, Wang B, Shiang CY, et al. A network‐based, integrative study to identify core biological pathways that drive breast cancer clinical subtypes. Br J Cancer 2012, 106:1107–1116. [DOI] [PMC free article] [PubMed] [Google Scholar]
- 50. Dutta B, Wallqvist A, Reifman J. PathNet: a tool for pathway analysis using topological information. Source Code Biol Med 2012, 7:10. [DOI] [PMC free article] [PubMed] [Google Scholar]
- 51. Tarca AL, Draghici S, Khatri P, Hassan SS, Mittal P, Kim JS, Kim CJ, Kusanovic JP, Romero R. A novel signaling pathway impact analysis. Bioinformatics 2009, 25:75–82. [DOI] [PMC free article] [PubMed] [Google Scholar]
- 52. Bindea G, Mlecnik B, Hackl H, Charoentong P, Tosolini M, Kirilovsky A, Fridman WH, Pages F, Trajanoski Z, Galon J. ClueGO: a Cytoscape plug‐in to decipher functionally grouped gene ontology and pathway annotation networks. Bioinformatics 2009, 25:1091–1093. [DOI] [PMC free article] [PubMed] [Google Scholar]
- 53. Maere S, Heymans K, Kuiper M. BiNGO: a Cytoscape plugin to assess overrepresentation of gene ontology categories in biological networks. Bioinformatics 2005, 21:3448–3449. [DOI] [PubMed] [Google Scholar]
- 54. Montojo J, Zuberi K, Rodriguez H, Kazi F, Wright G, Donaldson SL, Morris Q, Bader GD. GeneMANIA Cytoscape plugin: fast gene function predictions on the desktop. Bioinformatics 2010, 26:2927–2928. [DOI] [PMC free article] [PubMed] [Google Scholar]
- 55. Bindea G, Galon J, Mlecnik B. CluePedia Cytoscape plugin: pathway insights using integrated experimental and in silico data. Bioinformatics 2013, 29:661–663. [DOI] [PMC free article] [PubMed] [Google Scholar]
- 56. Bader GD, Hogue CW. An automated method for finding molecular complexes in large protein interaction networks. BMC Bioinformatics 2003, 4:2. [DOI] [PMC free article] [PubMed] [Google Scholar]
- 57. Luo W, Brouwer C. Pathview: an R/Bioconductor package for pathway‐based data integration and visualization. Bioinformatics 2013, 29:1830–1831. [DOI] [PMC free article] [PubMed] [Google Scholar]
- 58. Beisser D, Klau GW, Dandekar T, Muller T, Dittrich MT. BioNet: an R‐Package for the functional analysis of biological networks. Bioinformatics 2010, 26:1129–1130. [DOI] [PubMed] [Google Scholar]
- 59. Castro MA, Wang X, Fletcher MN, Meyer KB, Markowetz F. RedeR: R/Bioconductor package for representing modular structures, nested networks and multiple levels of hierarchical associations. Genome Biol 2012, 13:R29. [DOI] [PMC free article] [PubMed] [Google Scholar]
- 60. Cerami EG, Gross BE, Demir E, Rodchenkov I, Babur O, Anwar N, Schultz N, Bader GD, Sander C. Pathway Commons, a web resource for biological pathway data. Nucleic Acids Res 2011, 39:D685–D690. [DOI] [PMC free article] [PubMed] [Google Scholar]
- 61. Saito R, Smoot ME, Ono K, Ruscheinski J, Wang PL, Lotia S, Pico AR, Bader GD, Ideker T. A travel guide to Cytoscape plugins. Nat Methods 2012, 9:1069–1076. [DOI] [PMC free article] [PubMed] [Google Scholar]
- 62. Barabasi AL, Albert R. Emergence of scaling in random networks. Science 1999, 286:509–512. [DOI] [PubMed] [Google Scholar]
- 63. Yu H, Kim PM, Sprecher E, Trifonov V, Gerstein M. The importance of bottlenecks in protein networks: correlation with gene essentiality and expression dynamics. PLoS Comput Biol 2007, 3:e59. [DOI] [PMC free article] [PubMed] [Google Scholar]
- 64. Ishii KJ, Koyama S, Nakagawa A, Coban C, Akira S. Host innate immune receptors and beyond: making sense of microbial infections. Cell Host Microbe 2008, 3:352–363. [DOI] [PubMed] [Google Scholar]
- 65. Paludan SR, Bowie AG. Immune sensing of DNA. Immunity 2013, 38:870–880. [DOI] [PMC free article] [PubMed] [Google Scholar]
- 66. Satija R, Shalek AK. Heterogeneity in immune responses: from populations to single cells. Trends Immunol 2014, 35:219–229. [DOI] [PMC free article] [PubMed] [Google Scholar]
- 67. Zak DE, Aderem A. Systems biology of innate immunity. Immunol Rev 2009, 227:264–282. [DOI] [PMC free article] [PubMed] [Google Scholar]
- 68. Gilchrist M, Thorsson V, Li B, Rust AG, Korb M, Roach JC, Kennedy K, Hai T, Bolouri H, Aderem A. Systems biology approaches identify ATF3 as a negative regulator of Toll‐like receptor 4. Nature 2006, 441:173–178. [DOI] [PubMed] [Google Scholar]
- 69. Elkon R, Linhart C, Halperin Y, Shiloh Y, Shamir R. Functional genomic delineation of TLR‐induced transcriptional networks. BMC Genomics 2007, 8:394. [DOI] [PMC free article] [PubMed] [Google Scholar]
- 70. Ramsey SA, Klemm SL, Zak DE, Kennedy KA, Thorsson V, Li B, Gilchrist M, Gold ES, Johnson CD, Litvak V, et al. Uncovering a macrophage transcriptional program by integrating evidence from motif scanning and expression dynamics. PLoS Comput Biol 2008, 4:e1000021. [DOI] [PMC free article] [PubMed] [Google Scholar]
- 71. Litvak V, Ratushny AV, Lampano AE, Schmitz F, Huang AC, Raman A, Rust AG, Bergthaler A, Aitchison JD, Aderem A. A FOXO3‐IRF7 gene regulatory circuit limits inflammatory sequelae of antiviral responses. Nature 2012, 490:421–425. [DOI] [PMC free article] [PubMed] [Google Scholar]
- 72. Calvano SE, Xiao W, Richards DR, Felciano RM, Baker HV, Cho RJ, Chen RO, Brownstein BH, Cobb JP, Tschoeke SK, et al. A network‐based analysis of systemic inflammation in humans. Nature 2005, 437:1032–1037. [DOI] [PubMed] [Google Scholar]
- 73. Seok J, Xiao W, Moldawer LL, Davis RW, Covert MW. A dynamic network of transcription in LPS‐treated human subjects. BMC Syst Biol 2009, 3:78. [DOI] [PMC free article] [PubMed] [Google Scholar]
- 74. Amit I, Garber M, Chevrier N, Leite AP, Donner Y, Eisenhaure T, Guttman M, Grenier JK, Li W, Zuk O, et al. Unbiased reconstruction of a mammalian transcriptional network mediating pathogen responses. Science 2009, 326:257–263. [DOI] [PMC free article] [PubMed] [Google Scholar]
- 75. Amit I, Regev A, Hacohen N. Strategies to discover regulatory circuits of the mammalian immune system. Nat Rev Immunol 2011, 11:873–880. [DOI] [PMC free article] [PubMed] [Google Scholar]
- 76. Garber M, Yosef N, Goren A, Raychowdhury R, Thielke A, Guttman M, Robinson J, Minie B, Chevrier N, Itzhaki Z, et al. A high‐throughput chromatin immunoprecipitation approach reveals principles of dynamic gene regulation in mammals. Mol Cell 2012, 47:810–822. [DOI] [PMC free article] [PubMed] [Google Scholar]
- 77. Konig R, Stertz S, Zhou Y, Inoue A, Hoffmann HH, Bhattacharyya S, Alamares JG, Tscherne DM, Ortigoza MB, Liang Y, et al. Human host factors required for influenza virus replication. Nature 2010, 463:813–817. [DOI] [PMC free article] [PubMed] [Google Scholar]
- 78. Rual JF, Venkatesan K, Hao T, Hirozane‐Kishikawa T, Dricot A, Li N, Berriz GF, Gibbons FD, Dreze M, Ayivi‐Guedehoussou N, et al. Towards a proteome‐scale map of the human protein‐protein interaction network. Nature 2005, 437:1173–1178. [DOI] [PubMed] [Google Scholar]
- 79. Spooner CJ, Cheng JX, Pujadas E, Laslo P, Singh H. A recurrent network involving the transcription factors PU.1 and Gfi1 orchestrates innate and adaptive immune cell fates. Immunity 2009, 31:576–586. [DOI] [PMC free article] [PubMed] [Google Scholar]
- 80. Laslo P, Spooner CJ, Warmflash A, Lancki DW, Lee HJ, Sciammas R, Gantner BN, Dinner AR, Singh H. Multilineage transcriptional priming and determination of alternate hematopoietic cell fates. Cell 2006, 126:755–766. [DOI] [PubMed] [Google Scholar]
- 81. Ku CJ, Wang Y, Weiner OD, Altschuler SJ, Wu LF. Network crosstalk dynamically changes during neutrophil polarization. Cell 2012, 149:1073–1083. [DOI] [PMC free article] [PubMed] [Google Scholar]
- 82. Xue J, Schmidt SV, Sander J, Draffehn A, Krebs W, Quester I, De Nardo D, Gohel TD, Emde M, Schmidleithner L, et al. Transcriptome‐based network analysis reveals a spectrum model of human macrophage activation. Immunity 2014, 40:274–288. [DOI] [PMC free article] [PubMed] [Google Scholar]
- 83. Miller JC, Brown BD, Shay T, Gautier EL, Jojic V, Cohain A, Pandey G, Leboeuf M, Elpek KG, Helft J, et al. Deciphering the transcriptional network of the dendritic cell lineage. Nat Immunol 2012, 13:888–899. [DOI] [PMC free article] [PubMed] [Google Scholar]
- 84. Wu C, Yosef N, Thalhamer T, Zhu C, Xiao S, Kishi Y, Regev A, Kuchroo VK. Induction of pathogenic TH17 cells by inducible salt‐sensing kinase SGK1. Nature 2013, 496:513–517. [DOI] [PMC free article] [PubMed] [Google Scholar]
- 85. Cahan P, Li H, Morris SA, Lummertz da Rocha E, Daley GQ, Collins JJ. CellNet: network biology applied to stem cell engineering. Cell 2014, 158:903–915. [DOI] [PMC free article] [PubMed] [Google Scholar]
- 86. Morris SA, Cahan P, Li H, Zhao AM, San Roman AK, Shivdasani RA, Collins JJ, Daley GQ. Dissecting engineered cell types and enhancing cell fate conversion via CellNet. Cell 2014, 158:889–902. [DOI] [PMC free article] [PubMed] [Google Scholar]
- 87. Li S, Wang L, Berman M, Kong YY, Dorf ME. Mapping a dynamic innate immunity protein interaction network regulating type I interferon production. Immunity 2011, 35:426–440. [DOI] [PMC free article] [PubMed] [Google Scholar]
- 88. Chevrier N, Mertins P, Artyomov MN, Shalek AK, Iannacone M, Ciaccio MF, Gat‐Viks I, Tonti E, DeGrace MM, Clauser KR, et al. Systematic discovery of TLR signaling components delineates viral‐sensing circuits. Cell 2011, 147:853–867. [DOI] [PMC free article] [PubMed] [Google Scholar]
- 89. Lee MN, Roy M, Ong SE, Mertins P, Villani AC, Li W, Dotiwala F, Sen J, Doench JG, Orzalli MH, et al. Identification of regulators of the innate immune response to cytosolic DNA and retroviral infection by an integrative approach. Nat Immunol 2013, 14:179–185. [DOI] [PMC free article] [PubMed] [Google Scholar]
- 90. O'Neill LA, Golenbock D, Bowie AG. The history of Toll‐like receptors—redefining innate immunity. Nat Rev Immunol 2013, 13:453–460. [DOI] [PubMed] [Google Scholar]
- 91. Seth RB, Sun L, Ea CK, Chen ZJ. Identification and characterization of MAVS, a mitochondrial antiviral signaling protein that activates NF‐κB and IRF 3. Cell 2005, 122:669–682. [DOI] [PubMed] [Google Scholar]
- 92. Subramanian N, Natarajan K, Clatworthy MR, Wang Z, Germain RN. The adaptor MAVS promotes NLRP3 mitochondrial localization and inflammasome activation. Cell 2013, 153:348–361. [DOI] [PMC free article] [PubMed] [Google Scholar]
- 93. Meylan E, Curran J, Hofmann K, Moradpour D, Binder M, Bartenschlager R, Tschopp J. Cardif is an adaptor protein in the RIG‐I antiviral pathway and is targeted by hepatitis C virus. Nature 2005, 437:1167–1172. [DOI] [PubMed] [Google Scholar]
- 94. Kawai T, Takahashi K, Sato S, Coban C, Kumar H, Kato H, Ishii KJ, Takeuchi O, Akira S. IPS‐1, an adaptor triggering RIG‐I‐ and Mda5‐mediated type I interferon induction. Nat Immunol 2005, 6:981–988. [DOI] [PubMed] [Google Scholar]
- 95. Irving AT, Mimuro H, Kufer TA, Lo C, Wheeler R, Turner LJ, Thomas BJ, Malosse C, Gantier MP, Casillas LN, et al. The immune receptor NOD1 and kinase RIP2 interact with bacterial peptidoglycan on early endosomes to promote autophagy and inflammatory signaling. Cell Host Microbe 2014, 15:623–635. [DOI] [PubMed] [Google Scholar]
- 96. Nakamura N, Lill JR, Phung Q, Jiang Z, Bakalarski C, de Maziere A, Klumperman J, Schlatter M, Delamarre L, Mellman I. Endosomes are specialized platforms for bacterial sensing and NOD2 signalling. Nature 2014, 509:240–244. [DOI] [PubMed] [Google Scholar]
- 97. Park S, Juliana C, Hong S, Datta P, Hwang I, Fernandes‐Alnemri T, Yu JW, Alnemri ES. The mitochondrial antiviral protein MAVS associates with NLRP3 and regulates its inflammasome activity. J Immunol 2013, 191:4358–4366. [DOI] [PMC free article] [PubMed] [Google Scholar]
- 98. Dixit E, Boulant S, Zhang Y, Lee AS, Odendall C, Shum B, Hacohen N, Chen ZJ, Whelan SP, Fransen M, et al. Peroxisomes are signaling platforms for antiviral innate immunity. Cell 2010, 141:668–681. [DOI] [PMC free article] [PubMed] [Google Scholar]
- 99. Trinchieri G, Sher A. Cooperation of Toll‐like receptor signals in innate immune defence. Nat Rev Immunol 2007, 7:179–190. [DOI] [PubMed] [Google Scholar]
- 100. Makela SM, Strengell M, Pietila TE, Osterlund P, Julkunen I. Multiple signaling pathways contribute to synergistic TLR ligand‐dependent cytokine gene expression in human monocyte‐derived macrophages and dendritic cells. J Leukoc Biol 2009, 85:664–672. [DOI] [PubMed] [Google Scholar]
- 101. van Heel DA, Ghosh S, Butler M, Hunt K, Foxwell BM, Mengin‐Lecreulx D, Playford RJ. Synergistic enhancement of Toll‐like receptor responses by NOD1 activation. Eur J Immunol 2005, 35:2471–2476. [DOI] [PubMed] [Google Scholar]
- 102. Goodridge HS, Underhill DM. Fungal recognition by TLR2 and Dectin‐1. Handb Exp Pharmacol 2008, 183:87–109. [DOI] [PubMed] [Google Scholar]
- 103. Rawlings DJ, Schwartz MA, Jackson SW, Meyer‐Bahlburg A. Integration of B cell responses through Toll‐like receptors and antigen receptors. Nat Rev Immunol 2012, 12:282–294. [DOI] [PMC free article] [PubMed] [Google Scholar]
- 104. Petterson T, Jendholm J, Mansson A, Bjartell A, Riesbeck K, Cardell LO. Effects of NOD‐like receptors in human B lymphocytes and crosstalk between NOD1/NOD2 and Toll‐like receptors. J Leukoc Biol 2011, 89:177–187. [DOI] [PubMed] [Google Scholar]
- 105. Blander JM, Medzhitov R. Toll‐dependent selection of microbial antigens for presentation by dendritic cells. Nature 2006, 440:808–812. [DOI] [PubMed] [Google Scholar]
- 106. Qiao Y, Giannopoulou EG, Chan CH, Park SH, Gong S, Chen J, Hu X, Elemento O, Ivashkiv LB. Synergistic activation of inflammatory cytokine genes by interferon‐γ‐induced chromatin remodeling and toll‐like receptor signaling. Immunity 2013, 39:454–469. [DOI] [PMC free article] [PubMed] [Google Scholar]
- 107. Bauernfeind FG, Horvath G, Stutz A, Alnemri ES, MacDonald K, Speert D, Fernandes‐Alnemri T, Wu J, Monks BG, Fitzgerald KA, et al. Cutting edge: NF‐κB activating pattern recognition and cytokine receptors license NLRP3 inflammasome activation by regulating NLRP3 expression. J Immunol 2009, 183:787–791. [DOI] [PMC free article] [PubMed] [Google Scholar]
- 108. Mazutis L, Gilbert J, Ung WL, Weitz DA, Griffiths AD, Heyman JA. Single‐cell analysis and sorting using droplet‐based microfluidics. Nat Protoc 2013, 8:870–891. [DOI] [PMC free article] [PubMed] [Google Scholar]
- 109. Kellogg RA, Gomez‐Sjoberg R, Leyrat AA, Tay S. High‐throughput microfluidic single‐cell analysis pipeline for studies of signaling dynamics. Nat Protoc 2014, 9:1713–1726. [DOI] [PubMed] [Google Scholar]
- 110. Shalek AK, Satija R, Adiconis X, Gertner RS, Gaublomme JT, Raychowdhury R, Schwartz S, Yosef N, Malboeuf C, Lu D, et al. Single‐cell transcriptomics reveals bimodality in expression and splicing in immune cells. Nature 2013, 498:236–240. [DOI] [PMC free article] [PubMed] [Google Scholar]
- 111. Willison KR, Klug DR. Quantitative single cell and single molecule proteomics for clinical studies. Curr Opin Biotechnol 2013, 24:745–751. [DOI] [PubMed] [Google Scholar]
- 112. Ornatsky O, Bandura D, Baranov V, Nitz M, Winnik MA, Tanner S. Highly multiparametric analysis by mass cytometry. J Immunol Methods 2010, 361:1–20. [DOI] [PubMed] [Google Scholar]
- 113. Tay S, Hughey JJ, Lee TK, Lipniacki T, Quake SR, Covert MW. Single‐cell NF‐κB dynamics reveal digital activation and analogue information processing. Nature 2010, 466:267–271. [DOI] [PMC free article] [PubMed] [Google Scholar]
- 114. Gottschalk RA, Martins AJ, Sjoelund VH, Angermann BR, Lin B, Germain RN. Recent progress using systems biology approaches to better understand molecular mechanisms of immunity. Semin Immunol 2013, 25:201–208. [DOI] [PMC free article] [PubMed] [Google Scholar]
- 115. Kirouac DC, Ito C, Csaszar E, Roch A, Yu M, Sykes EA, Bader GD, Zandstra PW. Dynamic interaction networks in a hierarchically organized tissue. Mol Syst Biol 2010, 6:417. [DOI] [PMC free article] [PubMed] [Google Scholar]
- 116. Komurov K. Modeling community‐wide molecular networks of multicellular systems. Bioinformatics 2012, 28:694–700. [DOI] [PMC free article] [PubMed] [Google Scholar]
- 117. Frankenstein Z, Alon U, Cohen IR. The immune‐body cytokine network defines a social architecture of cell interactions. Biol Direct 2006, 1:32. [DOI] [PMC free article] [PubMed] [Google Scholar]
- 118. Lewis NE, Schramm G, Bordbar A, Schellenberger J, Andersen MP, Cheng JK, Patel N, Yee A, Lewis RA, Eils R, et al. Large‐scale in silico modeling of metabolic interactions between cell types in the human brain. Nat Biotechnol 2010, 28:1279–1285. [DOI] [PMC free article] [PubMed] [Google Scholar]
- 119. Munoz MA, Biro M, Weninger W. T cell migration in intact lymph nodes in vivo. Curr Opin Cell Biol 2014, 30C:17–24. [DOI] [PubMed] [Google Scholar]
- 120. Swartz MA. The physiology of the lymphatic system. Adv Drug Deliv Rev 2001, 50:3–20. [DOI] [PubMed] [Google Scholar]
- 121. Kastenmuller W, Torabi‐Parizi P, Subramanian N, Lammermann T, Germain RN. A spatially‐organized multicellular innate immune response in lymph nodes limits systemic pathogen spread. Cell 2012, 150:1235–1248. [DOI] [PMC free article] [PubMed] [Google Scholar]
- 122. Mandl JN, Liou R, Klauschen F, Vrisekoop N, Monteiro JP, Yates AJ, Huang AY, Germain RN. Quantification of lymph node transit times reveals differences in antigen surveillance strategies of naive CD4+ and CD8+ T cells. Proc Natl Acad Sci USA 2012, 109:18036–18041. [DOI] [PMC free article] [PubMed] [Google Scholar]
- 123. Bajenoff M, Egen JG, Koo LY, Laugier JP, Brau F, Glaichenhaus N, Germain RN. Stromal cell networks regulate lymphocyte entry, migration, and territoriality in lymph nodes. Immunity 2006, 25:989–1001. [DOI] [PMC free article] [PubMed] [Google Scholar]
- 124. Masopust D, Schenkel JM. The integration of T cell migration, differentiation and function. Nat Rev Immunol 2013, 13:309–320. [DOI] [PubMed] [Google Scholar]
- 125. Bajenoff M, Granjeaud S, Guerder S. The strategy of T cell antigen‐presenting cell encounter in antigen‐draining lymph nodes revealed by imaging of initial T cell activation. J Exp Med 2003, 198:715–724. [DOI] [PMC free article] [PubMed] [Google Scholar]
- 126. Girard JP, Moussion C, Forster R. HEVs, lymphatics and homeostatic immune cell trafficking in lymph nodes. Nat Rev Immunol 2012, 12:762–773. [DOI] [PubMed] [Google Scholar]
- 127. O'Dowd JM, Zavala AG, Brown CJ, Mori T, Fortunato EA. HCMV‐infected cells maintain efficient nucleotide excision repair of the viral genome while abrogating repair of the host genome. PLoS Pathog 2012, 8:e1003038. [DOI] [PMC free article] [PubMed] [Google Scholar]
- 128. de Jong HK, Parry CM, van der Poll T, Wiersinga WJ. Host‐pathogen interaction in invasive Salmonellosis. PLoS Pathog 2012, 8:e1002933. [DOI] [PMC free article] [PubMed] [Google Scholar]
- 129. Forrellad MA, Klepp LI, Gioffre A, Sabio y Garcia J, Morbidoni HR, de la Paz Santangelo M, Cataldi AA, Bigi F. Virulence factors of the Mycobacterium tuberculosis complex. Virulence 2013, 4:3–66. [DOI] [PMC free article] [PubMed] [Google Scholar]
- 130. Subramanian N, Qadri A. Lysophospholipid sensing triggers secretion of flagellin from pathogenic salmonella. Nat Immunol 2006, 7:583–589. [DOI] [PubMed] [Google Scholar]
- 131. Wu L, Estrada O, Zaborina O, Bains M, Shen L, Kohler JE, Patel N, Musch MW, Chang EB, Fu YX, et al. Recognition of host immune activation by Pseudomonas aeruginosa . Science 2005, 309:774–777. [DOI] [PubMed] [Google Scholar]
- 132. Hale BG, Batty IH, Downes CP, Randall RE. Binding of influenza A virus NS1 protein to the inter‐SH2 domain of p85 suggests a novel mechanism for phosphoinositide 3‐kinase activation. J Biol Chem 2008, 283:1372–1380. [DOI] [PubMed] [Google Scholar]
- 133. Heikkinen LS, Kazlauskas A, Melen K, Wagner R, Ziegler T, Julkunen I, Saksela K. Avian and 1918 Spanish influenza a virus NS1 proteins bind to Crk/CrkL Src homology 3 domains to activate host cell signaling. J Biol Chem 2008, 283:5719–5727. [DOI] [PubMed] [Google Scholar]
- 134. Alto NM, Weflen AW, Rardin MJ, Yarar D, Lazar CS, Tonikian R, Koller A, Taylor SS, Boone C, Sidhu SS, et al. The type III effector EspF coordinates membrane trafficking by the spatiotemporal activation of two eukaryotic signaling pathways. J Cell Biol 2007, 178:1265–1278. [DOI] [PMC free article] [PubMed] [Google Scholar]
- 135. Bartel PL, Roecklein JA, SenGupta D, Fields S. A protein linkage map of Escherichia coli bacteriophage T7. Nat Genet 1996, 12:72–77. [DOI] [PubMed] [Google Scholar]
- 136. Flajolet M, Rotondo G, Daviet L, Bergametti F, Inchauspe G, Tiollais P, Transy C, Legrain P. A genomic approach of the hepatitis C virus generates a protein interaction map. Gene 2000, 242:369–379. [DOI] [PubMed] [Google Scholar]
- 137. McCraith S, Holtzman T, Moss B, Fields S. Genome‐wide analysis of vaccinia virus protein‐protein interactions. Proc Natl Acad Sci USA 2000, 97:4879–4884. [DOI] [PMC free article] [PubMed] [Google Scholar]
- 138. Fossum E, Friedel CC, Rajagopala SV, Titz B, Baiker A, Schmidt T, Kraus T, Stellberger T, Rutenberg C, Suthram S, et al. Evolutionarily conserved herpesviral protein interaction networks. PLoS Pathog 2009, 5:e1000570. [DOI] [PMC free article] [PubMed] [Google Scholar]
- 139. Uetz P, Dong YA, Zeretzke C, Atzler C, Baiker A, Berger B, Rajagopala SV, Roupelieva M, Rose D, Fossum E, et al. Herpesviral protein networks and their interaction with the human proteome. Science 2006, 311:239–242. [DOI] [PubMed] [Google Scholar]
- 140. Calderwood MA, Venkatesan K, Xing L, Chase MR, Vazquez A, Holthaus AM, Ewence AE, Li N, Hirozane‐Kishikawa T, Hill DE, et al. Epstein‐Barr virus and virus human protein interaction maps. Proc Natl Acad Sci USA 2007, 104:7606–7611. [DOI] [PMC free article] [PubMed] [Google Scholar]
- 141. von Brunn A, Teepe C, Simpson JC, Pepperkok R, Friedel CC, Zimmer R, Roberts R, Baric R, Haas J. Analysis of intraviral protein‐protein interactions of the SARS coronavirus ORFeome. PLoS One 2007, 2:e459. [DOI] [PMC free article] [PubMed] [Google Scholar]
- 142. Parrish JR, Yu J, Liu G, Hines JA, Chan JE, Mangiola BA, Zhang H, Pacifico S, Fotouhi F, DiRita VJ, et al. A proteome‐wide protein interaction map for Campylobacter jejuni . Genome Biol 2007, 8:R130. [DOI] [PMC free article] [PubMed] [Google Scholar]
- 143. Titz B, Rajagopala SV, Goll J, Hauser R, McKevitt MT, Palzkill T, Uetz P. The binary protein interactome of Treponema pallidum—the syphilis spirochete. PLoS One 2008, 3:e2292. [DOI] [PMC free article] [PubMed] [Google Scholar]
- 144. Wang Y, Cui T, Zhang C, Yang M, Huang Y, Li W, Zhang L, Gao C, He Y, Li Y, et al. Global protein‐protein interaction network in the human pathogen Mycobacterium tuberculosis H37Rv. J Proteome Res 2010, 9:6665–6677. [DOI] [PubMed] [Google Scholar]
- 145. Marchadier E, Carballido‐Lopez R, Brinster S, Fabret C, Mervelet P, Bessieres P, Noirot‐Gros MF, Fromion V, Noirot P. An expanded protein‐protein interaction network in Bacillus subtilis reveals a group of hubs: exploration by an integrative approach. Proteomics 2011, 11:2981–2991. [DOI] [PubMed] [Google Scholar]
- 146. Arifuzzaman M, Maeda M, Itoh A, Nishikata K, Takita C, Saito R, Ara T, Nakahigashi K, Huang HC, Hirai A, et al. Large‐scale identification of protein‐protein interaction of Escherichia coli K‐12. Genome Res 2006, 16:686–691. [DOI] [PMC free article] [PubMed] [Google Scholar]
- 147. Durmus Tekir SD, Ulgen KO. Systems biology of pathogen‐host interaction: networks of protein‐protein interaction within pathogens and pathogen‐human interactions in the post‐genomic era. Biotechnol J 2013, 8:85–96. [DOI] [PMC free article] [PubMed] [Google Scholar]
- 148. Guiguemde WA, Shelat AA, Bouck D, Duffy S, Crowther GJ, Davis PH, Smithson DC, Connelly M, Clark J, Zhu F, et al. Chemical genetics of Plasmodium falciparum . Nature 2010, 465:311–315. [DOI] [PMC free article] [PubMed] [Google Scholar]
- 149. Durmus Tekir S, Cakir T, Ardic E, Sayilirbas AS, Konuk G, Konuk M, Sariyer H, Ugurlu A, Karadeniz I, Ozgur A, et al. PHISTO: pathogen‐host interaction search tool. Bioinformatics 2013, 29:1357–1358. [DOI] [PubMed] [Google Scholar]
- 150. Winnenburg R, Baldwin TK, Urban M, Rawlings C, Kohler J, Hammond‐Kosack KE. PHI‐base: a new database for pathogen host interactions. Nucleic Acids Res 2006, 34:D459–D464. [DOI] [PMC free article] [PubMed] [Google Scholar]
- 151. Kumar R, Nanduri B. HPIDB—a unified resource for host‐pathogen interactions. BMC Bioinformatics 2010, 11(suppl 6):S16. [DOI] [PMC free article] [PubMed] [Google Scholar]
- 152. Xiang Z, Tian Y, He Y. PHIDIAS: a pathogen‐host interaction data integration and analysis system. Genome Biol 2007, 8:R150. [DOI] [PMC free article] [PubMed] [Google Scholar]
- 153. Wattam AR, Abraham D, Dalay O, Disz TL, Driscoll T, Gabbard JL, Gillespie JJ, Gough R, Hix D, Kenyon R, et al. PATRIC, the bacterial bioinformatics database and analysis resource. Nucleic Acids Res 2014, 42:D581–D591. [DOI] [PMC free article] [PubMed] [Google Scholar]
- 154. Navratil V, de Chassey B, Meyniel L, Delmotte S, Gautier C, Andre P, Lotteau V, Rabourdin‐Combe C. VirHostNet: a knowledge base for the management and the analysis of proteome‐wide virus‐host interaction networks. Nucleic Acids Res 2009, 37:D661–D668. [DOI] [PMC free article] [PubMed] [Google Scholar]
- 155. Lin FK, Pan CL, Yang JM, Chuang TJ, Chen FC. CAPIH: a web interface for comparative analyses and visualization of host‐HIV protein‐protein interactions. BMC Microbiol 2009, 9:164. [DOI] [PMC free article] [PubMed] [Google Scholar]
- 156. Fahey ME, Bennett MJ, Mahon C, Jager S, Pache L, Kumar D, Shapiro A, Rao K, Chanda SK, Craik CS, et al. GPS‐Prot: a web‐based visualization platform for integrating host‐pathogen interaction data. BMC Bioinformatics 2011, 12:298. [DOI] [PMC free article] [PubMed] [Google Scholar]
- 157. Arnold R, Boonen K, Sun MG, Kim PM. Computational analysis of interactomes: current and future perspectives for bioinformatics approaches to model the host‐pathogen interaction space. Methods 2012, 57:508–518. [DOI] [PMC free article] [PubMed] [Google Scholar]
- 158. Thieu T, Joshi S, Warren S, Korkin D. Literature mining of host‐pathogen interactions: comparing feature‐based supervised learning and language‐based approaches. Bioinformatics 2012, 28:867–875. [DOI] [PubMed] [Google Scholar]
- 159. Yin L, Xu G, Torii M, Niu Z, Maisog JM, Wu C, Hu Z, Liu H. Document classification for mining host pathogen protein‐protein interactions. Artif Intell Med 2010, 49:155–160. [DOI] [PMC free article] [PubMed] [Google Scholar]
- 160. Lee SA, Chan CH, Tsai CH, Lai JM, Wang FS, Kao CY, Huang CY. Ortholog‐based protein‐protein interaction prediction and its application to inter‐species interactions. BMC Bioinformatics 2008, 9(suppl 12):S11. [DOI] [PMC free article] [PubMed] [Google Scholar]
- 161. Wuchty S. Computational prediction of host‐parasite protein interactions between P. falciparum and H. sapiens . PLoS One 2011, 6:e26960. [DOI] [PMC free article] [PubMed] [Google Scholar]
- 162. Dyer MD, Murali TM, Sobral BW. The landscape of human proteins interacting with viruses and other pathogens. PLoS Pathog 2008, 4:e32. [DOI] [PMC free article] [PubMed] [Google Scholar]
- 163. Dyer MD, Murali TM, Sobral BW. Supervised learning and prediction of physical interactions between human and HIV proteins. Infect Genet Evol 2011, 11:917–923. [DOI] [PMC free article] [PubMed] [Google Scholar]
- 164. Luo Q, Pagel P, Vilne B, Frishman D. DIMA 3.0: Domain Interaction Map. Nucleic Acids Res 2011, 39:D724–D729. [DOI] [PMC free article] [PubMed] [Google Scholar]
- 165. Davey NE, Trave G, Gibson TJ. How viruses hijack cell regulation. Trends Biochem Sci 2011, 36:159–169. [DOI] [PubMed] [Google Scholar]
- 166. Evans P, Dampier W, Ungar L, Tozeren A. Prediction of HIV‐1 virus‐host protein interactions using virus and host sequence motifs. BMC Med Genomics 2009, 2:27. [DOI] [PMC free article] [PubMed] [Google Scholar]
- 167. Xavier RJ, Rioux JD. Genome‐wide association studies: a new window into immune‐mediated diseases. Nat Rev Immunol 2008, 8:631–643. [DOI] [PMC free article] [PubMed] [Google Scholar]
- 168. Musunuru K, Strong A, Frank‐Kamenetsky M, Lee NE, Ahfeldt T, Sachs KV, Li X, Li H, Kuperwasser N, Ruda VM, et al. From noncoding variant to phenotype via SORT1 at the 1p13 cholesterol locus. Nature 2010, 466:714–719. [DOI] [PMC free article] [PubMed] [Google Scholar]
- 169. Heinig M, Petretto E, Wallace C, Bottolo L, Rotival M, Lu H, Li Y, Sarwar R, Langley SR, Bauerfeind A, et al. A trans‐acting locus regulates an anti‐viral expression network and type 1 diabetes risk. Nature 2010, 467:460–464. [DOI] [PMC free article] [PubMed] [Google Scholar]
- 170. Chen Y, Zhu J, Lum PY, Yang X, Pinto S, MacNeil DJ, Zhang C, Lamb J, Edwards S, Sieberts SK, et al. Variations in DNA elucidate molecular networks that cause disease. Nature 2008, 452:429–435. [DOI] [PMC free article] [PubMed] [Google Scholar]
- 171. Lum PY, Derry JM, Schadt EE. Integrative genomics and drug development. Pharmacogenomics 2009, 10:203–212. [DOI] [PubMed] [Google Scholar]
- 172. Schadt EE. Molecular networks as sensors and drivers of common human diseases. Nature 2009, 461:218–223. [DOI] [PubMed] [Google Scholar]
- 173. Harrold JM, Ramanathan M, Mager DE. Network‐based approaches in drug discovery and early development. Clin Pharmacol Ther 2013, 94:651–658. [DOI] [PMC free article] [PubMed] [Google Scholar]
- 174. Schadt EE, Friend SH, Shaywitz DA. A network view of disease and compound screening. Nat Rev Drug Discov 2009, 8:286–295. [DOI] [PubMed] [Google Scholar]