

Abstract
We describe an “integrated genome-phenome analysis” that combines both genomic sequence data and clinical information for genomic diagnosis. It is novel in that it uses robust diagnostic decision support and combines the clinical differential diagnosis and the genomic variants using a “pertinence” metric. This allows the analysis to be hypothesis-independent, not requiring assumptions about mode of inheritance, number of genes involved, or which clinical findings are most relevant. Using 20 genomic trios with neurologic disease, we find that pertinence scores averaging 99.9% identify the causative variant under conditions in which a genomic trio is analyzed and family-aware variant calling is done. The analysis takes seconds, and pertinence scores can be improved by clinicians adding more findings. The core conclusion is that automated genome-phenome analysis can be accurate, rapid, and efficient. We also conclude that an automated process offers a methodology for quality improvement of many components of genomic analysis.
Keywords: whole exome sequencing, diagnosis, diagnostic decision support
Much of the clinical application of whole exome and whole genome analysis has been in neurogenetic diagnosis. Although such analysis has much potential for improving diagnosis, a widespread concern is that we will have a $1000 genome with a $100 000 interpretation.1 Even though interpretation technologies have been improving, the costs and time of analysis are regularly cited as the major bottleneck in genomic analysis,2 putting severe demands on the time of scarce professionals with genomic experience. We report here on the analytical approach that defined the bottom limit of the analysis times reported in the CLARITY genome interpretation contest2 by using a hypothesis-independent approach. When, in the past, this clinical correlation has been automated, it has used rudimentary decision support consisting of lists of findings, lacking the information about disease incidence, frequency of findings, and onset age and disappearance age of findings, that is key to neurologic diagnoses.3 In addition, these approaches have required hypotheses about the mode of inheritance, the number of genes involved, and which clinical findings are most relevant.
We describe here on an integrated genome-phenome analysis that incorporates a robust clinical diagnostic decision support program that analyzes genomic variants in seconds, and does the genome-phenome correlation using a metric of pertinence of genes to the clinical picture, tying together the genome and phenome in a way that prioritizes genes of interest, and identifies the variants in each gene that can plausibly be involved.
We now provide the first detailed description and validation of this integrated genome-phenome analysis and its pertinence metric used to identify causative genes, using 20 exome trios with neurologic diagnoses. We also describe in detail our analysis of the 2 CLARITY cases2 for which causative genes were identified, previously discussed in preliminary form.4
Methods
The integrated genome-phenome analysis is based on the SimulConsult diagnostic decision support system, which has been shown to increase accuracy and reduce costs in clinical diagnosis.3 The decision support uses a detailed quantitative approach that takes into account incidence and treatability of each disease, and uses family history in a hypothesis-independent way.5 At the time of the analysis, the software included a curated database of 4912 diseases and 2734 genes, including all genes with a convincing human germline phenotype. There were 104 231 data points, with each data point describing a different finding in a different disease, and specifying the frequency of the finding in the disease, and the distribution of onset age and disappearance age. All these data are viewable from within the SimulConsult software.6
Genome analysis was integrated into the decision support by importing a “variant table” of tens of thousands of variants, and for each variant computing both monoallelic and biallelic severity scores, varying from 0 to 4, displayed to the user7 along with details of the severity score assignment. The variant severity scores were based on the type of mutation and other annotations such as variant frequency in a population, conservation scores (GERP, Grantham, Phat, and PHAST) and a functional score (PolyPhen), as detailed in the SimulConsult variant file format.8 For some analyses, a population-specific “variome” was used based on ∼1400 Middle Eastern genomes that included not only population-specific variant frequencies but also data about counts of instances in which a variant was shared in a homozygous or heterozygous way in that population. Variant severity scores were decreased based on these share counts, resulting in lower numbers of variants with nonzero severity scores when the variome was used. Monoallelic variant severity scores differed from biallelic variant severity scores in being decreased by 1 for population frequency >1%, and when the variome was used, monoallelic and biallelic variant severity scores were decremented differently as a result of the homozygous and heterozygous shares. Variant severity scores were adjusted on the basis of the number of de novo variants in the trio; when <20 de novo variants were found with raw severity score >0, the severity of de novo variants was increased by 1. Variant severity scores were decreased by 1 in trios with de novo variants >100 and 2 if >1000, resulting in different numbers of variants with severity >0 in probands and trios.
Using novelty and compound heterozygosity analysis, the severity scores for variants were combined to compute a unified severity score for each possible zygosity of each gene.7 The gene severity scores were used to adjust the degree to which the decision support software treated the abnormality in the gene as incidental versus important in affecting the probability of diagnoses.7
The output (as displayed in Segal et al4) includes a list of diseases in order of probability, and a list of zygosities found for genes for which there is a convincing human germline phenotype, in order of gene pertinence. The gene pertinence metric7 reflects the degree to which the differential diagnosis would be different if the finding (clinical or gene abnormality of the indicated zygosity) were not present, a retrospective analysis that is similar to the prospective measure of usefulness described by Segal.9 For genes, the pertinence for the indicated zygosity of a gene is given as its percentage of all pertinence assigned to genes. Rank scores in gene pertinence and disease probability lists were noted, with any rank over 100 coded as 101 to limit the effect of outliers. Ranks were not capped for gene discovery metrics.
The 20 trios were previously sequenced and analyzed manually as part of ongoing studies in the Gleeson lab, using non-family-aware (Genome Analysis Toolkit [GATK]) variant calling. The 20 trios were reanalyzed using family-aware variant calling.10 Gene variants judged to be causative were confirmed with Sanger sequencing in all 20 trios.
In the gene-discovery mode, genes with no recognized human phenotype were displayed, as well as genes in which the zygosity found did not match the known human phenotype. The zygosities for each gene were displayed, ranked by gene severity scores, after the same novelty and compound heterozygosity analysis used in the genome-phenome analysis.
Proband analyses were simulated using the trios by deleting the maternal and paternal variants from the trio variant table.8 All proband analysis was done using the non-family-aware data, because the quality scores in the family-aware variant calling data reflected parental data, and thus would not provide an appropriate simulation of the situation of analyzing just a proband.
A “nonvariant” table was simulated for 2 trios. This simulation assumed that all gene zygosities with known human phenotypes that were not abnormal in the variant table were both properly read and were normal, as opposed to the standard model in which such genes were left as unspecified. These gene zygosities were marked as absent, in addition to the usual marking of variants found as present.
Clinical descriptions, including family history, were entered into the decision support software by nurse practitioners in the Gleeson lab, using clinical summaries provided by referring clinicians. An average of 6.6 positive findings and 0.7 negative (absent) findings were used per case; negative findings were used in 4 of 20 cases. The software includes the ability to enter age of onset for each finding and include pertinent negative findings but often such detail was not available and onsets were used for 12 of 20 trios. All patients were Middle Eastern, and consanguinity (first to third cousins) was present in 16 of 20 cases.
Results and Discussion
In all 20 cases, a genetic neurologic diagnosis had been determined previously by the Gleeson group using manual methods. For 14 of the 20 trios (proband + mother + father), the causal gene was one previously described in the literature, allowing a blinded test of the integrated genome-phenome analysis. The diagnoses were biallelic disorders of the following genes: AHI1 (3 trios), C5orf42, CC2D2A, CEP290, INPP5E, POMGNT1, RPGRIP1 L, TCTN3, TMEM231, TMEM237 (2 trios), and WDR62, with only CC2D2A being a compound heterozygote (of different variants found in the third cousin parents). Although many of the causal genes were homozygous, as would be expected from the consanguinity in many cases, the genome-phenome analysis is done without any specification of inheritance mechanism to be considered or the number of genes involved; the results instead emerged in a hypothesis-independent way based on the data.
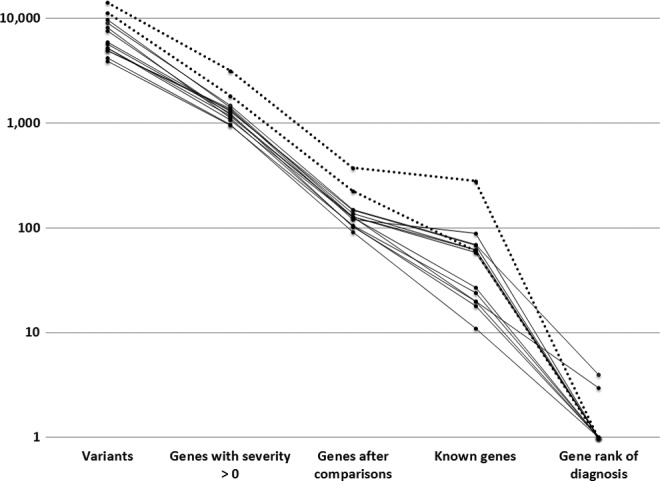
For these 14 cases with a phenotype in the medical literature, the results from the genome-phenome analysis were obtained by importing and analyzing the exome variant tables in the context of the clinical findings. The findings were entered using the standard version of the diagnostic decision support software3 by nurse practitioners from narrative material sent by referring physicians. The analysis results include gene pertinence scores, representing the question of how much the differential diagnosis would be changed if the variants had not been present. Results from these 14 trios are shown in Table 1. With trios for which family-aware variant calling was done and the Middle Eastern variome was used (left-most column), the gene variants resulted in an average of 807 genes with nonzero severity scores. Compound heterozygote analysis (and novelty analysis for trios) reduced the average number of genes after these comparisons to 89. Of these, an average of 13 had a zygosity that fit a known human phenotype. Of these genes, the automated genome-phenome analysis picked the correct gene in all cases (gene rank of diagnosis = 1.0). The gene pertinence score averaged 99.9% (Table 1 and Figure 1) and in all cases was ≥99%.
Table 1.
Identifying Pertinent Genes Beginning With Variants (Averages for n = 14).a
| Trio with family-aware calling | Trio | Proband only | ||
|---|---|---|---|---|
| Frequency data | Variome | Variome | Variome | 1000G |
| Variants | 9461 | 7126 | 7126 | 7126 |
| Genes with severity >0 | 807 | 981 | 1050 | 1398 |
| Genes after comparisonsb | 89 | 206 | 798 | 1335 |
| Known genesc | 13 | 27 | 92 | 147 |
| Gene rank of diagnosisd | 1.0 | 1.1 | 1.2 | 1.4 |
| Pertinence for no. 1 diagnosis | 99.9% | 90.8% | 89.3% | 81.6% |
| Correct gene pertinente | 100% | 79% | 79% | 64% |
| No. 1 gene = causal | 100% | 93% | 93% | 86% |
aThe analysis includes the 14 cases in which a causal gene variant was identified that corresponded to a published human germline phenotype.
bGenes after compound heterozygosity comparisons (and novelty analysis for trio).
cGenes for which the zygosity found corresponded to a known human phenotype.
dGenes with known phenotype to be evaluated manually to reach diagnosis.
ePertinence ≥99%.
Figure 1.

Pertinent genes using trios with family-aware variant calling with variome and clinical information; n = 14 (dotted lines are cases with artifactual numbers of de novo variants).
Without family-aware variant calling, the number of genes after comparisons was approximately double, yet the pertinence scores remained high enough that the average number of genes to examine to reach the correct diagnosis was 1.1, with the #1 listed gene being causal in 93% of cases (Table 1).
For a proband only, results were similar to the trios. Although the number of genes after comparisons was higher than for trios by 4- to 8-fold (depending on whether family-aware variant calling was used), the average number of genes to examine to reach the correct diagnosis was 1.2, with pertinence scores similar to those for the comparable trios (3 leftmost columns in Table 1).
When 1000 Genome frequencies were used instead of the variome, all diagnostic measures were degraded (Table 1). However, in 12 of 14 cases with only a proband and with 1000 Genome frequencies, the causal gene was still ranked #1 (Table 1 and Figure 2).
Figure 2.
Pertinent genes using proband-only with 1000 Genome and clinical information; n = 14 (dotted lines are cases with artifactual numbers of de novo variants).
Comparison of Genome-Phenome Analysis to Filtering Using a Key Finding
To assess the importance of genome-phenome analysis versus hypothesis-dependent filtering based on a key finding, we compared the rank of causative genes in these 2 approaches in the 14 cases with known diagnoses (Table 2). For the key finding approach, typically used in hypothesis-dependent approaches such as gene panels, all gene zygosities found were assessed for association with a disease in which a particular finding in the patient was present, and the gene zygosities were put in order of their severity scores. The analysis was done using probands, the most challenging of the analyses (Table 1), with an average of 92 variants for genes with known clinical phenotypes (using the Middle Eastern variome).
Table 2.
Comparison of Genome-Phenome Analysis to Filtering Using a Key Finding.a
| Gene rank of diagnosis using 1 finding | ||||
|---|---|---|---|---|
| Gene | Genome-phenome analysis rank | Best rank | Average rank (of nonmisses) | % misses |
| TCTN3 | 1.0 | 1.5 | 5.8 | 37.5 |
| AHI1 | 1.0 | 1.0 | 2.3 | 38.5 |
| TMEM237 | 1.0 | 1.0 | 1.5 | 60.0 |
| AHI1 | 4.0 | 5.0 | 5.5 | 66.7 |
| AHI1 | 1.0 | 1.0 | 1.4 | 0.0 |
| C5orf42 | 1.0 | 1.0 | 1.8 | 40.0 |
| TMEM237 | 1.0 | 1.0 | 2.1 | 50.0 |
| POMGNT1 | 1.0 | 1.0 | 1.8 | 25.0 |
| TMEM231 | 1.0 | 1.0 | 5.0 | 33.3 |
| CC2D2A | 1.0 | 2.0 | 10.2 | 0.0 |
| INPP5E | 1.0 | 1.0 | 5.7 | 0.0 |
| CEP290 | 1.0 | 1.0 | 1.0 | 40.0 |
| RPGRIP1L | 1.0 | 1.0 | 1.0 | 20.0 |
| WDR62 | 1.0 | 1.0 | 1.2 | 25.0 |
| AVERAGE | 1.2 | 1.4 | 3.3 | 31.1 |
| CLARITY 1 | ||||
| TTN | 1.0 | 2.0 | 9.1 | 28.6 |
| GJB2 | 7.0 | 9.0 | 9.0 | 85.7 |
| CLARITY 2 | ||||
| TRPM4 | 2.0 | 4.0 | 4.0 | 50.0 |
| GJA1 | 1.0 | 4.0 | 6.0 | 0.0 |
aAnalyses are using proband only, and for the non-CLARITY cases, the Middle Eastern variome.
For the genome-phenome analysis, the average gene rank was 1.2 (Tables 1 and 2). This was equal to or better than the best rank for any of the individual findings, the best of which had an average rank of 1.4 (Table 2). These differences in rank are of similar magnitude to the rank changes produced by trios versus probands (Table 1).
The key finding approach was hypothesis–dependent in that it required a judgment of which finding was key. Many of the findings (31%) resulted in errors, missing the correct gene since that finding was not associated with the gene (Table 2): if one had chosen one of these as a key finding in the hypothesis-dependent approach, one would have missed the relevant gene. Ignoring those misses, the average rank for the findings was 3.3, but in practice, missed genes would result in many more genes being examined since no suitable gene would be in the list. We did not perform an “AND” analysis combining several key findings since the high percent of misses would result in many false negatives.
Analysis in More Diverse Cases
Reflecting the case mix in the Gleeson lab, these 14 cases were from families in which there was known consanguinity in 11 families, and homozygotes were found in 13 of 14 cases. Although the genome-phenome analysis did not assume an inheritance mode, and many compound heterozygotic, monoallelic, and X-linked zygosities were in the outputs, we used our access to the CLARITY cases to do a similar analysis of the key finding approach in the 2 consanguineous cases for which pathogenic genes were identified.2,4
One was a case of a patient with myopathy, ptosis, response to cholinesterase inhibitors, and deafness. In this case, it was particularly difficult to have confidence in the key finding approach because the case was consistent with a centronuclear myopathy plus deafness, congenital myasthenia plus deafness, or mitochondrial illness explaining both muscle findings and deafness. Our analysis identifies the 2 consensus genes, for TTN-dependent myopathy and GJB2-dependent deafness.2,4 Both disorders were compound heterozygotic with outbred parents. The GJB2 diagnosis was missed by most groups, but using a trio (without family-aware variant calling), the genome-phenome analysis ranking of these genes was #1 and #2, making the identification of the second gene straightforward using the approach that was hypothesis-independent as to the number of genes involved. Using a proband only, the diagnoses were #1 and #7 in the pertinence-ranked gene list using the genome-phenome analysis, better in each case than the best of the key finding approaches (Table 2).
In a second CLARITY case, there was consensus that an autosomal dominant TRPM4 variant was pathogenic, although it accounted for only the arrhythmia part of the phenotype and not the cardiac structural abnormalities. Our analysis identified genes for each component as #1 and #2 in both trio and proband, ranks that were better than the key finding approach for both genes (Table 2).
Effect of Family-Aware Variant Calling on Number of De Novo Variants
The effect of family-aware variant calling is associated with large reductions in false de novo variant calls. For 15 of the trios, de novo variants using family-aware variant calling with raw severity score >0 ranged from 0 to 15 (average 3.2). For the other 5 trios, de novo variants ranged from 301 to 1117 (average 734); these included all trios in which family member DNA was run on different plates (4 trios) and the only trio with average coverage <70 (coverage 61 in one trio). For the 15 trios without such artifactual increases in de novo variant calls, the number of de novo calls without family-aware calling was 143 (difference from 3.2 significant at (P < .0001; Wilcoxon signed rank test). The cases with artifactually high de novo variant counts are shown with dotted lines in Figures 1 and 2. Despite the numbers of variant genes in those cases being artifactually increased, the genome-phenome analysis still ranked the correct diagnosis highest in each of those cases.
Comparing Different Analysis Components
The rapid and automated nature of the analysis allowed quantitation of the effect of functional and conservation scores on the interpretation. The effects are shown in Table 3, illustrating one condition with enhanced processing (trio with family-aware variant calling and use of the variome) and one with base processing (proband and 1000 Genome data). In both conditions, the effects on pertinence and rank of the causal gene were minor, although in one case the conservation scores prevented one variant from being ignored entirely in the analysis.
Table 3.
Effects of Functional and Conservation Scores (Averages for n = 14).
| Enhanced processinga | Base processinga | |||
|---|---|---|---|---|
| Pertinence (%) | Rank | Pertinence (%) | Rank | |
| Both used | 99.9 | 1.0 | 81.6 | 1.4 |
| Functional off | 99.9 | 1.0 | 81.5 | 1.6 |
| Conservation off | 92.7 | 8.1 | 80.0 | 1.6 |
| Neither used | 99.8 | 1.0 | 77.7 | 1.6 |
aEnhanced processing includes a trio with family-aware variant calling and use of the variome. In base processing, a proband and 1000 Genome data were used.
For disease phenotypes, the rank scores showed improvement with the same analysis components assessed above for effects on gene rankings (family-aware variant calling, trios, and clinical information; Table 4), although the disease probability rankings were not as close to 1.0 as the gene pertinence rankings. Phenotype ranks greater than 1 were seen for diagnoses such as Joubert syndrome, for which there are multiple genes and phenotypes, each listed separately in the software. In 2 of 14 trios, a different subtype of the same disease ranked higher than the one for which a gene had been found, because of a better match of the patient’s clinical findings that were entered into the genome-phenome analyzer with the curated description of the disease. The default analysis was to list gene variants as findings that were present but not to list as negative findings genes in which no variants were found. We simulated the ability to include “nonvariant” gene zygosities as well. We did so by modeling deleterious abnormalities of relevant zygosity of all other genes of known phenotype as being absent. This resulted in all other phenotypes of the correct disease moving below the correct phenotype of the correct disease, an improvement in these 2 cases quantitated for its effect on the total of 14 cases in Table 4. These differences from the ideal value of 1.0 and are of similar magnitude to the rank changes produced by trios versus probands.
Table 4.
Phenotype Rankings Using Clinical Information and the Variome (Averages for n = 14).
| Genomes | Trio | Trio | Proband | None |
|---|---|---|---|---|
| Family aware calling | Yes | No | No | N/A |
| Rank | 1.2 | 1.5 | 1.6 | 13.4 |
| Rank with nonvariants | 1.1 | 1.4 | 1.4 | 13.4 |
Gene Discovery
Six of the 20 trios were ones in which no gene with a published human phenotype of the zygosity found was determined to be causative (Gleeson et al, in preparation). For these cases, the pertinence score of the top gene in the genome-phenome analysis for the condition with family-aware calling and the variome was 74.1%, significantly different from 99.9% for causative genes with known phenotypes in the other 14 cases (P = .0002; Wilcoxon rank sum test).
The ability of the automated analysis to contribute to gene discovery was measured using the 15 cases without the artifactual increase in de novo variant calls (Table 5, using data with the variome). For trios, family-aware variant calling resulted in a 92% drop in monoallelic gene discovery candidates (P = .001; Wilcoxon signed rank test) but only a 31% drop in biallelic gene discovery candidates (P = .001; Wilcoxon signed rank test). When compared to probands, the reductions for trios with family-aware variant calling were 99.1% for monoallelic gene discovery candidates (P = .0007; Wilcoxon signed rank test) but only 61.1% for biallelic (P = .0007; Wilcoxon signed rank test).
Table 5.
Gene Discovery Candidates of Monoallelic and Biallelic Zygosity (Averages for n = 15).
| Trio with family-aware calling | Trio without family-aware calling | Reduction with family-aware calling | Proband only | Reduction with family-aware calling | |
|---|---|---|---|---|---|
| Total monoallelic | 5.1 | 62.8 | 92% | 554.2 | 99.1% |
| Total biallelic | 40.1 | 57.9 | 31% | 103.1 | 61.1% |
For the 3 of the 6 gene discovery cases without artifactual numbers of de novo variants, the rank of the causal gene was compared using different conditions (Table 6). The average number of genes that needed to be examined to find the causal gene was 6.7 for a trio with family-aware variant calling and the variome. Without family-aware variant calling, without a trio, and without the variome, the number of genes to examine in gene discovery mode was far higher (Table 6).
Table 6.
Gene Discovery Ranking of the Causal Variant (Averages for n = 3).
| Trio with family-aware calling | Trio | Proband only | ||
|---|---|---|---|---|
| Frequency data | Variome | Variome | Variome | 1000G |
| Rank | 6.7 | 30.7 | 198.0 | 392.7 |
Discussion
The integrated genome-phenome analysis combined clinical findings and a genomic variant table to generate a metric of gene pertinence that was highly useful in identifying the causal gene variant. The patients studied here had neurologic diagnoses; such diagnoses are among the most numerous in cases undergoing genomic analysis, and among the most difficult. The methods described here are generally applicable to genomic diagnosis, and the database included all genes known to have convincing human germline phenotypes. Because the analysis is hypothesis–independent and can be done in seconds, one advantage is speed and low cost of analysis. Another advantage is that the automated process allows quality-improvement studies that analyze the importance of various components of the analysis, as done here.
Although 19 of the 20 causal variants from the Gleeson lab cases were homozygous, as expected from the parental consanguinity in 16 of the cases, the analysis was done in a hypothesis-independent way and no filtering was done to enrich the variants in homozygotes. In the CLARITY cases,2,4 none of the families had consanguinity and our use of the same hypothesis-independent analysis found the relevant variants that included both compound heterozygotes and monoallelic variants.
The results of this study highlight 4 key competencies for using genomic sequencing for clinical diagnosis.
Automated Genome-Phenome Analysis and the Power of a Metric of Gene Pertinence
The pertinence metric allows rapid identification of the causal genes, providing a quantitative score that serves as a measure of confidence that a gene known to be associated with human disease is causal in a particular patient (Table 1; Figures 1 and 2). A high pertinence score (≥99%) provides a good measure of confidence that the gene and zygosity identified are causal.
The pertinence calculation is hypothesis–independent in 3 senses. It is hypothesis–independent as to the mechanism of inheritance, as evidenced by detecting homozygous, compound heterozygous, and autosomal dominant mechanisms of inheritance without a need to filter by a hypothesis about mechanism of inheritance. It is also hypothesis–independent as to the findings that are most key, as shown in Table 2, and as best exemplified by the ability to approach a case in which myopathy, mitochondrial, myasthenia or deafness panels could reasonably have been ordered. It is hypothesis–independent as to the number of genes involved, as shown by the CLARITY cases, resulting in identification of secondary genes missed by many groups, an issue for which its importance is indicated by a recent study in which 4 of 62 such children undergoing whole-exome sequencing had dual diagnoses.11
For the special case in which both diagnoses are genetic and all the patient’s genes have been analyzed, the pertinence measure we describe and validate here provides a solution to the “2 diagnosis problem” that has long been seen as a weakness in diagnostic decision support.12 By ranking both genes high in the gene pertinence list, even though one of the 2 component diseases was not as high in the disease rankings, the pertinence metric is able to use the imperfect fit of 2 diseases with the differential diagnosis of the joint phenotype and highlight the underlying genes. Furthermore, because the genome-phenome analysis incorporates data about diseases for which no gene is known to be causal, the pertinence metric also serves to minimize errors that result from failure to consider diseases not currently known to be genetic.
The importance of the automated genome-phenome approach is greatest in situations in which the analysis is done on a proband, or more than 1 gene may be involved, or there is no reliable key finding and more than 1 finding is available. The speed and hypothesis-independent nature of the genome-phenome analysis will also become more important as more of the human disease phenotypes are defined.
Cases available to labs aiming to discover new genes for well-defined clinical phenotypes, such as the Gleeson lab cases used here, can be skewed toward situations in which a key finding is available. In contrast, cases used in a previous study of this diagnostic decision support3 and the CLARITY cases2 can be closer to clinical situations in which whole-exome sequencing will be preferred over a genomic panel. Future studies should take into account such case mix in choosing cases to analyze.
The current study did not provide a good test of the importance of onset information in diagnosis because onset information was typically not available in the clinical information provided by the referring clinicians. However, such onset information was crucial in clinical cases used in a previous study of this clinical diagnostic decision support software.3 Future studies would benefit from efforts underway to have onset information provided directly by the clinicians as a result of integration of the decision support into electronic health records13 (Segal and Williams, 2014).
Implementing genomic analysis using diagnostic decision support software in clinical use allows those requesting or analyzing genomic data to follow up after the genomic analysis by highlighting other findings most useful in the diagnosis9 based on not only the clinical findings but also the genome results. This provides an opportunity not only for a clinical assessment of the genomic results but also to add to an initial set of clinical findings that could have been deficient, as in the chart review modeled in this study. Furthermore, the continued clinical involvement in interpreting the case demonstrates to the clinicians the importance of documenting detailed clinical information so as to get solid results from genomic testing,3,14 further improving the process.
Use of Trios and Family-Aware Variant Calling
For cases in which the phenotype has previously been described in the literature, using a proband alone was quite effective for a set of diagnoses that were autosomal recessive (Table 1). The key effect of family-aware variant calling was to decrease false de novo variant calls, but even for the autosomal recessive cases analyzed here, success rates and pertinence scores improved using a trio and using family-aware variant calling. The effect of the trio and family-aware variant calling for dominant inheritance is evident in the large reductions in excess candidates in gene discovery analysis (Tables 5 and 6), most striking for monoallelic zygosity.
Assessing Pathogenicity of Particular Variants
The population-specific frequencies and homozygous and heterozygous shares information in the Middle Eastern variome reduced the number of genes to be considered and improved the pertinence scores (Table 1). Similarly, knowledge of specific variants demonstrated to be pathogenic is also crucial, but was not examined here, and no information from the Human Gene Mutation Database or other databases of pathogenicity of individual variants was input in the fields for such information in the variant tables.8 In contrast, the effect of functional and conservation scores appears to be much less important (Table 3).
Coverage of all Clinically Relevant DNA Sequences
The capability to sequence all portions of genes potentially involved in known diseases is a key competence needed to avoid missing a causal genetic abnormality. The information gleaned from this process should be not only a “variant table” of abnormalities that were found but also a “nonvariant table” that reports the genes that were well sequenced but found to have no important variants. As demonstrated here by simulating such a nonvariant table, clinical analysis would be improved if labs generated not only a variant table but also a nonvariant table.
Acknowledgments
We thank Andrea Howard, Emily Spencer, and Gail Hutchinson at UCSD for entering clinical findings from the 20 cases. This work was presented in preliminary form at the American College of Medical Genetics and Genomics meeting in 2013.
Footnotes
Author Contributions: MMS designed and wrote the software, designed the study, generated the results in a blinded way and was the primary writer of the manuscript. In addition, he was a key participant in expanding the database before the study to include the completeness of gene coverage needed for the study. MA was involved in designing the input format and desired output for the software, chose the trios, and converted the variant tables into the input format. AWE-H was a key participant in expanding the database before the study to include the completeness of gene coverage needed for the study. BSH and FMDLV carried out the family-aware variant calling. GT and MSW were involved in designing the input format and analysis for the software and the clinical output, and analyzing the cases used to test the software as the first stage of this study by participating in the CLARITY competition. RAB designed and performed the statistical analysis. JG oversaw the input and desired output for the software and the design of the study.
Declaration of Conflicting Interests: The authors declared the following potential conflicts of interest with respect to the research, authorship, and/or publication of this article: MMS is employed by SimulConsult, Inc and has 1 patent pending as cited in this paper. BSH is employed by Real Time Genomics, Inc, and FMDLV was employed by Real Time Genomics at the time this work was done.
Funding: The authors disclosed receipt of the following financial support for the research, authorship, and/or publication of this article: Research reported in this publication was supported by the National Human Genome Research Institute of the National Institutes of Health under Award Number 1R43HG006974-01A1 (principal investigator: MMS). The content is solely the responsibility of the authors and does not necessarily represent the official views of the National Institutes of Health.
Ethical Approval: Informed consent procedures were approved both for the original analysis in the Gleeson group (UCSD 070870) and the automated genome-phenome analysis (New England Institutional Review Board, study number 13-072). The data sets supporting the results of this article are available in the dbGaP.
References
- 1. Mardis ER. The $1,000 genome, the $100,000 analysis? Genome Med. 2010;2:84. [DOI] [PMC free article] [PubMed] [Google Scholar]
- 2. Brownstein CA, Beggs AH, Homer N, et al. An international effort towards developing standards for best practices in analysis, interpretation and reporting of clinical genome sequencing results in the CLARITY Challenge. Genome Biol. 2014;15:R53. [DOI] [PMC free article] [PubMed] [Google Scholar]
- 3. Segal MM, Williams MS, Gropman AL, et al. Evidence-based decision support for neurological diagnosis reduces errors and unnecessary workup. J Child Neurol. 2014;29:487–492. [DOI] [PMC free article] [PubMed] [Google Scholar]
- 4. Segal MM, Williams MS, Tromp G, Gleeson JG. Genome-phenome analysis for diagnosis and gene discovery [abstract]. American College of Medical Genetics and Genomics, abstract 2013 (Printable copy at www.simulconsult.com/docs/ACMG2013.pdf).
- 5. Segal MM: Hyper-fractionation of transmission history for medical diagnostic software. US Patent 7,742,932, issued June 22, 2010.
- 6. SimulConsult Diagnostic Decision Support. www.SimulConsult.com/run/.
- 7. Segal MM: Genome-Phenome analyzer and methods of using same. US Patent Application No: 2013/0231,404, Serial No. 13/781,225
- 8. SimulConsult Integrated Genome-Phenome Analyzer Variant file format for upload and currently supported field values. http://simulconsult.com/genome/fields/
- 9. Segal MM: Systems and methods for diagnosing medical conditions. US Patent 6,754,655 issued June 22, 2004.
- 10. Cleary JG, Braithwaite R, Gaastra K, et al. Joint variant and de novo mutation identification on pedigrees from high-throughput sequencing data. J Comput Biol. 2014;21:405–419. [DOI] [PubMed] [Google Scholar]
- 11. Yang Y, Muzny DM, Reid JG, et al. Clinical whole-exome sequencing for the diagnosis of mendelian disorders. N Engl J Med. 2013;369:1502–1511. [DOI] [PMC free article] [PubMed] [Google Scholar]
- 12. Pople HE. Heuristic Methods for imposing structure on ill-structured problems: the structuring of medical diagnostics. Chapter 5 in Szolovits P., ed., Artificial Intelligence in Medicine. Boulder, CO: Westview; 1982. [Google Scholar]
- 13. Hulse NC, Wood GM, Lam S, Segal M. Integrating a diagnostic decision support tool into an electronic health record and relevant clinical workflows through standards-based exchange. American Medical Informatics Association Annual Symposium (abstract). AMIA;2014.
- 14. Teach RL, Shortliffe EH. An analysis of physician attitudes regarding computer-based clinical consultation systems. Comput Biomed Res. 1981;14:542–558. [DOI] [PubMed] [Google Scholar]