

Marko et al. show that during motor learning, children with autism are more sensitive to proprioceptive error and less sensitive to visual error than controls. These altered patterns of error sensitivity predict the volume of the anterior cerebellum—which supports this learning—and may affect the development of motor control.
Keywords: error sensitivity, proprioception, motor learning, reaching, cerebellum, autism
Abstract
Autism spectrum disorder is a developmental disorder characterized by deficits in social and communication skills and repetitive and stereotyped interests and behaviours. Although not part of the diagnostic criteria, individuals with autism experience a host of motor impairments, potentially due to abnormalities in how they learn motor control throughout development. Here, we used behavioural techniques to quantify motor learning in autism spectrum disorder, and structural brain imaging to investigate the neural basis of that learning in the cerebellum. Twenty children with autism spectrum disorder and 20 typically developing control subjects, aged 8–12, made reaching movements while holding the handle of a robotic manipulandum. In random trials the reach was perturbed, resulting in errors that were sensed through vision and proprioception. The brain learned from these errors and altered the motor commands on the subsequent reach. We measured learning from error as a function of the sensory modality of that error, and found that children with autism spectrum disorder outperformed typically developing children when learning from errors that were sensed through proprioception, but underperformed typically developing children when learning from errors that were sensed through vision. Previous work had shown that this learning depends on the integrity of a region in the anterior cerebellum. Here we found that the anterior cerebellum, extending into lobule VI, and parts of lobule VIII were smaller than normal in children with autism spectrum disorder, with a volume that was predicted by the pattern of learning from visual and proprioceptive errors. We suggest that the abnormal patterns of motor learning in children with autism spectrum disorder, showing an increased sensitivity to proprioceptive error and a decreased sensitivity to visual error, may be associated with abnormalities in the cerebellum.
Introduction
Autism spectrum disorder (ASD) is a developmental disorder characterized by impairments in social and communication skills, coincident with repetitive, stereotyped behaviours. Though the underlying physiological cause is unknown, the cerebellum has been highlighted as a key region of interest due to the relative frequency of cerebellar abnormalities found in individuals with ASD. For example, in post-mortem studies, reduced Purkinje cell numbers are the most common neuropathological finding (Ritvo et al., 1986; Bailey et al., 1998; Kemper and Bauman, 1998; Whitney et al., 2008). Furthermore, imaging studies have found that individuals with ASD exhibit reduced volumes in the cerebellar vermis (Murakami et al., 1989; Hashimoto et al., 1995; Courchesne et al., 2001; Scott et al., 2009), with some tendency for an overall increase in cerebellar volume (Murakami et al., 1989; Courchesne et al., 2001; Sparks et al., 2002; Stanfield et al., 2008).
Although damage to the cerebellum can lead to a host of cognitive deficits (Schmahmann and Sherman, 1998), a prominent symptom of cerebellar damage is motor learning impairment (Smith and Shadmehr, 2005; Xu-Wilson et al., 2009; Criscimagna-Hemminger et al., 2010; Donchin et al., 2012). Cerebellar dependent motor learning is believed to occur through the construction of internal models of action in which the brain predicts the sensory consequences of a movement (Izawa et al., 2012a). If the actual sensory feedback is different from predicted, the resulting prediction error drives motor learning by updating an internal model (Donchin et al., 2003). Individuals with ASD present a broad range of motor impairments, including impairments in simple timed movements (Jansiewicz et al., 2006), handwriting (Fuentes et al., 2009), skilled gestures (Mostofsky et al., 2006; Dowell et al., 2009) and imitation (Dziuk et al., 2007). Potentially, this broad spectrum of motor impairments, present even in infancy (Provost et al., 2007), is related to the inability of individuals with ASD to appropriately learn internal models, a lifelong developmental process.
Understanding how internal models are learned in ASD is useful, as motor learning may parallel learning of communication, language, and social skills (Gallese et al., 2004; Gidley Larson and Mostofsky, 2008; Iacoboni, 2009). In a recent series of studies we examined motor learning in ASD, focusing on a reaching task in which the children learned to compensate for a perturbation. We found that children with ASD constructed an internal model that was different than healthy controls, potentially relying more than normal on proprioception, as evidenced by their generalization patterns (Haswell et al., 2009; Izawa et al., 2012b). In contrast, children (Johnson et al., 2013) and adults (Mosconi et al., 2013) with ASD showed slower learning in a saccade adaptation paradigm, in which errors were purely visual in nature. These findings raise the possibility that, during motor learning, children with ASD have a greater than normal reliance on errors that are sensed by proprioception and a less than normal reliance on errors sensed by vision.
Here, we examined both the behavioural and the neural basis of motor learning abnormalities in autism. We quantified how children with ASD learned from visual and proprioceptive errors in their reaching movements. Using anatomical MRI, we related our behavioural measures to the volume of the cerebellar regions known to be important for learning control of reaching. We hypothesized that children with ASD would show greater than normal learning from proprioceptive errors, but less than normal learning from visual errors, and that this would be related to the volume of the sensorimotor regions of the cerebellum.
Materials and methods
Participants
We recruited 40 children, aged 8–12 years. Among these 40 children, there were an equal number of typically developing children (n = 20, age 10.3 ± 0.3, mean ± SEM, one left handed, 16 male), and children who were diagnosed with ASD (n = 20, age 10.95 ± 0.2, one left handed, 18 male). The protocol was approved by the Johns Hopkins Institutional Review Board and a legal guardian for all children provided written, informed consent.
Autism diagnosis was established using both the Autism Diagnostic Observation Schedule (ADOS-G: nine participants, 14.6 ± 1.8, mean ± SEM, or ADOS-2: 11 participants, 11.4 ±1.3, mean ± SEM) and the Autism Diagnostic Interview-Revised (ADI-R). Diagnoses were confirmed by a child neurologist with over two decades of experience with autism spectrum diagnosis (S.H.M.). Children were excluded if they had a known aetiology for autism, documented prenatal/perinatal insult, or showed evidence of psychiatric disorders based on the Diagnostic Interview for Children and Adolescents–IV (DICA-IV), with the exception of anxiety disorders, obsessive compulsive disorder, oppositional defiant disorder, or attention deficit hyperactivity disorder (ADHD). We found no effect of comorbid diagnoses on our results. Children from the typically developing group were excluded if they scored <80 on the Wechsler Intelligence Scale for Children IV (WISC-IV) Full Scale IQ, whereas children from the ASD group could be included if the Full Scale IQ was <80 as long as either the Verbal Comprehension Index or Perceptual Reasoning Index was ≥80, and the other was ≥65. Subjects were matched for gender (Fischer’s exact test, P = 0.66), age [t(38) = 1.70, P = 0.09], Perceptual Reasoning Index [t(38) = 1.74, P = 0.09], and Edinburgh Handedness score, [t(38) = −0.64, P = 0.52] (Table 1). Groups were further found to match for Verbal Comprehension Index [t(38) = 1.72, P = 0.09] but not Full Scale IQ [t(38) = 2.67, P = 0.01]; however, previous research indicates that perceptual, task-based assessments of intelligence are more appropriate for children with ASD, rather than full-scale measures of IQ (Mottron, 2004). Thus, standard practice in our lab is match groups on Perceptual Reasoning Index alone. MRI scans were examined by a radiologist for abnormalities and all children were found healthy.
Table 1.
Participant information (data are mean ± SD)
| ASD | Typically developing | |
|---|---|---|
| n | 20 | 20 |
| Males | 18 | 16 |
| Age | 10.95 ± 1.0 | 10.30 ± 1.4 |
| Perceptual Reasoning Index | 109.6 ± 13.1 | 117.7 ± 16.1 |
| Verbal Comprehension Index | 111.7 ± 15.3 | 120.1 ± 15.6 |
| Full-scale IQ | 105.6 ± 13.7 | 118.1 ± 15.9 |
| Edinburgh Handedness Score | 0.737 ± 0.5 | 0.828 ± 0.4 |
| ADOS-G/ADOS-2 | 14.6 ± 3.5/11.4 ± 4.2 | N/A |
Groups showed no significant difference in gender, age, Perceptual Reasoning Index, Verbal Comprehension Index, or handedness.
Task
The children participated in a game in which they were instructed to hold a robotic arm in their hand and ‘shoot through a target’, following a protocol similar to Marko et al. (2012). Briefly, children sat in a dark room while holding the handle of a robotic manipulandum (Fig. 1A). A screen over their hand projected information about the game. Each trial began with the child bringing the cursor, indicating hand position, into a 6 × 6 mm start box. A second, 6 × 6 mm target box then appeared 8 cm in front of the start box. Children were instructed to shoot through the target, crossing through it between 150 and 250 ms after movement onset. After their reach exceeded 8 cm in extent, a ‘pillow’ force field slowed the movement and guided the hand back to the target. Movements that were too fast or slow were indicated by colouring the target box red or blue, respectively. Successful trials were indicated by a target explosion and a point added to the child’s score. With every point, a cartoon coin temporarily appeared above the score and children were encouraged to collect as many coins as possible. At the end of the experiment the children were further rewarded by giving them the option of choosing a small toy from a collection in a bag.
Figure 1.

Experimental task. (A) Children made reaching movements to a target while holding the handle of a robotic manipulandum. On random trials, the robot perturbed the reach, causing an error. Learning from this error was measured through error-clamp trials, in which the error was clamped to zero and the forces that the children produced against the clamp walls were measured. (B and C) Hand path and cursor paths for a representative typically developing (TD) and ASD subject (B) and for the group (C). For both groups, hand error increased with increasing field strength and cursor error increased with increasing visual gain. Data were sampled at 100 Hz, and error bars represent SEM. (D) Time course of error during the reach in the perturbation trials, as quantified via velocity perpendicular to the direction of the target. Perpendicular velocity reflects both the perturbation to the hand and the online-feedback response. Perpendicular velocity increased with increasing perturbation strength, reflecting the effect of field size, but was not different between groups. (E) Proprioceptive error, experienced by the hand, measured at 50% of the maximum velocity for each movement for all perturbation conditions. Increasing field strength increased the proprioceptive error, but increasing visual gain did not. The errors experienced by the children were not different between groups.
The experiment consisted of two sessions, each ∼40-min long. Each session began with a warm-up block of 40 trials, followed by five perturbation blocks of 55 trials each. After the first session, the child left the room and returned later in the same day for a second session. Analysis was collapsed across sessions.
Perturbations
Our perturbations had two components: a proprioceptive component generated by a force field that displaced the hand, and a visual component generated by a displacement to the cursor. The perturbation to the hand was a curl force field that pushed the hand perpendicular to the direction of motion (the x- and y-coordinates are specified in Fig. 1A):
| (Equation 1) |
In Equation 1, and are components of the hand velocity vector, and is the force that the robot applied to the hand. There were three field strengths, resulting in small, medium, or large proprioceptive errors: = ±6.5, = ±13, or = ± 19.5 N.s/m.
The visual perturbation was applied through displacement of the cursor. As the hand moved, the position of the cursor was perturbed with respect to position of the hand as:
| (Equation 2) |
In Equation 2, and are components of hand position. Thus, similar to a force field, the visual perturbation acted to perturb the position of the cursor perpendicular to the direction of the target. This perturbation was a scaling via variable , which took on one of three values: = 0, = 1 or = 2. When , the cursor did not deviate from a straight line to the target. When , the cursor faithfully followed the position of the hand. When , the cursor magnified the x-displacement of the hand. These visual gains were applied to the small ( = ±6.5) and medium ( = ±13) field strengths, and the = 0 condition was applied to the large field strength ( = ±19.5), creating seven possible perturbation types. For each perturbation block, each of the seven types of perturbations were applied twice, in random order, once to perturb the arm to the right, and once to perturb the arm to the left.
Our aim was to measure how much the brain learned from each type of error. To do so, we used triplets of trials (Huang and Shadmehr, 2007): error-clamp C1, perturbation P, error-clamp C2 (Fig. 1A). During an error-clamp trial, the robot guided the hand along a stiff ‘channel’ from the start position through the target (spring coefficient = 2.5 kN/m, damping coefficient = 25 N.s/m). A force transducer in the handle of the manipulandum measured the forces produced by the hand of the child against the channel wall, which captured the motor output of the subject during that trial. We looked at the change in motor output from trial C1 to C2 as a proxy for the learning from error that was experienced in trial P.
Estimating learning from error
When the hand experiences a perturbation during a movement, on the next trial the brain will produce motor commands that predict and partially compensate for the perturbation (Thoroughman and Shadmehr, 2000). Our goal was to quantify how much the brain compensated for the experienced perturbation, as this represents how much the brain learned from error. To examine this learning on a trial-to-trial basis, we subtracted the force produced in trial C1 from the force produced in trial C2, thus treating the force in trial C1 as a baseline. This isolated the force production that occurred as a consequence of learning in response to the error that was experienced in trial P. However, throughout our experiment, errors varied in size, driving varying amounts of learning. Therefore, we chose to further examine sensitivity to error by normalizing learning by the experienced error (Marko et al., 2012). We did this for measures of proprioceptive learning and visual learning, producing a modality- and error-specific quantification of the sensitivity to error for each child.
To quantify learning from error, we use the state-space framework for error-dependent adaptation (Donchin et al., 2003):
| (Equation 3) |
In Equation 3, is the motor output on trial n, is error as sensed by vision, is error as sensed by proprioception, is a function that describes learning from error, and is a decay term. If trial n − 1 is an error-clamp, then (by definition, there are no errors in an error-clamp trial). It follows that in an [error-clamp, perturbation, error-clamp] triplet, learning from error is:
| (Equation 4) |
Results of our previous work (Marko et al., 2012) suggest that learning from error can be well approximated by a linearly separable function of visual and proprioceptive errors. In this framework, learning from error can be thought of as the sum of learning from visual error, labelled as , and learning from proprioceptive error, labelled as :
| (Equation 5) |
Using Equations 4 and 5, we calculated sensitivity to visual and proprioceptive errors, and . The coefficient in Equation 4 was found using instances of two consecutive error-clamp trials. This occurred 52 times across the duration of the experiment. We regressed the force profile in the second of the consecutive error-clamp trials onto the first, telling us how much of the motor output was retained in two consecutive movements. We found that (mean ± SEM). There was no significant difference in the value of between groups [t(38) = 0.60, P = 0.55].
In Equations 4 and 5, force and error are represented as scalar quantities for each trial. To find force in a given error-clamp trial, we measured force that the children produced at 50% of peak speed of the movement. Similarly, we measured error in perturbation trials as displacement of the hand or cursor with respect to the target at 50% of peak speed (Taig et al., 2012). This midpoint of speed did not differ between groups [t(38) = -0.12, P = 0.91], and occurred on average at 149 ms after movement onset (ASD: 149.2 ±3.8 ms, typically developing 148.5 ± 3.9 ms, mean ± SEM).
To find , we used Equation 4. Triplets were removed from analysis if 50% of max speed occurred before 100 ms from movement onset, if the hand did not successfully complete the 8 cm reach, if the hand moved further than twice the width of the target box (0.6 cm) from the midline during an error-clamp trial, or if the hand experienced a substantial error in the wrong direction (>±0.5 cm) in response to a perturbation. Additionally, within each condition, outliers were identified and removed using the P < 0.001 criterion of the median absolute deviation method. In total, this removed 6.6% ± 0.76% (mean ± SEM) of triplets per subject, with no difference in percentage of removed triplets between groups [t(38) = −1.1, P = 0.29]. Learning from error and error size were corrected for sign and collapsed to one direction. For ease of presentation, learning and error or sensitivity and error will be plotted in the first quadrant. All analysis was completed using Matlab (Mathworks), Excel (Microsoft), SPSS (IBM) or SPM (http://www.fil.ion.ucl.ac.uk/spm/).
Estimating sensitivity to error
To estimate learning from proprioceptive error, labelled as , we focused on trials in which visual error was zero (i.e. = 0 condition). For this condition, from Equation 5, we have:
| (Equation 6) |
We further examined learning from proprioception by finding the sensitivity to proprioceptive error at each field size, using the following equation:
| (Equation 7) |
In Equation 7, learning from error is normalized to the specific error that was experienced by each subject. The term estimates how much the subject learned from proprioceptive error of size .
To estimate sensitivity to visual error alone, we measured how the trial-to-trial change in motor commands was affected when proprioceptive perturbations were kept constant (at = 6.5 or = 13) and the visual perturbations were changed (from = 0 condition to = 1 or 2). Mathematically, this is equivalent to setting in Equation 5, which we measured in the = 0 condition, resulting in the following estimate of sensitivity to visual error:
| (Equation 8) |
This produced a measure of sensitivity to visual error alone, and eliminated the effects of concurrent proprioceptive error.
Brain imaging
Given the well-established role of the cerebellum in motor adaptation, we focused our imaging analyses on this structure. Specifically, we examined brain-behaviour associations with regions of the cerebellum known to be important for sensorimotor control and reach adaptation. In order to focus our analysis on these relevant cerebellar regions, we employed the mappings described by Buckner et al. (2011). In that work, the cerebellum was parcellated based on shared signal properties with regions of the cerebral cortex. This produced two functional atlases of the cerebellum. One atlas labelled each cerebellar voxel as being connected with one of seven identified regions within the cerebral cortex. The other atlas labelled each cerebellar voxel as being connected with one of 17 identified regions within the cerebral cortex (each cortical map covered the entire cortex). For the 7-network atlas, Buckner et al. (2011) found a region of the cerebellum that exhibited resting state functional connectivity to the motor and somatosensory cortices, which we will refer to as the coarse-scale sensorimotor region of the cerebellum. In Buckner et al. (2011), the connectivity between the cerebral cortex and this region of the cerebellum was validated using a movement task of the tongue, hand and foot. For the 17-network atlas, the cortical sensorimotor area was split, separating the tongue from the hand and foot representations. In the cerebellum, the sensorimotor region was more finely resolved into two corresponding networks. We focused on the cerebellar region that contained the hand representation, which we will term the fine-scale sensorimotor region of the cerebellum. Both the seven- and the 17-network cerebellar atlases were recently published as a standardized atlas with the Spatially Unbiased Infra-Tentorial (SUIT) toolbox (Diedrichsen, 2006), allowing us to isolate and examine these sensorimotor regions of the cerebellum in our participants. As we will show, we found that the anterior cerebellum, extending into lobule VI, and parts of lobule VIII, corresponded to these sensorimotor regions of the cerebellum.
For each child, we acquired a T1-weighted 3D magnetization-prepared rapid gradient-echo (MP-RAGE) brain image using a 3 T Philips Gyroscan NT (Royal Philips Electronics). The MP-RAGE scans were acquired using the following parameters: 155 coronal slices, 1 mm slice thickness, 8° flip angle, echo time = 3.0 ms, repetition time = 7 ms, matrix = 256 × 256. Two children were excluded from the analysis because of poor image quality: one due to severe motion artefact, and one for poor grey/white matter segmentation. The cerebellum was isolated and the resulting image was then registered to the SUIT template (Diedrichsen, 2006). This produced a deformation matrix, which morphed the native image to the standardized template of the cerebellum, and a cropped version of the original T1 image. We used SPM to segment the cropped image into grey matter, white matter and CSF. Using a threshold of 0.5, we then generated binary maps of the cropped image for each of the three tissue types.
To find the volume of the sensorimotor regions of the cerebellum, we used the deformation matrix of each child, produced by SUIT, to invert the atlas of the 7- and 17-network cerebellar parcellations into each child’s native space. This was multiplied by the binary tissue maps, allowing us to calculate regional volumes based on the network parcellation, for each tissue type. For both the coarse- and fine-scale sensorimotor networks, we summed the grey and white matter volume to produce a measure of total tissue volume for each child. The resulting sum was termed the coarse (or fine) -scale sensorimotor cerebellar volume.
Results
Learning from error
The children held the handle of a robotic manipulandum and reached toward a target. A perturbation perturbed their movements, as illustrated for an example ASD and typically developing subject in Fig. 1B, and for groups in Fig. 1C. As a proxy for the error induced by the perturbations, we used displacement of the hand or cursor perpendicular to the direction of the target at 50% of max speed (Fig. 1E). An ANOVA with a within-subject measure of hand displacement for various visual gains, and between-subject factor of group showed a significant effect of field strength [F(1,38) = 1575.1, P < 0.001], but found no effect of visual gain [F(2,37) =0.623, P = 0.54], and no effect of group [F(1,38) = 0.66, P = 0.42]. The time course of the error during movements is shown via the perpendicular velocity trace in Fig. 1D. The time course of error experienced during the reaching movements seemed identical in the two groups, suggesting that the errors that the two groups experienced were comparable.
Despite experiencing similar errors, the groups differed in how they learned from error. Figure 2A shows learning from proprioceptive error as estimated in each of the three field sizes. ANOVA with a within-subject repeated measure of field strength and a between-subject factor of group resulted in a significant main effect of group [F(1,38) = 5.7, P = 0.022], but no significant effects of field size [F(2,37) = 1.36, P = 0.27] or group × field interaction [F(2,37) = 0.009, P = 0.99]. Therefore, children with autism learned more from a given proprioceptive error than typically developing children.
Figure 2.

Learning in response to visual and proprioceptive errors. All error bars are between-subject SEM. (A) Adaptive response (left) and sensitivity (right) to proprioceptive errors. We found children with ASD showed increased adaptation and sensitivity to proprioceptive errors of different sizes. (B) Adaptive response to the b = 13 force field (left) and to the b = 6.5 force field (right). There was no group difference in adaptation in response to proprioceptive and visual errors given together, most clearly demonstrated by the g = 1 condition. (C) Sensitivity to visual error alone. We found children with ASD exhibited less sensitivity to visual error than typically developing (TD) children.
To further examine learning from proprioception, we calculated the sensitivity to proprioceptive error at each field size using Equation 7. The results are displayed in Fig. 2A. ANOVA with a within-subject repeated measure of field strength and between-subject factor of group revealed that across both groups, there was a significant effect of field [F(2,37) = 4.72, P = 0.015] such that sensitivity to proprioceptive error was highest for smallest errors, a pattern that we had also seen in healthy adults (Marko et al., 2012). Unique to this study, we also found a significant effect of group [F(1,38) = 4.7, P = 0.035], suggesting that sensitivity to proprioceptive error was significantly larger than normal in the ASD group, and that the ASD group learned more from proprioceptive errors than the typically developing group. There was no significant group by field interaction [F(2,37) = 0.29, P = 0.75].
We next examined the patterns of learning from visual errors. We began by first measuring learning in trials in which there were both visual and proprioceptive errors (Equation 5). This learning, labelled as , is plotted as a function of visual error for the small field (6.5, right) and the medium field (13, left) in Fig. 2B. ANOVA with a within-subject effect of field and gain and a between-subject factor group revealed a significant effect of field [F(1,38) = 5.1, P = 0.029], a significant effect of gain [F(2,37) = 20.9, P < 0.001], and a significant gain × group interaction [F(2,37) = 3.53, P = 0.039]. All other effects were not significant (P > 0.05). As there was both a proprioceptive and visual component of adaptation in these measurements, we would not anticipate any specific group effect. The interaction suggests that the rate of increasing adaptation in response to increasing visual error was different between groups. In fact, we found that the slope of learning with respect to visual gain was significantly greater in typically developing children [t(38) = −2.51, P = 0.016], implying decreased visual sensitivity in the ASD group.
It is also interesting to note that there were no group differences in adaptation for either of the = 1 conditions (the middle data point in Fig. 2B, left and right). This condition represents ‘typical’ adaptation conditions, for which previous work has indicated that the ASD group was comparable to controls (Gidley Larson et al., 2008; Haswell et al., 2009): ANOVA with a within-subject repeated measure of field strength and between-subject factor of group found no significant effect of group [F(1,38) = 0.28, P = 0.61], a significant effect of field [F(1,38) = 4.45, P = 0.042] and no significant group × field interaction [F(1,38) = 0.006, P = 0.94].
We then used Equation 8 to examine sensitivity to visual error alone. The results of this analysis are shown in Fig. 2C. Similar to proprioceptive errors, ANOVA with a within-subject repeated measure of perturbation size and between-subject factor of group revealed a significant effect of perturbation size [F(3,36) = 5.4, P = 0.004] such that sensitivity to visual error was largest for smallest visual errors, something that we also had seen in healthy adults (Marko et al., 2012). Unique to this study, we also found a significant effect of group [F(1,38) = 6.4, P = 0.016], suggesting that sensitivity to visual error was significantly smaller than normal in the ASD group and that the ASD group learned less from visual errors than the typically developing group. There was no significant interaction [F(3,36) = 0.21, P = 0.89].
As the symptoms of ASD vary along a spectrum, we wondered how sensitivity to error was distributed across subjects. In Fig. 3A we have plotted the average visual and proprioceptive error-sensitivities of each child. We found that children who exhibited greater proprioceptive error-sensitivity tended to have smaller visual error-sensitivity. This trend was true within in the ASD population alone (r = −0.57, P = 0.0089), as well as across the two populations (r = −0.54, P < 0.001). There was no significant correlation in the typically developing population alone (r = −0.35, P = 0.13).
Figure 3.

Relationship between sensitivity to visual and proprioceptive errors. (A) Average proprioceptive sensitivity (x-axis) and visual sensitivity (y-axis) for each subject. We found a significant trade-off between sensitivities, such that as sensitivity to error in one modality increased, sensitivity in the other modality decreased. (B) Overall response to error. We found children with ASD to have a greater sensitivity to proprioceptive errors and greater adaptation in response to a proprioceptive error, and typically developing (TD) children to have greater sensitivity to visual errors and greater adaptation in response to visual errors.
We have summarized the behavioural data in Fig. 3B. We found that sensitivity to proprioceptive error was significantly larger in the ASD group [t(38) = −2.1, P = 0.035], and sensitivity to visual error was significant larger in the typically developing group [t(38) = 2.5, P = 0.016]. To ensure these results were not the product of our sensitivity analysis or due to the process of normalizing by error, we looked at the average proprioceptive adaptation, , and average visual adaptation, , as well. We again found that children with ASD show greater adaptation in response to proprioceptive error [t(38) = 2.4, P = 0.022] and less adaptation in response to visual error [t(38) = −2.6, P = 0.013]. Corresponding to our sensitivity results, there was a negative correlation between the amount of adaptation in response to visual and proprioceptive errors (r = −0.32, P = 0.044). Therefore, our findings appear robust to our methods of calculating sensitivity to error.
Relationship to cerebellar anatomy
Reach adaptation is known to depend on the integrity of the cerebellum (Smith and Shadmehr, 2005; Criscimagna-Hemminger et al., 2010; Donchin et al., 2012), in particular those regions known to be involved in sensorimotor control. Thus, we hypothesized that the behavioural differences between groups may be associated with anatomical differences in the cerebellum.
To test our hypothesis, we acquired anatomical MRIs and identified the coarse- and fine-scale sensorimotor cerebellum in each child. The coarse-scale sensorimotor cerebellum is the region that, in adults, exhibits the largest resting state connectivity to the sensorimotor network of the cerebral cortex (Buckner et al., 2011). The cortical network includes the entire motor and somatosensory cortices (Yeo et al., 2011), and in the cerebellum includes the anterior cerebellum, extending into lobule VI, and parts of lobule VIII. The coarse-scale sensorimotor cerebellum is identified for a typical ASD and a typical typically developing child in Fig. 4A in red. The volume of coarse-scale sensorimotor cerebellum appeared smaller in the ASD child. Indeed, we found a significant difference in volume between groups [t(36) = −2.39, P = 0.022], with the ASD group showing a smaller volume than typically developing children (Fig. 4B).
Figure 4.
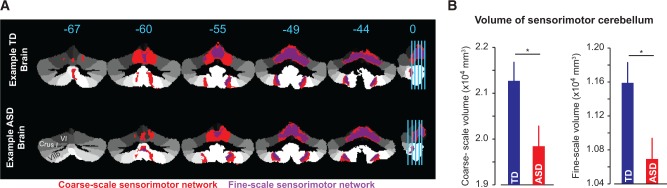
Volume of the sensorimotor cerebellar regions. (A) Example typically developing subject (top) and example ASD subject (bottom), highlighting the coarse-scale sensorimotor region in red and the fine-scale sensorimotor region in purple. The ASD subject had a smaller than normal volume for both regions. (B) Group data for the volume of both the coarse- and fine-scale sensorimotor regions, demonstrating a smaller sensorimotor cerebellar volume for children with ASD. Error bars are between-subject SEM. TD = typically developing.
We then refined our atlas by focusing only on regions of the sensorimotor cerebellum that included the hand and foot representation, but excluded the tongue representation (Yeo et al., 2011). For this fine-scale sensorimotor representation of the cerebellum, we again found that the ASD group had a significantly smaller volume [t(36) = −2.59, P = 0.013], as shown in Fig. 4B. This finding is independent of our behavioural data, and suggests that the region of the cerebellum involved in control of movements is smaller than normal in children with ASD.
To check the specificity of this result, we considered two other volumes: the total cerebellar volume, and the total brain volume. Total cerebellar volume was found as the sum of the volumes of the entire cerebellum calculated using the 7-network atlas. Total brain volume was measured by FreeSurfer, which includes the grey matter and white matter for the whole cerebrum and cerebellum, and excludes the dura, CSF and ventricles. We found no significant difference between groups, for both total cerebellar volume [t(36) = −1.67, P = 0.10] and total brain volume [t(36) = −0.54, P = 0.59].
Do the volume differences in the cerebellum relate to differences in the learning task? To understand the relationship between sensitivity to error and volume of the sensorimotor cerebellum, we used a generalized linear model. In the generalized linear model, the volume of the coarse-scale sensorimotor cerebellum for each child was the dependent variable, and the sensitivity to visual and proprioceptive errors of each child were the independent variables. As a result, the generalized linear model included factors of group, sensitivity to proprioceptive error, sensitivity to visual error, and group × sensitivity interactions. We found that the generalized linear model was significant (P = 0.008, Table 2), suggesting that these factors were important correlates of sensorimotor cerebellum volumes. The generalized linear model identified a main effect of group, a main effect of visual sensitivity, and a group × proprioceptive sensitivity interaction. The main effect of visual sensitivity indicates that, across both groups of children, as the volume of the sensorimotor cerebellum increased, visual sensitivity increased. The interaction suggests that there was a significantly more positive relationship between proprioceptive sensitivity and volume for the ASD group. All of these results were confirmed when we repeated our analysis on the volume of the fine-scale sensorimotor cerebellum (Table 3). Further, we found that the model fit improved for the fine-scale sensorimotor cerebellum (Akaike's Information Criterion: 638.7) as compared to the coarse-scale sensorimotor cerebellum (Akaike's Information Criterion: 680.9).
Table 2.
Generalized linear model results for the coarse-scale sensorimotor volume
| Omnibus Test | Likelihood ratio Chi-Square | df | Significance |
|---|---|---|---|
| 15.650 | 5 | 0.008 | |
| Tests of model effects | |||
| Source | Type III |
||
| Wald Chi-Square | df | Significance | |
| (Intercept) | 901.142 | 1 | <0.001 |
| Group | 10.482 | 1 | 0.001 |
| Proprioceptive Sensitivity | 1.593 | 1 | 0.207 |
| Visual Sensitivity | 4.799 | 1 | 0.028 |
| Group × Proprioceptive Sensitivity | 6.705 | 1 | 0.010 |
| Group × Visual Sensitivity | 1.988 | 1 | 0.159 |
Generalized linear model analysis revealed a significant main effect of visual sensitivity and a significant group by proprioceptive sensitivity interaction on the volume of the coarse-scale sensorimotor region.
Table 3.
Generalized linear model results for the fine-scale sensorimotor volume
| Omnibus Test | Likelihood ratio Chi-Square | df | Significance |
|---|---|---|---|
| 16.953 | 5 | 0.005 | |
| Tests of model effects | |||
| Source | Type III |
||
| Wald Chi-Square | df | Significance | |
| (Intercept) | 804.050 | 1 | <0.001 |
| Group | 12.126 | 1 | <.001 |
| Proprioceptive Sensitivity | 1.269 | 1 | 0.260 |
| Visual Sensitivity | 4.605 | 1 | 0.032 |
| Group × Proprioceptive Sensitivity | 7.585 | 1 | 0.006 |
| Group × Visual Sensitivity | 2.323 | 1 | 0.127 |
Generalized linear model analysis found a significant main effect of visual sensitivity and a significant group by proprioceptive sensitivity interaction on the volume of the fine-scale sensorimotor region, matching the findings for the generalized linear model analysis of the coarse-scale sensorimotor volume.
Discussion
Before being able to complete complex motor actions, one must be able to learn to produce appropriate motor commands. From infancy, these motor abilities adapt and develop as our body changes in size and strength, and as we interact with tools that have distinct dynamics. Motor impairments are present in ASD from infancy (Provost et al., 2007), and are potentially rooted in an abnormal ability to learn motor control. In the present study, we considered an elementary motor learning task in which reaching movements were perturbed (Shadmehr and Mussa-Ivaldi, 1994), resulting in errors that were sensed by proprioceptive and visual feedback. The children learned from this error, altering their motor commands on the next trial. Remarkably, children with ASD out-performed healthy controls when learning from proprioceptive errors, but under-performed when learning from visual errors. Because the task that we studied depended critically on the integrity of the cerebellum, we quantified the volume of sensorimotor regions of this structure via anatomical MRIs. We found that whereas the volume of the cerebellum as a whole, and the volume of the brain as a whole, was normal in ASD, the volume of the sensorimotor cerebellum was smaller than normal in the children with autism, and that this volume related to the patterns of learning from error. Therefore, the deficits in the sensorimotor regions of the cerebellum may underlie the motor learning abnormalities exhibited in autism.
Sensitivity to error
Perhaps one of the most interesting aspects of studying a disorder such as autism is that in certain tasks, individuals with the disorder can out-perform healthy controls. For instance, Nakano et al. (2010, 2012) studied adults with autism in their ability to integrate sensory information for the identification of an object. When asked to identify an object from visual cues, individuals with ASD made more errors than control subjects. However, when asked to identify an object based on haptic tracing, the ASD group made fewer errors than control subjects. In light of our results, these findings seem consistent with the idea that people with ASD may be better than normal in using proprioceptive information, but worse than normal in using visual information.
In another example of better than normal performance in autism, and the inspiration for our current study, we found that children with ASD showed greater than normal generalization of force field adaptation in intrinsic, or proprioceptive, coordinates (Haswell et al., 2009; Izawa et al., 2012b). In other words, after learning to fully compensate for a force field, children with ASD expressed that learning better than controls in a new workspace that was proprioceptively similar to the original workspace. We had interpreted this to reflect an increased ability to learn from proprioceptive error during motor adaptation (Haswell et al., 2009; Izawa et al., 2012b), but had been unable to directly measure learning from proprioception. In the current paper, we relied on single trial learning with a mix of visual and proprioceptive errors, and were able to measure learning from proprioceptive and visual errors to directly test our hypothesis.
Here, we found that children with ASD showed increased learning in response to proprioceptive feedback. Importantly, we also found that children with ASD showed deficient learning in response to visual feedback. This pattern is perhaps consistent with the often reported finding that individuals with ASD are less able to imitate (Williams et al., 2004; Vanvuchelen et al., 2007; Stieglitz et al., 2008; Dowell et al., 2009) or recognize biological motion (Cattaneo et al., 2007; Cook et al., 2009). Specifically, individuals with ASD show difficulties in imitation of movement kinematics, rather than emulation of a movement goal (Hobson and Hobson, 2008; Gowen, 2012; Wild et al., 2012). If the ability to learn from visual feedback regarding one’s own movements is impaired, it could potentially hinder the ability to learn a complex series of movement kinematics performed by others.
We note, however, that our measure of learning from visual error is not an absolute quantity, as learning from error can change with task parameters (Burge et al., 2008; Wei and Kording, 2009; Marko et al., 2012). For instance, in a force field adaptation task in which visual feedback was removed, adaptation occurred normally compared to adaptation with cursor feedback available, reflecting an increase in proprioceptive sensitivity (Scheidt et al., 2005). Additionally, task structure can alter sensitivity to error (Herzfeld et al., 2014), such that subjects upregulate learning in the presence of consistent errors (Gonzalez Castro et al., 2014). Perhaps this can explain our previous findings: when children with ASD were asked to make reaching movements in the presence of a visual rotation, a perturbation in which the cursor feedback is rotated relative to the reach direction causing a visual error but no proprioceptive error, children with ASD were able to adapt at normal speeds (Gidley Larson et al., 2008). Given the flexible nature of sensitivity to error, it is possible that consistent, repeated visual errors upregulate sensitivity in the ASD group. In our task, the history of the perturbations and the resulting errors were similar between the two groups, suggesting that the differences that we observed in learning from error were due to inherent group differences in error sensitivity
Autism and the cerebellum
Despite the range of potential upstream physiological causes of autism, there are still key diagnostic features that define the disorder—deficits in social and communication skills, and repetitive and stereotyped interests and behaviours. How might the cerebellum contribute to these features? It is important to note that the cerebellum is not simply a motor structure, and is reciprocally connected to association regions within the frontal cortex (Middleton and Strick, 2001) and the basal ganglia (Middleton and Strick, 2000). Children with congenital or early cerebellar insults show a range of autistic symptoms (Tavano et al., 2007), while adults with acquired cerebellar disease experience a host of non-motor symptoms, termed the Cerebellar Cognitive Affective Syndrome, impacting executive function, visual spatial abilities, language, and affect (Schmahmann and Sherman, 1998). Therefore, damage to the cerebellum can have effects far outside of the motor domain.
Importantly, the cerebellum has been the location of a number of physiological abnormalities for individuals with autism. Lower Purkinje cell numbers are the most consistent post-mortem finding (Ritvo et al., 1986; Bailey et al., 1998; Kemper and Bauman, 1998; Whitney et al., 2008). Imaging studies with targeted measurements of the vermis have found it to be smaller in size in autism (Murakami et al., 1989; Hashimoto et al., 1995; Courchesne et al., 2001; Scott et al., 2009). However, the results are not always clear, and reports of overall cerebellar volume are mixed, tending to find an overall larger volume compared to controls (Murakami et al., 1989; Courchesne et al., 2001; Sparks et al., 2002; Stanfield et al., 2008). Likewise, functional imaging studies have found children with ASD to have both reduced (Mostofsky et al., 2009) and increased (Allen and Courchesne, 2003) cerebellar activation during a simple movement task. Here, rather than examining cerebellar volume based on anatomical distinctions, we were able to examine a functional region of the cerebellum, and found a clear relationship between cerebellar volume and learning from proprioceptive and visual errors.
The sensoriomotor cerebellar network and motor learning
Dating back to the 1940’s, recordings during proprioceptive and tactile stimulation found two sets of sensory maps in the cerebellum: an inverted homunculus stretching primarily over the anterior lobe, and two smaller representations in the hemispheres of lobule VIII (Adrian, 1942; Snider and Stowell, 1944). This sensory information reaches the cerebellum through both spinocerebellar projections and neocortical afferents projected through the pontine nuclei (Manni and Petrosini, 2004). It came as no surprise, therefore, that Buckner et al. (2011) chose to validate the findings of their resting state connectivity maps with a motor task, and found corresponding functional activation for simple hand, foot, and tongue movements (see Fig. 5 in Buckner et al. 2011). But do these sensorimotor maps relate to motor adaptation? In a study of cerebellar patients using voxel-based morphometry, or a voxel-by-voxel quantification relating the density of grey matter to performance in a reaching task, Donchin et al. (2012) found that anterior regions from lobules IV–VI were related to the ability to adapt in a force field or visual motor rotation paradigm. Importantly, the region of the cerebellum most relevant to learning in our task seems to correspond to the sensorimotor cerebellum described by Buckner et al. (2011).
Apart from our behavioural results, we found that the volume of the sensorimotor region of the cerebellum was smaller than normal in children with ASD. When relating this volume to learning from error, we found a main effect of visual sensitivity and a group×proprioceptive sensitivity interaction. The main effect of visual sensitivity on volume echoes that which was described in Donchin et al. (2012): that visual motor adaptation depended on integrity of this region, and greater volume will allow for improved performance. For our task, higher visual sensitivity can be considered comparable to improved visual performance, which correlates with higher volume. Potentially, cerebellar Purkinje cell loss in ASD (Ritvo et al., 1986; Bailey et al., 1998; Kemper and Bauman, 1998; Whitney et al., 2008) may cause this reduced volume, and may subsequently reduce one’s ability to learn from visual error.
The group×proprioceptive interaction is more difficult to interpret. We found that there is a more positive relationship between volume and proprioceptive sensitivity in the ASD group than in the typically developing group. A popular theory explaining the underlying basis of ASD claims that there is a bias towards short-range connections in the brain, and against long-range connections (Mostofsky and Ewen, 2011). With no direct connections between the visual cortex and the cerebellum, visual information likely travels through the parietal cortex before it is relayed to the cerebellum through the pons (Glickstein, 2000). Proprioceptive information, however, is relayed both through the pons from the cortex, and through the spinocerebellar tract (Manni and Petrosini, 2004). Therefore proprioceptive feedback may have an advantage, relative to visual feedback, in that it can be received by the cerebellum both from the shorter path through the somatosensory cortex as well as directly through the spinocerebellar tract. This may alter the path of development, subsequently impacting volume.
A limitation of our work is that our analysis of the cerebellum relied on an atlas that was developed from anatomical data of healthy adults (Buckner et al., 2011). Our analysis is focused not only on children, but children with a developmental disorder. Although the cerebellum does have a protracted development, reaching peak volume around age 15 (Tiemeier et al., 2010), the children in our study were restricted in age and likely at a similar developmental stage. It would be exciting to track the evolution of a functional cerebellar atlas through development, even more so within an autism population. Regardless, based on anatomy alone, the region that we can best predict to be related to motor learning in the cerebellum is smaller than normal in children with ASD. This anatomical finding highlights a potential contributor to the multitude of motor impairments that impact children with ASD.
Acknowledgements
We thank Carrie Nettles and Kristie Sweeney for their tremendous work towards recruiting participants.
Glossary
Abbreviation
- ASD
autism spectrum disorder
Funding
This work was supported by grants from the NIH (1F31NS079121, NS078311, R01 NS048527-08, P41 EB015909-13), the Autism Speaks Foundation, the Johns Hopkins University School of Medicine Institute for Clinical and Translational Research, and NIH/NCRR CTSA Program, UL1-RR025005.
References
- Adrian ED. Afferent areas in the cerebellum connected with the limbs. Brain. 1942;4:289–315. [Google Scholar]
- Allen G, Courchesne E. Differential effects of developmental cerebellar abnormality on cognitive and motor functions in the cerebellum: an fMRI study of autism. Am J Psychiatry. 2003;160:262–73. doi: 10.1176/appi.ajp.160.2.262. [DOI] [PubMed] [Google Scholar]
- Bailey A, Luthert P, Dean A, Harding B, Janota I, Montgomery M, et al. A clinicopathological study of autism. Brain. 1998;121(Pt 5):889–905. doi: 10.1093/brain/121.5.889. [DOI] [PubMed] [Google Scholar]
- Buckner RL, Krienen FM, Castellanos A, Diaz JC, Yeo BT. The organization of the human cerebellum estimated by intrinsic functional connectivity. J Neurophysiol. 2011;106:2322–45. doi: 10.1152/jn.00339.2011. [DOI] [PMC free article] [PubMed] [Google Scholar]
- Burge J, Ernst MO, Banks MS. The statistical determinants of adaptation rate in human reaching. J Vis. 2008;8:20–19. doi: 10.1167/8.4.20. [DOI] [PMC free article] [PubMed] [Google Scholar]
- Cattaneo L, Fabbri-Destro M, Boria S, Pieraccini C, Monti A, Cossu G, et al. Impairment of actions chains in autism and its possible role in intention understanding. Proc Natl Acad Sci USA. 2007;104:17825–30. doi: 10.1073/pnas.0706273104. [DOI] [PMC free article] [PubMed] [Google Scholar]
- Cook J, Saygin AP, Swain R, Blakemore SJ. Reduced sensitivity to minimum-jerk biological motion in autism spectrum conditions. Neuropsychologia. 2009;47:3275–8. doi: 10.1016/j.neuropsychologia.2009.07.010. [DOI] [PMC free article] [PubMed] [Google Scholar]
- Courchesne E, Karns CM, Davis HR, Ziccardi R, Carper RA, Tigue ZD, et al. Unusual brain growth patterns in early life in patients with autistic disorder: an MRI study. Neurology. 2001;57:245–54. doi: 10.1212/wnl.57.2.245. [DOI] [PubMed] [Google Scholar]
- Criscimagna-Hemminger SE, Bastian AJ, Shadmehr R. Size of error affects cerebellar contributions to motor learning. J Neurophysiol. 2010;103:2275–84. doi: 10.1152/jn.00822.2009. [DOI] [PMC free article] [PubMed] [Google Scholar]
- Diedrichsen J. A spatially unbiased atlas template of the human cerebellum. Neuroimage. 2006;33:127–38. doi: 10.1016/j.neuroimage.2006.05.056. [DOI] [PubMed] [Google Scholar]
- Donchin O, Francis JT, Shadmehr R. Quantifying generalization from trial-by-trial behavior of adaptive systems that learn with basis functions: theory and experiments in human motor control. J Neurosci. 2003;23:9032–45. doi: 10.1523/JNEUROSCI.23-27-09032.2003. [DOI] [PMC free article] [PubMed] [Google Scholar]
- Donchin O, Rabe K, Diedrichsen J, Lally N, Schoch B, Gizewski ER, et al. Cerebellar regions involved in adaptation to force field and visuomotor perturbation. J Neurophysiol. 2012;107:134–47. doi: 10.1152/jn.00007.2011. [DOI] [PubMed] [Google Scholar]
- Dowell LR, Mahone EM, Mostofsky SH. Associations of postural knowledge and basic motor skill with dyspraxia in autism: implication for abnormalities in distributed connectivity and motor learning. Neuropsychology. 2009;23:563–70. doi: 10.1037/a0015640. [DOI] [PMC free article] [PubMed] [Google Scholar]
- Dziuk MA, Gidley Larson JC, Apostu A, Mahone EM, Denckla MB, Mostofsky SH. Dyspraxia in autism: association with motor, social, and communicative deficits. Dev Med Child Neurol. 2007;49:734–9. doi: 10.1111/j.1469-8749.2007.00734.x. [DOI] [PubMed] [Google Scholar]
- Fuentes CT, Mostofsky SH, Bastian AJ. Children with autism show specific handwriting impairments. Neurology. 2009;73:1532–7. doi: 10.1212/WNL.0b013e3181c0d48c. [DOI] [PMC free article] [PubMed] [Google Scholar]
- Gallese V, Keysers C, Rizzolatti G. A unifying view of the basis of social cognition. Trends Cogn Sci. 2004;8:396–403. doi: 10.1016/j.tics.2004.07.002. [DOI] [PubMed] [Google Scholar]
- Gidley Larson JC, Bastian AJ, Donchin O, Shadmehr R, Mostofsky SH. Acquisition of internal models of motor tasks in children with autism. Brain. 2008;131:2894–903. doi: 10.1093/brain/awn226. [DOI] [PMC free article] [PubMed] [Google Scholar]
- Gidley Larson JC, Mostofsky SH. Evidence that the pattern of visuomotor sequence learning is altered in children with autism. Autism Res. 2008;1:341–53. doi: 10.1002/aur.54. [DOI] [PMC free article] [PubMed] [Google Scholar]
- Glickstein M. How are visual areas of the brain connected to motor areas for the sensory guidance of movement? Trends Neurosci. 2000;23:613–17. doi: 10.1016/s0166-2236(00)01681-7. [DOI] [PubMed] [Google Scholar]
- Gonzalez Castro LN, Hadjiosif AM, Hemphill MA, Smith MA. Environmental consistency determines the rate of motor adaptation. Curr Biol. 2014;24:1050–61. doi: 10.1016/j.cub.2014.03.049. [DOI] [PMC free article] [PubMed] [Google Scholar]
- Gowen E. Imitation in autism: why action kinematics matter. Front Integr Neurosci. 2012;6:117. doi: 10.3389/fnint.2012.00117. [DOI] [PMC free article] [PubMed] [Google Scholar]
- Hashimoto T, Tayama M, Murakawa K, Yoshimoto T, Miyazaki M, Harada M, et al. Development of the brainstem and cerebellum in autistic patients. J Autism Dev Disord. 1995;25:1–18. doi: 10.1007/BF02178163. [DOI] [PubMed] [Google Scholar]
- Haswell CC, Izawa J, Dowell LR, Mostofsky SH, Shadmehr R. Representation of internal models of action in the autistic brain. Nat Neurosci. 2009;12:970–2. doi: 10.1038/nn.2356. [DOI] [PMC free article] [PubMed] [Google Scholar]
- Herzfeld DJ, Vaswani PA, Marko MK, Shadmehr R. A memory of errors in sensorimotor learning. Science. 2014;345:1349–53. doi: 10.1126/science.1253138. [DOI] [PMC free article] [PubMed] [Google Scholar]
- Hobson RP, Hobson JA. Dissociable aspects of imitation: a study in autism. J Exp Child Psychol. 2008;101:170–85. doi: 10.1016/j.jecp.2008.04.007. [DOI] [PubMed] [Google Scholar]
- Huang VS, Shadmehr R. Evolution of motor memory during the seconds after observation of motor error. J Neurophysiol. 2007;97:3976–85. doi: 10.1152/jn.01281.2006. [DOI] [PubMed] [Google Scholar]
- Iacoboni M. Imitation, empathy, and mirror neurons. Annu Rev Psychol. 2009;60:653–70. doi: 10.1146/annurev.psych.60.110707.163604. [DOI] [PubMed] [Google Scholar]
- Izawa J, Criscimagna-Hemminger SE, Shadmehr R. Cerebellar contributions to reach adaptation and learning sensory consequences of action. J Neurosci. 2012a;32:4230–9. doi: 10.1523/JNEUROSCI.6353-11.2012. [DOI] [PMC free article] [PubMed] [Google Scholar]
- Izawa J, Pekny SE, Marko MK, Haswell CC, Shadmehr R, Mostofsky SH. Motor learning relies on integrated sensory inputs in ADHD, but over-selectively on proprioception in autism spectrum conditions. Autism Res. 2012b;5:124–36. doi: 10.1002/aur.1222. [DOI] [PMC free article] [PubMed] [Google Scholar]
- Jansiewicz EM, Goldberg MC, Newschaffer CJ, Denckla MB, Landa R, Mostofsky SH. Motor signs distinguish children with high functioning autism and Asperger's syndrome from controls. J Autism Dev Disord. 2006;36:613–21. doi: 10.1007/s10803-006-0109-y. [DOI] [PubMed] [Google Scholar]
- Johnson BP, Rinehart NJ, White O, Millist L, Fielding J. Saccade adaptation in autism and Asperger's disorder. Neuroscience. 2013;243:76–87. doi: 10.1016/j.neuroscience.2013.03.051. [DOI] [PubMed] [Google Scholar]
- Kemper TL, Bauman M. Neuropathology of infantile autism. J Neuropathol Exp Neurol. 1998;57:645–52. doi: 10.1097/00005072-199807000-00001. [DOI] [PubMed] [Google Scholar]
- Manni E, Petrosini L. A century of cerebellar somatotopy: a debated representation. Nat Rev Neurosci. 2004;5:241–9. doi: 10.1038/nrn1347. [DOI] [PubMed] [Google Scholar]
- Marko MK, Haith AM, Harran MD, Shadmehr R. Sensitivity to prediction error in reach adaptation. J Neurophysiol. 2012;108:1752–63. doi: 10.1152/jn.00177.2012. [DOI] [PMC free article] [PubMed] [Google Scholar]
- Middleton FA, Strick PL. Basal ganglia and cerebellar loops: motor and cognitive circuits. Brain Res Brain Res Rev. 2000;31:236–50. doi: 10.1016/s0165-0173(99)00040-5. [DOI] [PubMed] [Google Scholar]
- Middleton FA, Strick PL. Cerebellar projections to the prefrontal cortex of the primate. J Neurosci. 2001;21:700–12. doi: 10.1523/JNEUROSCI.21-02-00700.2001. [DOI] [PMC free article] [PubMed] [Google Scholar]
- Mosconi MW, Luna B, Kay-Stacey M, Nowinski CV, Rubin LH, Scudder C, et al. Saccade adaptation abnormalities implicate dysfunction of cerebellar-dependent learning mechanisms in Autism Spectrum Disorders (ASD) PLoS One. 2013;8:e63709. doi: 10.1371/journal.pone.0063709. [DOI] [PMC free article] [PubMed] [Google Scholar]
- Mostofsky SH, Dubey P, Jerath VK, Jansiewicz EM, Goldberg MC, Denckla MB. Developmental dyspraxia is not limited to imitation in children with autism spectrum disorders. J Int Neuropsychol Soc. 2006;12:314–26. doi: 10.1017/s1355617706060437. [DOI] [PubMed] [Google Scholar]
- Mostofsky SH, Ewen JB. Altered connectivity and action model formation in autism is autism. Neuroscientist. 2011;17:437–48. doi: 10.1177/1073858410392381. [DOI] [PMC free article] [PubMed] [Google Scholar]
- Mostofsky SH, Powell SK, Simmonds DJ, Goldberg MC, Caffo B, Pekar JJ. Decreased connectivity and cerebellar activity in autism during motor task performance. Brain. 2009;132:2413–25. doi: 10.1093/brain/awp088. [DOI] [PMC free article] [PubMed] [Google Scholar]
- Mottron L. Matching strategies in cognitive research with individuals with high-functioning autism: current practices, instrument biases, and recommendations. J Autism Dev Disord. 2004;34:19–27. doi: 10.1023/b:jadd.0000018070.88380.83. [DOI] [PubMed] [Google Scholar]
- Murakami JW, Courchesne E, Press GA, Yeung-Courchesne R, Hesselink JR. Reduced cerebellar hemisphere size and its relationship to vermal hypoplasia in autism. Arch Neurol. 1989;46:689–94. doi: 10.1001/archneur.1989.00520420111032. [DOI] [PubMed] [Google Scholar]
- Nakano T, Kato N, Kitazawa S. Superior haptic-to-visual shape matching in autism spectrum disorders. Neuropsychologia. 2012;50:696–703. doi: 10.1016/j.neuropsychologia.2011.12.024. [DOI] [PubMed] [Google Scholar]
- Nakano T, Ota H, Kato N, Kitazawa S. Deficit in visual temporal integration in autism spectrum disorders. Proc Biol Sci. 2010;277:1027–30. doi: 10.1098/rspb.2009.1713. [DOI] [PMC free article] [PubMed] [Google Scholar]
- Provost B, Lopez BR, Heimerl S. A comparison of motor delays in young children: autism spectrum disorder, developmental delay, and developmental concerns. J Autism Dev Disord. 2007;37:321–8. doi: 10.1007/s10803-006-0170-6. [DOI] [PubMed] [Google Scholar]
- Ritvo ER, Freeman BJ, Scheibel AB, Duong T, Robinson H, Guthrie D, et al. Lower Purkinje cell counts in the cerebella of four autistic subjects: initial findings of the UCLA-NSAC Autopsy Research Report. Am J Psychiatry. 1986;143:862–6. doi: 10.1176/ajp.143.7.862. [DOI] [PubMed] [Google Scholar]
- Scheidt RA, Conditt MA, Secco EL, Mussa-Ivaldi FA. Interaction of visual and proprioceptive feedback during adaptation of human reaching movements. J Neurophysiol. 2005;93:3200–13. doi: 10.1152/jn.00947.2004. [DOI] [PubMed] [Google Scholar]
- Schmahmann JD, Sherman JC. The cerebellar cognitive affective syndrome. Brain. 1998;121 (Pt 4):561–79. doi: 10.1093/brain/121.4.561. [DOI] [PubMed] [Google Scholar]
- Scott JA, Schumann CM, Goodlin-Jones BL, Amaral DG. A comprehensive volumetric analysis of the cerebellum in children and adolescents with autism spectrum disorder. Autism Res. 2009;2:246–57. doi: 10.1002/aur.97. [DOI] [PMC free article] [PubMed] [Google Scholar]
- Shadmehr R, Mussa-Ivaldi FA. Adaptive representation of dynamics during learning of a motor task. J Neurosci. 1994;14:3208–324. doi: 10.1523/JNEUROSCI.14-05-03208.1994. [DOI] [PMC free article] [PubMed] [Google Scholar]
- Smith MA, Shadmehr R. Intact ability to learn internal models of arm dynamics in Huntington's disease but not cerebellar degeneration. J Neurophysiol. 2005;93:2809–21. doi: 10.1152/jn.00943.2004. [DOI] [PubMed] [Google Scholar]
- Snider RS, Stowell A. Receiving areas of the tactile, auditory and visual systems in the cerebellum. J Neurophysiol. 1944;7:331–57. [Google Scholar]
- Sparks BF, Friedman SD, Shaw DW, Aylward EH, Echelard D, Artru AA, et al. Brain structural abnormalities in young children with autism spectrum disorder. Neurology. 2002;59:184–92. doi: 10.1212/wnl.59.2.184. [DOI] [PubMed] [Google Scholar]
- Stanfield AC, McIntosh AM, Spencer MD, Philip R, Gaur S, Lawrie SM. Towards a neuroanatomy of autism: a systematic review and meta-analysis of structural magnetic resonance imaging studies. Eur Psychiatry. 2008;23:289–99. doi: 10.1016/j.eurpsy.2007.05.006. [DOI] [PubMed] [Google Scholar]
- Stieglitz HH, Corley M, Rajendran G, Carletta J, Swanson S. Brief report: imitation of meaningless gestures in individuals with Asperger syndrome and High-Functioning Autism. J Autism Dev Disord. 2008;38:569–73. doi: 10.1007/s10803-007-0417-x. [DOI] [PubMed] [Google Scholar]
- Taig E, Kuper M, Theysohn N, Timmann D, Donchin O. Deficient use of visual information in estimating hand position in cerebellar patients. J Neurosci. 2012;32:16274–84. doi: 10.1523/JNEUROSCI.1153-12.2012. [DOI] [PMC free article] [PubMed] [Google Scholar]
- Tavano A, Grasso R, Gagliardi C, Triulzi F, Bresolin N, Fabbro F, et al. Disorders of cognitive and affective development in cerebellar malformations. Brain. 2007;130:2646–60. doi: 10.1093/brain/awm201. [DOI] [PubMed] [Google Scholar]
- Thoroughman KA, Shadmehr R. Learning of action through adaptive combination of motor primitives. Nature. 2000;407:742–7. doi: 10.1038/35037588. [DOI] [PMC free article] [PubMed] [Google Scholar]
- Tiemeier H, Lenroot RK, Greenstein DK, Tran L, Pierson R, Giedd JN. Cerebellum development during childhood and adolescence: a longitudinal morphometric MRI study. Neuroimage. 2010;49:63–70. doi: 10.1016/j.neuroimage.2009.08.016. [DOI] [PMC free article] [PubMed] [Google Scholar]
- Vanvuchelen M, Roeyers H, De WW. Nature of motor imitation problems in school-aged boys with autism: a motor or a cognitive problem? Autism. 2007;11:225–40. doi: 10.1177/1362361307076846. [DOI] [PubMed] [Google Scholar]
- Wei K, Kording K. Relevance of error: what drives motor adaptation? J Neurophysiol. 2009;101:655–64. doi: 10.1152/jn.90545.2008. [DOI] [PMC free article] [PubMed] [Google Scholar]
- Whitney ER, Kemper TL, Bauman ML, Rosene DL, Blatt GJ. Cerebellar Purkinje cells are reduced in a subpopulation of autistic brains: a stereological experiment using calbindin-D28k. Cerebellum. 2008;7:406–16. doi: 10.1007/s12311-008-0043-y. [DOI] [PubMed] [Google Scholar]
- Wild KS, Poliakoff E, Jerrison A, Gowen E. Goal-directed and goal-less imitation in autism spectrum disorder. J Autism Dev Disord. 2012;42:1739–49. doi: 10.1007/s10803-011-1417-4. [DOI] [PubMed] [Google Scholar]
- Williams JH, Whiten A, Singh T. A systematic review of action imitation in autistic spectrum disorder. J Autism Dev Disord. 2004;34:285–99. doi: 10.1023/b:jadd.0000029551.56735.3a. [DOI] [PubMed] [Google Scholar]
- Xu-Wilson M, Chen-Harris H, Zee DS, Shadmehr R. Cerebellar contributions to adaptive control of saccades in humans. J Neurosci. 2009;29:12930–9. doi: 10.1523/JNEUROSCI.3115-09.2009. [DOI] [PMC free article] [PubMed] [Google Scholar]
- Yeo BT, Krienen FM, Sepulcre J, Sabuncu MR, Lashkari D, et al. The organization of the human cerebral cortex estimated by intrinsic functional connectivity. J Neurophysiol. 2011;106:1125–65. doi: 10.1152/jn.00338.2011. [DOI] [PMC free article] [PubMed] [Google Scholar]