Abstract
Background:
This study was designed to perform serial assessment of alterations in platelet (PLT) count, morphology and biochemical markers of PLT activation during storage of platelet concentrates (PCs) and to correlate morphological changes with these activation markers.
Materials and Methods:
Our study included the platelet-rich plasma (PRP)-PC and buffy coat reduced PC (BC-PC) prepared from whole blood (WB) donations and the apheresis platelets (AP-PC). Routinely evaluated in vitro PLT parameters were followed. Morphology score (MS) was performed using the light microscopy, glucose and lactate concentration and soluble P-selectin (sP-selectin) level were determined using commercial kits.
Results:
The fall in mean pH from day 0 to the last day of storage was significant (P < 0.001) in all the groups. Glucose utilization was less in PRP-PC prepared from WB donations at Blood Donation Centre [PRP-PC (BDC)] when compared to PRP-PC prepared from WB donations at mobile blood drives [PRP-PC (M)] and BC-PC. Lactate accumulation was almost similar in these groups on day 3 of storage, but it was significantly lower in the AP-PC (67.54 mg/dl) except on day 5. The deterioration in MS (out of 200) was similar for PRP-PC and BC-PC on day 3 (145/144 and 145 respectively), whereas the AP-PC had a score of 161 and 147 on days 4 and 5 respectively. sP-selectin level was significantly higher in PRP-PC (BDC) in comparison to BC-PC (P = 0.001) from day 1 to day 3 and in AP-PC it was not so high (P = 0.067) even on day 5. A negative correlation existed between the MS and sP-selectin level on all days of storage within each group of PC (r = −0.351; P < 0.001) and a positive correlation was found between the MS and pH from day 0 to day 3 (r = 0.680; P = 0.004).
Conclusion:
The AP-PCs are superior to the BC-PC and PRP-PC with respect to in vitro quality control parameters, morphological changes and biochemical markers of PLT activation. The PRP-PCs prepared from WB donations at outstation exhibiting more rapid changes should be utilized earlier for transfusion.
Keywords: Biochemical markers, morphology score, platelet concentrate, storage
Introduction
Platelet concentrates (PCs) are generally produced from whole blood (WB) by differential centrifugation by the platelet-rich plasma (PRP) method (PRP-PC) and the buffy coat (BC) method (BC-PC) or by a single donor plateletpheresis, i.e., Apheresis-PC (AP-PC) collected from voluntary thrombocytapheresis donor with the help of automated cell separator.[1] The PCs are stored in first or second-generation storage bags for up to 3-5 days at 22 ± 2°C under continuous gentle agitation.[2] The platelets (PLTs) undergo various changes starting from collection, processing to storage that are known to be detrimental to PLT function.[3] During storage, PLTs undergo morphological changes and release/express a variety of activation markers which indicate the quality of PCs — glycocalicin levels, P-selectin expression, soluble P-selectin (sP-selectin) level, β-thromboglobulin concentration, lactate and glucose concentration.[4] Thus, the platelet storage lesion includes a group of defects that affect a wide range of PLT structure and functions[1] — the cytoskeleton, surface membrane antigen and ligand integrity, metabolic activity, release of granule contents, discharge of cytosolic contents, morphology, recovery from osmotic stress and in vivo post-transfusion recovery and survival.
This study was designed to perform serial assessment of alterations in PLT count, morphology and biochemical markers of PLT activation in PRP-PCs, BC-PCs and AP-PCs on different days of storage and to correlate morphological changes with these activation markers with a view to optimize storage conditions and shelf life and make recommendations for the most suitable PLT preparations for clinical use.
Materials and Methods
In this study, following PLT products were prepared from WB: (i) PRP-PC from WB donation in mobile blood donation drives (PRP-PC [M]) and from WB donation at “Blood Donation Centre (BDC)” inside the institute premises (PRP-PC [BDC]), (ii) BC-PC from WB donation at “BDC” and (iii) single donor apheresis platelets (AP-PC). Their quality was assessed as per the standards by utilizing the following parameters — volume of the PC, swirling, PLT count, pH and the white blood cell (WBC) count.[2] In addition to this, morphological changes were assessed and biochemical markers of PLT activation on storage including the glucose and lactate concentration and sP-selectin levels were evaluated. This study was approved by the Ethics Committee of the institute.
Preparation of PCs
The study was conducted from January 2006 to December 2006. A total of 200 PCs were studied, which included 50 each PRP-PC (M), PRP-PC (BDC), BC-PC and AP-PCs. WB (450 ml) was collected in triple blood bag − the primary bag containing 63 ml of citrate phosphate dextrose adenine-1 (CPDA-1) anticoagulant preservative (Eastern Medikit Ltd., India), kept at room temperature (20-24°C) and PRP-PC was prepared within 6-8 h of collection. The WB was first separated into red cells and PRP by centrifugation for 11 min at 1750 rpm at 21°C using a Cryofuge 6000i (Heraeus, Kendro Laboratory, Germany). The supernatant PRP was expressed into one of the satellite bags intended for PLT storage. The PRP was centrifuged by “hard spin” at 3940 rpm for 5 min at 21°C. The platelet poor plasma (PPP) was expressed into the second satellite bag, leaving 40-70 ml of plasma along with PLT button and then the tubing was sealed. The PC bag was then left stationary at room temperature for approximately 1 h. The PPP was frozen promptly and stored as fresh frozen plasma. For BC-PC preparation, the WB was collected in 450-ml quadruple bags (top and top) (Terumo Penpol Ltd., India) containing 63 ml of CPD anticoagulant with 100 ml additive solution — Saline, Adenine, Glucose and Mannitol (SAGM). The WB was then subjected to “hard spin” at 3940 rpm for 5 min at 21°C. The PLT poor supernatant was expressed into one satellite bag and the buffy coat into another satellite bag. About 20-30 ml of plasma was returned to the buffy coat BC with the aim of cleaning the tubing from residual cells and obtaining an appropriate amount of plasma in the buffy coat BC. The SAGM solution was then added to the red cells and the bags containing red cells and plasma were removed. The buffy coat BC was gently mixed with the plasma and again subjected to “light spin” centrifugation at 1100 rpm for 6 min at 21°C along with one empty satellite bag. The supernatant PRP was expressed into empty PLT storage bag and the tubing was sealed. The bag with residual WBCs and red cells was discarded. AP-PCs were collected from healthy donors using a continuous flow, double venous access, automated blood cell separator (CS3000® plus, Baxter, Fenwal division, Deerfield, IL 60015, USA). Those donors who had PLT count >1.5 × 10⁵/μl, age between 18 and 50 years and body weight ≥55 kg were considered for plateletpheresis after taking their informed consent.
Storage of PCs
These PCs after preparation were stored in a flat-bed agitator (HELMER) at 22 ± 2°C under continuous gentle agitation. The PRP-PCs and BC-PCs were stored for 3 days, whereas the storage period for AP-PCs was 5 days.
Sampling of PCs
On each day of storage, 2 ml of sample from each PC was collected aseptically from the tube segments after adequate stripping. After pH measurement, PLT count, WBC count and morphological evaluation, the sample was centrifuged at 3000 rpm for 5 min and the PPP was stored in cryovials in a deep freezer (below −20°C).
Quality control parameters of PCs[2]
For PRP-PC and BC-PC quality checks were performed on storage days 0, 1, 2 and 3. For AP-PCs the tests were continued until day 5. The total volume of the PC was measured only on the day of preparation (day 0). Assessment of swirling, PLT count (per unit), WBC count (per unit) and pH measurement were carried out. Swirling was scored as present or absent only. PLT count (per unit) and WBC count (per unit) were done on automated counter (MS4-Melet Schloesing Laboratories, Switzerland). An estimation of pH of each PC was done using the pH indicator solution (Rankem, Ranbaxy Laboratories, India) by adding the PC sample in the ratio of 1:50 and matching the final color of the sample against the colored strip provided with the indicator solution, within a minute of mixing.
Glucose and lactate concentration
The plasma stored in cryovials in a deep freezer was first thawed at room temperature. Glucose concentration (mg/dl) was estimated by the “glucose oxidase-peroxidase method”[5] using commercial kits (Qualigens Diagnostics, Glaxo Smithkline Ltd., India). Lactate concentration (mg/dl) was measured by “enzymatic method” based on colorimeter (L-Lactate [PAP] — LC2389, RANDOX Laboratories, United Kingdom).
Morphology score (MS)
The PC sample was first diluted 1 in 20 by adding 50 μl of sample to 950 μl of lysing fluid (1% aqueous ammonium oxalate solution) and kept for 10-15 min at room temperature with intermittent mixing. Improved Neubauer counting chamber was charged with the diluted sample and kept for another 20 min in a moist petridish. PLT were focused under light microscope (40X objective) (Olympus Corporation, Tokyo, Japan) in five triple lined squares of the central square of the chamber. The PLTs were focused and counted in five fields of equal dimensions and the pictures were magnified and captured using the software “PC TV” (Microsoft, USA). The MS was done by modification of the original method of “Kunicki score”[6] based on the following changes in PLT structure and shape on storage:
PLTs with smooth contours — on two dimensional view under light microscopy discs and spheres could not be differentiated and were categorized in the same group;
dendrites — PLTs that have developed pseudopodia and/or dendritic processes; and long tubular forms — PLTs that have turned into elongated tubes;
balloons — PLTs that have undergone swelling after losing the capacity to maintain an osmotic gradient across their membrane; aggregates — these were clumps of multiple PLTs and could not be counted individually; fragments — these were minute forms pinched off from PLT membrane.
The percentage of discs and spherical forms (i.e., PLTs with smooth contours and normal size) was calculated in one group (a). The percentage of dendrites and long tubular forms was placed in the second group (b). The third group included the balloons, aggregates and the PLT fragments (c). The percentage of each group was multiplied by a series of arbitrary factors as follow: group (a) ×2, group (b) ×1 and group (c) ×0. The “MS” was obtained by the total of the three numbers thus derived and the maximum score possible was 200, indicating the best quality.
sP-selectin level
The plasma stored in the cryovials in deep freezer was first thawed at room temperature. The sP-selectin[7] level was determined by the quantitative sandwich immunoassay technique (R and D Systems, Inc., Minneapolis, USA.).
Statistical analysis
The parameters tested for PCs were expressed as mean ± standard deviation (SD) and range. For comparison of a parameter between different types of PCs “independent t-test” was applied. To assess the correlation between morphology and other biochemical markers of PLT activation Pearson correlation coefficient (r) was applied. A p-value < 0.05 was considered to indicate a statistically significant difference. All analyses were performed with the software Statistical Package for Social Sciences (SPSS 13.0) for Windows (SPSS Inc., Chicago, IL, USA).
Results
The results of the volume are summarized in Table 1. Swirling was present in all the PRP-PC and BC-PC units on days 0, 1 and 2 of storage. On day 3, it was present in 92%, 100% and 98% of PRP-PC (M), PRP-PC (BDC) and BC-PC units respectively. In AP-PCs, it was present in all the units from day 0 to day 5. The PLT count and WBC count per unit during storage is shown in Table 2. Within each group of PCs [Table 3] the fall in mean pH from day 0 to the last day of storage was significant (P < 0.001). On comparing PRP-PC (M) to PRP-PC (BDC) the difference in mean pH was significant only on day 1 (P = 0.001) − the PRP-PC (BDC) units had better pH, but by day 3 of storage the difference was minimal. When PRP-PC (BDC) was compared to BC-PC the difference of mean pH was significant on days 0 and 1 (P = 0.005), but not on days 2 and 3 (P > 0.05). Hence, on the last day of storage the pH was maintained at similar values for PRP-PC (M), PRP-PC (BDC) and BC-PCs. Although, the mean pH of AP-PCs was better than the PRP-PC (BDC) or BC-PC units (6.78 v/s 6.48 or 6.44) on day 3, but the difference was not significant on day 5 (P > 0.05). There was a progressive decrease in glucose on storage of all PCs, however, on the last day of storage glucose levels were best preserved in PRP-PC (BDC) units [Table 4]. The lactate concentration was significantly higher on day 1 in PRP-PC (M) when compared with PRP-PC (BDC), but subsequent rise was not significant. AP-PCs had significantly lower lactate levels [Table 4] than all other random donor PCs (P = 0.001). The mean MS decreased significantly in all the PCs during storage (P < 0.05) [Table 5 and Figures 1-4]. On intergroup comparison it was observed that until day 1 of storage the scores were similar in all the PCs. However, on days 2 and 3, the mean MS was significantly better in AP-PCs (P < 0.05). On day 4, the score of AP-PCs was better than the day 3 mean MSs of PRP-PC (M), PRP-PC (BDC) or BC-PCs. On day 5, it was similar to day 3 score of the PRP-PCs and BC-PCs. Each group of PCs had a rise in mean sP-selectin level [Table 5] during storage (P < 0.05). From day 0 to day 3, the level was higher in PRP-PC (BDC) when compared with BC-PCs (P =0.001). The mean sP-selectin level of AP-PCs even on day 5 was not significantly higher than that of PRP-PCs on day 3 (P = 0.067).
Table 1.
Volume of PCs

Table 2.
PLT and WBC count of PCs during storage*

Table 3.
pH changes in PCs during storage*

Table 4.
Metabolic characteristics of PCs during storage*

Table 5.
Morphology score* of PCs and s P-selectin concentration in PCs during storage**

Figure 1.
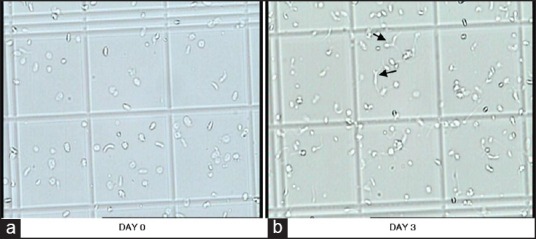
a and b are pictures of PRP-PC (M) showing progressive change in platelet morphology during storage. In picture-a, disc and spheres with smooth contours predominate, while in picture-b, many dendritic (arrows in the figure) and tubular forms as well as aggregates are seen
Figure 4.
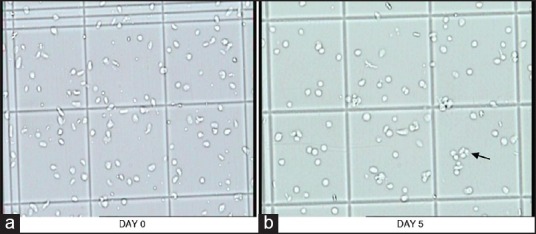
Changes in platelet morphology of AP-PC during storage. In picture-a, disc and spheres with smooth contours are seen, while in picture-b, occasional irregular forms and few aggregates are also seen
Figure 2.
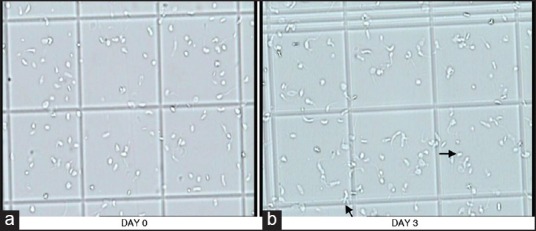
a and b are pictures of PRP-PC (BDC) showing progressive change in platelet morphology during storage. In picture-a, disc and spheres with smooth contours predominate, while in picture-b, many dendritic and tubular forms are also seen
Figure 3.
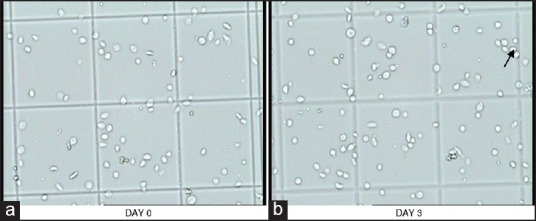
a and b are pictures of BC-PC showing progressive change in platelet morphology during storage. In picture-a, disc and spheres with smooth contours predominate and in picture-b, few aggregates are seen as well
Correlation between MS and sP-selectin level
Within each group of PCs it was observed that with the decline in MS there was an increase in sP-selection concentration [Table 6]. On statistical analysis, it was found that there was a negative correlation between these two parameters for PRP-PC (BDC) units (on days 1, 2 and 3), BC-PCs (on days 1, 2 and 3) and AP-PCs (on days 1, 3 and 5).
Table 6.
Correlation between morphology score and s P-selectin level during storage of PCs

Correlation between MS and pH
The MSs and pH on different days of storage for all types of PCs is shown in Figure 5. When all the PCs were taken together (n = 200) there was a positive correlation between MS and pH on days 0, 1, 2 and 3 of storage and was found to be significant (P = 0.004). On days 4 and 5 (for AP-PCs only) of storage, although a positive relationship existed between these two parameters, but was not found to be significant (P > 0.05).
Figure 5.
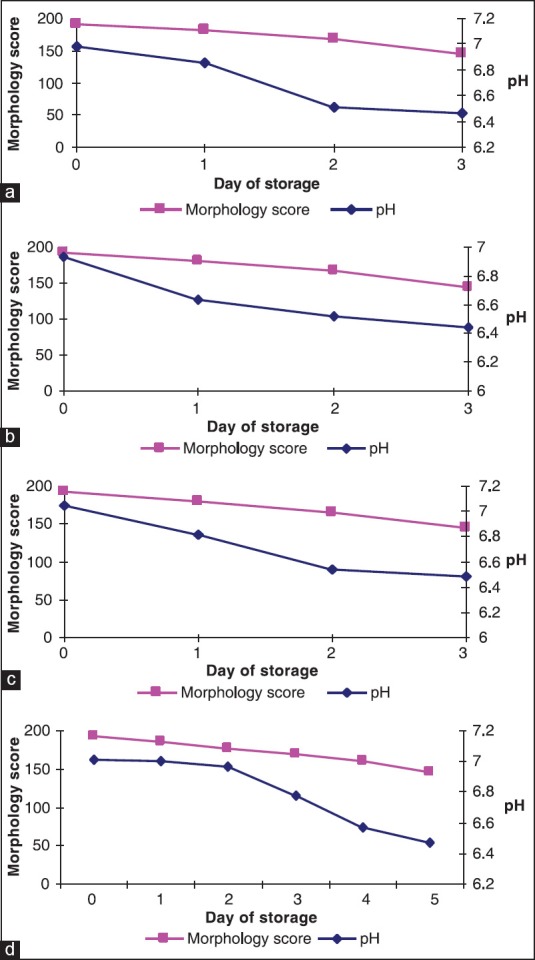
Changes in morphology score and variation of pH during storage: (a) PRP-PC (M), (b) PRP-PC (BDC), (c) BC-PC and (d) AP-PC
Correlation between glucose and lactate concentration
A negative linear correlation was observed in PRP-PC (M) and PRP-PC (BDC) units from day 0 to day 3, but was significant only on day 3 for PRP-PC (M) units, thus indicating a more rapid fall in glucose concentration in this group of PCs. Among the BC-PCs the negative correlation existed only on days 0 and 1, after which the rate of glucose utilization was not so rapid and there was not much lactate production on days 2 and 3. Among the AP-PCs, this correlation was found to be negative only on day 5 of storage, but was not significant (r = −0.100; P = 0.49).
Discussion
In the present study, the mean PLT count on the day of preparation was 5.96 ± 0.43 × 10¹⁰, 5.89 ± 0.28 × 10¹⁰, 7.10 ± 0.85 × 10¹⁰ and 3.91 ± 0.78 × 10¹¹ per unit for PRP-PC (M), PRP-PC (BDC), BC-PCs and AP-PCs respectively; and the estimated mean change (decrease) on the final day of storage was 3.7%, 3.7%, 3.1% and 5.6% respectively. Thus, the PLT count was generally stable over storage in each group of PCs. The AP-PCs had the least mean WBC contamination, followed by the BC-PCs and the PRP-PCs having the maximum count. The difference between these group of PCs was found to be significant (P < 0.05), but all the four groups of PCs fulfilled the quality control criteria permissible for WBC contamination as laid down by the Directorate General of Health Services, Government of India.[2] The higher WBC contamination in PRP-PCs can be due to extra handling or mishandling, which disturbs the red cell-PRP interface resulting in movement of the large number of WBCs into the PRP.[8] With storage, it was observed that there was a continuous fall in pH due to metabolism, but none of the PCs had pH <6.0 on the last day of storage and the mean pH on day 3 was 6.46 ± 0.14 and 6.44 ± 0.16 for PRP-PC (M) and PRP-PC (BDC) units respectively. In a comparative study of PLT preparations by Bertolini and Murphy[9] it was found that the mean pH of random BC-PCs on day 3 of storage was 6.55 and 6.70 at two different centers involved in the study. We observed that the AP-PCs had minimum rate of fall of mean pH per day among all types of PCs included in the study. Improved storage in second-generation and polyolefin containers results from increased permeability to oxygen. After 1 week of storage, pH will be no lower than 6.8 in these containers.[10] Dumont and Vanden Broeke[11] performed a study on 7-day storage of AP-PCs and found that the mean pH on day 5 was 6.98 ± 0.62.
Kilkson et al.[12] in their study have reported the lactate and glucose concentration of PCs measured serially during storage in polyolefin containers for 11 days. Lactate production and glucose consumption were linear with time and there was a very strong correlation (r = 0.923). In our study, within each group of PCs the fall in glucose concentration was accompanied by a parallel rise in lactate concentration with storage. The negative linear correlation was found to be significant only in PRP-PC (M) units on day 3 of storage. Among the BC-PCs, the fall in mean glucose concentration from day 0 to day 3 was 380.60 ± 10.16 mg/dl to 320.32 ± 9.58 mg/dl; and the rise in lactate concentration was from 21.46 ± 2.39 mg/dl to 71.33 ± 4.43 mg/dl. Böck et al.[13] reported a comparative study between PCs derived from buffy coat and apheresis technique, where the glucose concentration in BC-PCs dropped from 374.4 ± 9 mg/dl on day 0 to 352.8 ± 12.8 mg/dl on day 3 and the lactate concentration rose from 36.9 ± 5.4 mg/dl on day 0 to 65.7 ± 8.1 mg/dl on day 3. For AP-PCs, we observed that on day 3 the mean glucose concentration (287.08 ± 22.32 mg/dl) was less than that of BC-PCs (320.32 ± 9.58 mg/dl), but the comparative mean lactate concentration was higher in BC-PCs (71.33 ± 4.43 mg/dl) than the AP-PCs (67.54 ± 6.09 mg/dl). However, by day 5 the mean lactate accumulation in AP-PCs increased to 107.48 ± 8.33 mg/dl. Therefore, in our study, the lactate accumulation was lowest in AP-PCs (on day 3) and maximum in PRP-PCs (on day 3). In a study by Slichter et al.[14] the authors assessed the viability and function of 8-day-stored apheresis platelets. They observed that the in vivo post-transfusion recovery and survival of autologous AP-PCs meet the proposed standards for post-storage PLT quality. In spite of the vast amount of research conducted on PLT activation in vitro, there is no perfect correlation between in vitro function measures and in vivo efficacy. The surrogate test for PLT function and efficacy has remained recovery and survival of transfused PLTs in normal donors and thrombocytopenic patients.[15]
Previous studies have suggested that the morphological lesions of PLTs are associated with pH changes during storage at 22°C and this is associated with loss of viability.[16,17] In our study, we had employed a system of MS which was modification of the original Kunicki score.[6] The AP-PCs had superior mean MSs on days 2 and 3 of storage (P < 0.05) than either the PRP-PC (BDC) or BC-PC units. Although, AP-PCs on day 5 had slightly better mean MS than the scores of any other groups of PCs on day 3, however, it was not significant. Solberg et al.[18] studied the morphological changes associated with pH changes during storage of PCs in first-generation 3-day container. In these studies they used scanning electron microscope and transmission electron microscopy techniques to examine further the morphological characteristics of the PLT injury that occurs with falling pH. They concluded that in PCs with pH between 6.9 and 7.3, majority of the PLTs showed morphology similar to that of fresh PLTs with a discoid shape and few evaginations. In our study, among the PRP-PC (M), PRP-PC (BDC) and BC-PCs, the mean pH on day 3 was similar and so was the decrease in MS. The AP-PCs had a better maintenance of mean pH on day 3 than the PRP-PC or BC-PCs (i.e., 6.78 vs. 6.45 or 6.48) and also the mean MS (i.e., 169 vs. 144). It was only on day 5 of storage that the mean MS was 147, when the pH had fallen to 6.47. Hence, considering together all the PCs included in the study (=200 units), there was a positive correlation between MS and pH from day 0 to day 3 of storage. Utilizing the modified Kunicki score, the morphology could be assessed in wet PLT suspensions using Neubauer chamber and easily accessible software. The MS showed significant correlations with biochemical changes and sP-selectin levels. This can provide an alternate rapid method for assessment of PLT morphology in blood centre settings.
The amount of sP-selectin in plasma is a sensitive marker for PLT activation during storage of PCs. We found that there was negative correlation between sP-selectin and MS during storage of PCs. When all the PCs included in the study (=200 units) were taken together and also within each group of PCs, a decline in morphology went together with an increase in sP-selectin concentration (P < 0.05) throughout their storage. Hence, our study supports the earlier studies of strong correlation of known parameters of PLT activation with the sP-selectin concentration.[7] Furthermore, considering the sensitivity and easy handling of the ELISA involved in sP-selectin measurement makes the quantification of sP-selectin a useful tool for monitoring PLT activation.
Thus, the present study shows a serial comparison of biochemical markers of PLT activation in all the PLT preparations and provides inputs for optimum management of PLT inventory. In the Indian subcontinent the major source of PCs is from WB donation and is prepared by the PRP method. It was found that during earlier days of storage (days 0 and 1), there was more activation of PRP-PC (M) units than the PRP-PC (BDC) units. But, by day 3 of storage there was no significant difference in PLT activation between these two groups of PCs. In PRP technique, the intermediate PRP product is highly heterogenous and contains high levels of WBCs and red cells. Moreover, the high gravity force used in the second spin for “pelleting” PLTs on a plastic surface, activates PLTs and often leads to irreversible aggregates.[19,20] Hence, PRP-PCs prepared from WB donation at mobile blood donation drives should be utilized earlier for transfusion. In BC-PCs, early activation is prevented because the PLTs concentrated in the BC are sedimented on a cushion of red cells rather than the plastic bag.[1] We found that this group of PCs had significantly less WBC contamination than the PRP-PCs which prevents a rapid fall in pH during storage. Better maintenance of pH has a substantial influence on the MS of PLTs which deteriorates with a fall in pH and when the PLTs have maintained the MS during storage, this indicates lesser activation and hence comparatively lower level of activation marker like sP-selectin in the plasma. AP-PCs at our centre are generally prepared on demand and therefore transfused within 24-48 h of preparation.
Hence, we conclude that in resource constrained countries, where PCs are often prepared by different methods in the same blood centers, depending upon availability of blood bags and equipments, PRP-PCs should be issued first followed by the BC-PCs. In this way utilization would occur during the period of minimal biochemical and morphological alterations. AP-PCs are definitely superior to above PCs but are prepared on demand for specific patients; hence a ready inventory is still not possible. Also, the modified Kunicki score provides a readily adaptable method for assessment of PLT morphology.
Footnotes
Source of Support: Institutional
Conflicting Interest: None declared.
References
- 1.Seghatchian J, Krailadsiri P. The platelet storage lesion. Transfus Med Rev. 1997;11:130–44. doi: 10.1053/tm.1997.0110130. [DOI] [PubMed] [Google Scholar]
- 2.Saran RK, editor. 2nd ed. New Delhi, India: Directorate General of Health Services (DGHS), Ministry of Health and Family Welfare, Government of India; 2003. Transfusion Medicine – Technical Manual; p. 32. (353-4). [Google Scholar]
- 3.Perrota PL, Pisciotto PT, Snyder EL. Platelets and related products. In: Hillyer CD, Silberstein LE, Ness PM, Anderson KC, Roush KS, editors. Blood Banking and Transfusion Medicine-Basic Principles and Practice. Philadelphia, (PA): Churchill Livingstone; 2003. pp. 181–205. [Google Scholar]
- 4.Snyder EL, Pisciotto PT. Platelet storage and metabolism. In: Anderson KC, Ness PM, editors. Scientific Basis of Transfusion Medicine-Implications for Clinical Practice. 2nd ed. Philadelphia (PA): WB Saunders Company; 2000. pp. 207–25. [Google Scholar]
- 5.Sacks DB. Carbohydrates. In: Burtis CA, Ashwood ER, Aldrich JE, editors. Teitz Fundamentals of Clinical Chemistry. 4th ed. Philadelphia, (PA): W. B. Saunders Company; 1996. pp. 361–3. (366-7). [Google Scholar]
- 6.Kunicki TJ, Tuccelli M, Becker GA, Aster RH. A study of variables affecting the quality of platelets stored at “room temperature”. Transfusion. 1975;15:414–21. doi: 10.1046/j.1537-2995.1975.15576082215.x. [DOI] [PubMed] [Google Scholar]
- 7.Kostelijk EH, Fijnheer R, Nieuwenhuis HK, Gouwerok CW, de Korte D. Soluble P-selectin as parameter for platelet activation during storage. Thromb Haemost. 1996;76:1086–9. [PubMed] [Google Scholar]
- 8.Champion AB, Carmen RA. Factors affecting white cell content in platelet concentrates. Transfusion. 1985;25:334–8. doi: 10.1046/j.1537-2995.1985.25485273812.x. [DOI] [PubMed] [Google Scholar]
- 9.Bertolini F, Murphy S. A multicenter inspection of the swirling phenomenon in platelet concentrates prepared in routine practice. Biomedical excellence for safer transfusion (BEST) working party of the International society of blood transfusion. Transfusion. 1996;36:128–32. doi: 10.1046/j.1537-2995.1996.36296181924.x. [DOI] [PubMed] [Google Scholar]
- 10.Murphy S. Platelet storage for transfusion. Semin Hematol. 1985;22:165–77. [PubMed] [Google Scholar]
- 11.Dumont LJ, VandenBroeke T. Seven-day storage of apheresis platelets: Report of an in vitro study. Transfusion. 2003;43:143–50. doi: 10.1046/j.1537-2995.2003.00286.x. [DOI] [PubMed] [Google Scholar]
- 12.Kilkson H, Holme S, Murphy S. Platelet metabolism during storage of platelet concentrates at 22 degrees C. Blood. 1984;64:406–14. [PubMed] [Google Scholar]
- 13.Böck M, Rahrig S, Kunz D, Lutze G, Heim MU. Platelet concentrates derived from buffy coat and apheresis: Biochemical and functional differences. Transfus Med. 2002;12:317–24. doi: 10.1046/j.1365-3148.2002.00392.x. [DOI] [PubMed] [Google Scholar]
- 14.Slichter SJ, Bolgiano D, Jones MK, Christoffel T, Corson J, Rose L, et al. Viability and function of 8-day-stored apheresis platelets. Transfusion. 2006;46:1763–9. doi: 10.1111/j.1537-2995.2006.00970.x. [DOI] [PubMed] [Google Scholar]
- 15.Moroff G, Simon TL. Use of radioisotopically-labeled platelets to determine the survival properties of stored platelets. An overview of the present status. Transfusion. 1986;26:1–6. doi: 10.1046/j.1537-2995.1986.26186124009.x. [DOI] [PubMed] [Google Scholar]
- 16.Murphy S, Gardner FH. Platelet storage at 22 degrees C: Role of gas transport across plastic containers in maintenance of viability. Blood. 1975;46:209–18. [PubMed] [Google Scholar]
- 17.Murphy S, Sayar SN, Gardner FH. Storage of platelet concentrates at 22 degrees C. Blood. 1970;35:549–57. [PubMed] [Google Scholar]
- 18.Solberg C, Holme S, Little C. Morphological changes associated with pH changes during storage of platelet concentrates in first-generation 3-day container. Vox Sang. 1986;50:71–7. doi: 10.1111/j.1423-0410.1986.tb04849.x. [DOI] [PubMed] [Google Scholar]
- 19.Seghatchian MJ. EDTA reveals the aggregation state and functional integrity of platelets. Platelets. 1994;5:219. doi: 10.3109/09537109409006050. [DOI] [PubMed] [Google Scholar]
- 20.Fijnheer R, Pietersz RN, de Korte D, Gouwerok CW, Dekker WJ, Reesink HW, et al. Platelet activation during preparation of platelet concentrates: A comparison of the platelet-rich plasma and the buffy coat methods. Transfusion. 1990;30:634–8. doi: 10.1046/j.1537-2995.1990.30790385523.x. [DOI] [PubMed] [Google Scholar]


