

Abstract
Functional magnetic resonance imaging was used during emotion recognition to identify changes in functional brain activation in 21 first-episode, treatment-naive major depressive disorder patients before and after antidepressant treatment. Following escitalopram oxalate treatment, patients exhibited decreased activation in bilateral precentral gyrus, bilateral middle frontal gyrus, left middle temporal gyrus, bilateral postcentral gyrus, left cingulate and right parahippocampal gyrus, and increased activation in right superior frontal gyrus, bilateral superior parietal lobule and left occipital gyrus during sad facial expression recognition. After antidepressant treatment, patients also exhibited decreased activation in the bilateral middle frontal gyrus, bilateral cingulate and right parahippocampal gyrus, and increased activation in the right inferior frontal gyrus, left fusiform gyrus and right precuneus during happy facial expression recognition. Our experimental findings indicate that the limbic-cortical network might be a key target region for antidepressant treatment in major depressive disorder.
Keywords: major depressive disorder, functional magnetic resonance imaging, facial expression recognition, antidepressant, neural regeneration
Abbreviations
MDD, major depressive disorder; fMRI, functional magnetic resonance imaging; HDRS, Hamilton Depression Rating Scale; HARS, Hamilton Anxiety Rating Scale
INTRODUCTION
Although major depressive disorder (MDD) has been examined by a large number of studies in genetics, biochemistry and neuroendocrinology, its causes and pathogenesis and effective treatments remain unclear.
Brain imaging techniques, particularly functional magnetic resonance imaging (fMRI), enable the identification of functional abnormalities associated with MDD in brain regions that participate in emotional processing and regulation, and have greatly advanced our understanding of the neuropathophysiology of MDD[1,2,3]. Recent neuroimaging investigations have consistently implicated limbic-cortical network abnormalities in the neuropathophysiology of MDD. For example, abnormal neural activity in MDD has been consistently postulated in these studies, with predominantly increased activation of limbic regions such as the amygdala[4], but decreased neural activation of cortical brain areas such as the dorsolateral prefrontal cortex[4,5] and anterior cingulate cortex[6,7]. However, the results are not consistent. Increasing evidence suggests that the effects of antidepressant medications might be associated with the inconsistency between studies. Changes of abnormalities in brain activity before and after treatments associated with improving symptoms were found to be involved in the neuropathophysiology of MDD[8,9,10,11,12]. Investigating functional brain changes in patients with MDD who respond well to antidepressants before and after treatment using the same antidepressants is important for elucidating the core neuropathophysiology of this illness.
fMRI has been well used to investigate regional neural activity during facial expression recognition in MDD patients[13,14,15]. Negative cognitive schemas have been identified as a common factor in MDD: Intentionally or unintentionally, MDD individuals are more inclined to focus on sadness, anger and other negative emotions rather than happy, positive emotions, when processing external stimuli. An attentional bias for sad facial expressions might lead to life events being interpreted as more negative by MDD patients[16]. However, to the best of our knowledge, no fMRI study of the relationship between functional brain activity changes during an emotional recognition task and treatment outcome of antidepressants (with which negative cognitive schemas of MDD are strongly associated) has been previously reported.
To address these questions, in this event-related fMRI study, emotional faces from the emotion recognition testing system designed by University of Pennsylvania (USA) were used as the emotional recognition stimuli to were used to explore the effects of antidepressant treatment on functional brain activation during emotional processing in treatment-response MDD patients. MDD patients were selected by recruiting first-episode, treatment-naïve, antidepressant-consistent, treatment-response patients. We hypothesized that, compared with pre-treatment, a significant decrease in activation during the recognition of sad facial expression would be observed after treatment in brain regions associated with the limbic-cortical network.
RESULTS
Quantitative analysis of subjects
A total of 21 first-episode, treatment-naive MDD patients were recruited from outpatients at the Department of Psychiatry, the First Affiliated Hospital of China Medical University, China, from July 2007 to October 2010. After 8-12 weeks of treatment with escitalopram oxalate, all 21 subjects met the criteria for response (greater than or equal to 50% improvement on the Hamilton Depression Rating Scale (HDRS) from baseline to week 8-12), and were included in the final analysis.
General data analysis
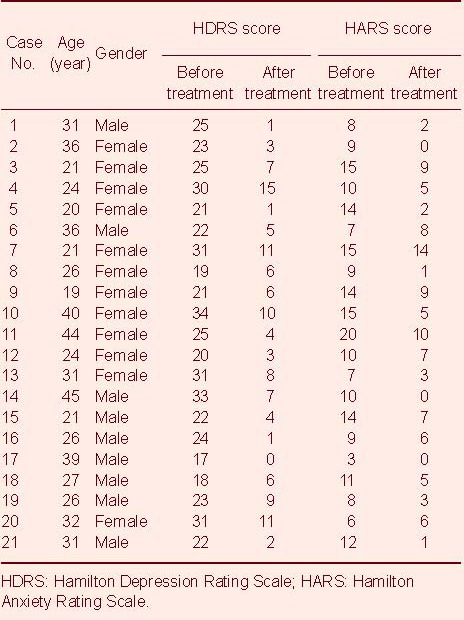
Demographic and clinical descriptions from the 21 participants are shown in Table 1. Both the HDRS; 5.7 ± 4.0, vs. 24.6 ± 5.1) and Hamilton Anxiety Rating Scale (HARS; 4.9 ± 3.8, vs. 10.8 ± 3.9) scores decreased significantly after treatment, compared with the same group before treatment (P < 0.001).
Table 1.
Baseline data of subjects
Comparison of brain activation regions during sad facial expression recognition in MDD patients before and after treatment
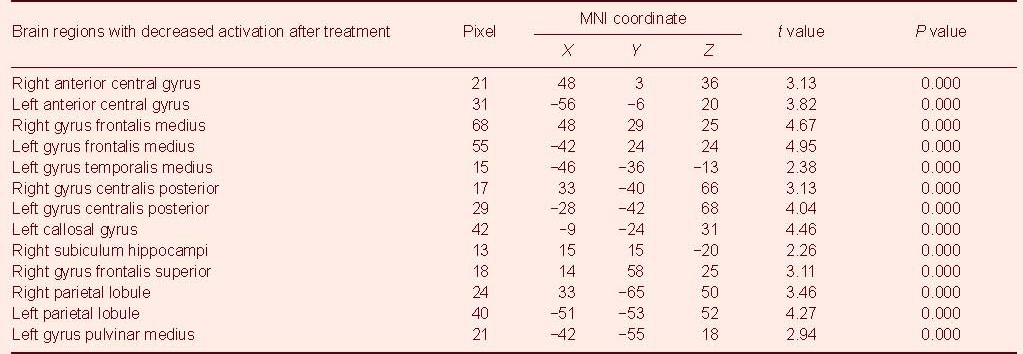
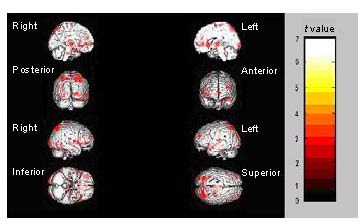
Significantly reduced activation during sad facial emotion recognition was observed in a number brain regions after treatment (Figure 1), including the bilateral anterior central gyrus within the frontal lobe, the bilateral gyrus frontalis medius, the left gyrus temporalis medius, the bilateral gyrus centralis posterior within the apical lobe, the left callosal gyrus and the right subiculum hippocampi. Accordingly, activation in the bilateral parietal lobule and the left gyrus pulvinar medius was significantly increased during the recognition of sad facial expressions after treatment (Figures 1, 2; Table 2).
Figure 1.
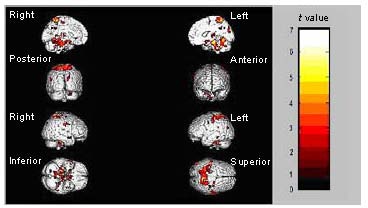
Regions showing significantly decreased activation during sad facial emotion recognition after treatment.
The median sagittal, coronal, sagittal and axial views of the brain are shown. The color bar represents the range of t values.
Figure 2.
Regions showing significantly increased activation during sad facial emotion recognition after treatment.
The median sagittal, coronal, sagittal and axial views of the brain are shown. The color bar represents the range of t values.
Table 2.
Comparison of brain activations in sad facial emotion recognition before and after treatment (compared with prior treatment, uncorrected)
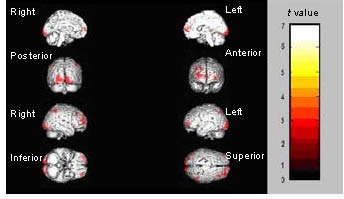
Comparison of regional brain activation during happy facial expression recognition in MDD patients before and after treatment
We observed significantly reduced activation during happy facial expression recognition in the following brain regions (Figure 3).
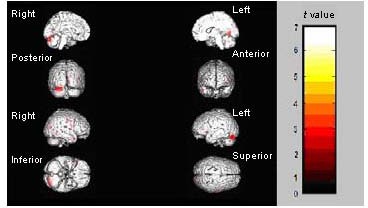
Figure 3.
Regions showing decreased brain activation during happy facial expression recognition after treatment.
Median sagittal, coronal, sagittal and axial views of the brain are shown. The color bar represents the range of t values.
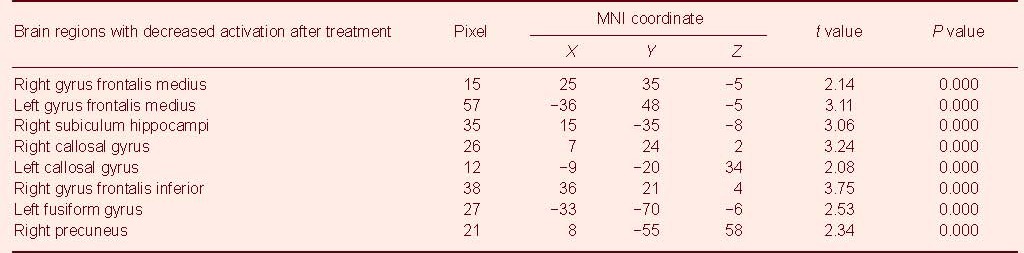
The bilateral gyrus frontalis medius, the bilateral callosal gyrus and the right subiculum hippocampi. Accordingly, the significantly increased activation during the recognition of happy facial expressions was observed in the following brain regions (Figure 4). The right gyrus frontalis inferior, the left fusiform gyrus within the occipital lobe and the right precuneus (Table 3).
Figure 4.
Regions showing increased activation during happy facial expression recognition after treatment.
Median sagittal, coronal, sagittal and axial views of the brain are shown. The color bar represents the range of t values.
Table 3.
Comparison of brain activations in happy facial emotion recognition before and after treatment (compared with prior treatment, uncorrected)
DISCUSSION
To our knowledge, this is the first study using emotional faces from the emotional recognition testing system designed by University of Pennsylvania (USA) as facial expression recognition stimuli to test the effects of antidepressant treatment on functional activity in the Chinese population. The MDD participants in this study were all first-episode patients and had no history of psychotropic medication. Both HDRS and HARS scores decreased significantly after treatment compared with before treatment, indicating that medical treatment for 8-12 weeks was effective for treating MDD.
The brain regions observed to exhibit significantly reduced activation during sad facial expression recognition in MDD patients after medical treatment were mainly in the frontal lobe, temporal lobe, callosal gyrus, hippocampus and amygdala. Interestingly, previous studies reported that these areas exhibited enhanced activation in MDD patients compared to healthy controls during the processing of negative stimuli[17,18,19,20]. Our results are consistent with previous reports focusing on MDD brain function before or after treatment using negative stimuli[8,13,21]. In addition, we found that abnormal neural activity in these brain regions exists in treatment-response MDD patients. However, because we did not include morphological analyses in the current study, it remains unclear whether the decreased activation in these brain regions was caused by a gray matter volume reduction in MDD[22,23,24,25,26] or increased volumes in remitting patients[27,28,29]. Impaired neural activity may partially underlie the emotional and cognitive symptoms seen in MDD patients, possibly constituting an important pathological mechanism of MDD episodes[30,31]. Our results demonstrated that antidepressants were effective in the treatment of MDD by inhibiting over-activity in the neural circuitry of the cortical-limbic system in the cognitive processing of sad emotional content. The present study extends current knowledge on the dysregulation model of the limbic-cortical network in treatment-response MDD patients.
Our data on positive emotional stimuli suggested that MDD patients showed significantly decreased activation during happy facial emotion recognition after treatment in the middle frontal gyrus, cingulate gyrus and parahippocampal gyrus. The results were inconsistent with previous reports by Martin et al[32], who reported no significant changes in activation to positive emotional stimuli in comparisons between prior treatment and post treatment. However, another study reported increased activations during happy facial emotion recognition in the cingulate gyrus and parahippocampal gyrus[33], consistent with the current findings. This discrepancy may be due to differences in sample size, clinical characteristics and the types of medication involved. A large number of confounding factors were excluded by only including first-episode, treatment-naïve, antidepressant-consistent and treatment-response participants.
In addition, we found that MDD patients exhibited increased activation in the frontal lobe, apical lobe and lobus occipitalis during happy or sad facial emotion recognition after treatment, compared with before treatment. This may have resulted from the different roles of neural subregions. Previous studies reported that MDD patients demonstrated increased activation while observing sad expressions, but no activation while observing happy expressions in the right fusiform gyrus, whereas healthy subjects exhibited increased activation in response to happy expressions in the bilateral fusiform gyrus[34,35]. The current results revealed increased activation in the left fusiform gyrus in MDD patients after treatment. Taken together with previous studies, this finding suggests the participation of the right fusiform gyrus in negative cognitive schemas[36], and the left fusiform gyrus in positive cognitive schemas. Considering these brain regions exhibited increased activation during facial expression recognition after treatment, the increased activation may be correlated with restoration and attention in remitted MDD. However, these findings require verification in future studies.
Because the present study did not include a healthy control group, we cannot rule out the potential effects of co-intervention of medication side effects. Thus, the current findings encourage replication and emphasize the need for larger scale prospective fMRI studies to determine whether abnormalities should be considered trait or state markers in MDD patients. Moreover, further studies with larger sample sizes and stricter significance thresholds could confirm and extend these findings.
SUBJECTS AND METHODS
Design
A self-controlled neuroimaging study.
Time and setting
Experiments were performed at the First Affiliated Hospital of China Medical University, China in October 2010.
Subjects
A total of 21 MDD participants (12 women, 9 men; aged 18-45 years) meeting the Diagnostic and Statistical Manual of Mental Disorders-IV (DSM-IV) criteria for MDD according to the Structured Clinical Interview for DSM-IV Axis I Disorders[37], diagnosed by two trained psychiatrists, were recruited from outpatients at Department of Psychiatry, the First Affiliated Hospital, China Medical University, China.
Inclusion criteria
A unipolar depressive episode; treatment-naive; right- handed; a score of at least 17 on the 17-item HDRS[38].
Exclusion criteria
MRI contraindications; current comorbid Axis I or II disorder; history of head injury, neurological disorder, psychotropic medication, electroconvulsive therapy or psychotherapy.
All participants took part voluntarily, and provided written informed consent after a full description of the objectives, methods and reasons of the study, and the potential risks. The project was approved by the Institutional Review Board of the China Medical University.
Methods
Treatment
Once patients were assessed on the HDRS and HARS[39] scales following initial contact and diagnosis, the first fMRI scans were taken individually within 48 hours of initial contact. All patients then received antidepressant treatment with escitalopram oxalate (10 mg, trade name: Lexapro, imported drug registration No. H20050457; H. Lundbeck A/S, Ottiliavej 9 DK-2500 Valby-Copenhagen, Denmark) for 8-12 weeks. With a therapeutic dose of 10-20 mg per day, the dosage of administration was designed in an open-label manner, based on the clinical symptoms of the individual. No other antidepressants or antianxiety drugs were given during treatment. Response was defined as an HRSD-17 reduction of ≥50%, and fMRI scans were taken after the medicine treatments.
Brain functional image processing and fMRI acquisition
All fMRI scans were performed using a GE 1.5T MR scanner (General Elecric, Milwaukee, WI, USA) at the Outpatient MRI Room of the First Affiliated Hospital of China Medical University. Restraining foam pads and standard head coils were used to minimize the head motion and receive or transmit the nuclear magnetic resonance signal, respectively. The fMRI data were acquired with a gradient-recalled echo planar imaging sequence aligned with the anterior commissure-posterior commissure plane. The scan parameters were as follows: repetition time = 2 000 ms; echo time = 40 ms; image matrix = 64 × 64; field of view = 24 cm × 24 cm; slice thickness = 3 mm; slice interval = 3 mm; contiguous slices = 35; every phase = 2 s; 113 phases.
Emotional testing design
Emotional faces from the emotion recognition testing system designed by the University of Pennsylvania were used as stimuli[40]. Ten emotional faces expressing happiness and sadness (half male and half female) were selected for emotional face recognition stimuli. A block design was utilized for the test design, including a happy face block, sad face block and neutral block. The happy expression stimuli were happy emoticons (photographs of real human faces) of 10 different individuals, and the sad expression stimuli were sad emoticons of 10 different individuals. Pictures in the blocks were presented in a randomized sequence. The control stimuli were 10 black crosses in the center of the screen image. Each picture was presented for 2 seconds on a computer screen. The first 6 seconds of the scan was the pre-scan period, followed by three blocks of happy facial stimuli, three blocks of sad facial stimuli and five control blocks (Figure 5).
Figure 5.
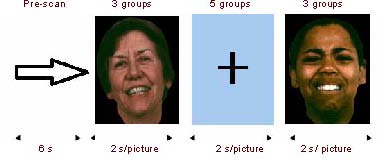
Facial stimuli used in event-related functional magnetic resonance imaging paradigm.
Following the Eprime procedure, emotional and cognitive testing was corrected for consistency at the time of the fMRI scan. The stimuli were presented automatically by a computer projecting onto a screen in front of the subject. The scanning procedure required that all subjects were watching the screen. As such, subjects were instructed to press the left or right buttons on the mouse to indicate whether a happy or sad expression was seen, and to not press any button when control stimuli were presented. Different incentives were generated by varying the rate of access to the test button on the right at the end of the experiment.
fMRI data processing
Images were processed and analyzed with SPM5, using software based on Matlab 7.3.0 software (MathWorks Inc., Natick, Massachusetts, USA). First, slice timing was performed to correct the differences in acquisition time for each image. Second, corrected images were realigned. Third, the resulting images were subjected to three-dimensional normalization. The normalized images were then smoothed. Following the four pretreatment steps, the images were utilized as follows: (1) Average activation signals for each participant during happy and sad facial recognition were evaluated, respectively. (2) Single sample t-tests were used to evaluate each group of participants to obtain the average activation signal strength.
Statistical analysis
Paired-sample t tests were used to compare the clinical information of patients before and after treatment with SPSS 13.0 software (SPSS, Chicago, IL, USA). Paired-sample t-tests were performed in a voxel-by-voxel manner with SPM5 between the two groups, based on the difference between averaged brain activation signals measured during happy and sad facial emotion recognition, before and after treatment. The findings (voxels in the whole-brain showing significant differences) were considered statistically significant at a height threshold of P < 0.001, and an extension threshold of 10 voxels.
Acknowledgments
We would like to thank Huan Ma for helping to recruit participants with major depressive disorder, and Xixun Qi for assistance in diffusion tensor imaging scanning. Both of these researchers also work in the First Affiliated Hospital, China Medical University.
Footnotes
Funding: The study was supported by research grants from the National Natural Science Foundation of China (No. 81071099), the Liaoning Science and Technology Foundation (No. 2008225010-14), and Doctoral Foundation of the First Affiliated Hospital in China Medical University (No. 2010).
Conflicts of interest: None declared.
Ethical approval: The study was approved by the Institutional Review Board of the China Medical University. The participants provided written informed consent after detailed description of the study.
(Edited by Wang F, Wang XL/Yang Y/Song LP)
REFERENCES
- 1.Taki Y, Kinomura S, Awata S, et al. Male elderly subthreshold depression patients have smaller volume of medial part of prefrontal cortex and precentral gyrus compared with age-matched normal subjects: a voxel-based morphometry. J Affect Disord. 2005;88(3):313–320. doi: 10.1016/j.jad.2005.08.003. [DOI] [PubMed] [Google Scholar]
- 2.Siegle GJ, Thompson W, Carter CS, et al. Increased amygdala and decreased dorsolateral prefrontal BOLD responses in unipolar depression: related and independent features. Biol Psychiatry. 2007;61(2):198–209. doi: 10.1016/j.biopsych.2006.05.048. [DOI] [PubMed] [Google Scholar]
- 3.Salvadore G, Cornwell BR, Colon-Rosario V, et al. Increased anterior cingulate cortical activity in response to fearful faces: a neurophysiological biomarker that predicts rapid antidepressant response to ketamine. Biol Psychiatry. 2009;65(4):289–295. doi: 10.1016/j.biopsych.2008.08.014. [DOI] [PMC free article] [PubMed] [Google Scholar]
- 4.Zhong M, Wang X, Xiao J, et al. Amygdala hyperactivation and prefrontal hypoactivation in subjects with cognitive vulnerability to depression. Biol Psychol. 2011;88(2-3):233–242. doi: 10.1016/j.biopsycho.2011.08.007. [DOI] [PubMed] [Google Scholar]
- 5.Guo WB, Liu F, Xue ZM, et al. Abnormal neural activities in first-episode, treatment-naïve, short-illness-duration, and treatment-response patients with major depressive disorder: a resting-state fMRI study. J Affect Disord. 2011;135(1-3):326–331. doi: 10.1016/j.jad.2011.06.048. [DOI] [PubMed] [Google Scholar]
- 6.Horn DI, Yu C, Steiner J, et al. Glutamatergic and resting-state functional connectivity correlates of severity in major depression-the role of pregenual anterior cingulate cortex and anterior insula. Front Syst Neurosci. 2010;4:33. doi: 10.3389/fnsys.2010.00033. [DOI] [PMC free article] [PubMed] [Google Scholar]
- 7.Drevets WC, Savitz J, Trimble M. The subgenual anterior cingulate cortex in mood disorders. CNS Spectr. 2008;13(8):663–681. doi: 10.1017/s1092852900013754. [DOI] [PMC free article] [PubMed] [Google Scholar]
- 8.Fu CH, Williams SC, Cleare AJ, et al. Attenuation of the neural response to sad faces in major depression by antidepressant treatment: a prospective, event-related functional magnetic resonance imaging study. Arch Gen Psychiatry. 2004;61(9):877–889. doi: 10.1001/archpsyc.61.9.877. [DOI] [PubMed] [Google Scholar]
- 9.Mayberg HS, Brannan SK, Tekell JL, et al. Regional metabolic effects of fluoxetine in major depression: serial changes and relationship to clinical response. Biol Psychiatry. 2000;48(8):830–843. doi: 10.1016/s0006-3223(00)01036-2. [DOI] [PubMed] [Google Scholar]
- 10.Martin SD, Martin E, Rai SS, et al. Brain blood flow changes in depressed patients treated with interpersonal psychotherapy or venlafaxine hydrochloride: preliminary findings. Arch Gen Psychiatry. 2001;58(7):641–648. doi: 10.1001/archpsyc.58.7.641. [DOI] [PubMed] [Google Scholar]
- 11.Kozel FA, Rao U, Lu H, et al. Functional connectivity of brain structures correlates with treatment outcome in major depressive disorder. Front Psychiatry. 2011;2:7. doi: 10.3389/fpsyt.2011.00007. [DOI] [PMC free article] [PubMed] [Google Scholar]
- 12.Korb AS, Hunter AM, Cook IA, et al. Rostral anterior cingulate cortex activity and early symptom improvement during treatment for major depressive disorder. Psychiatry Res. 2011;192(3):188–194. doi: 10.1016/j.pscychresns.2010.12.007. [DOI] [PMC free article] [PubMed] [Google Scholar]
- 13.Fales CL, Barch DM, Rundle MM, et al. Antidepressant treatment normalizes hypoactivity in dorsolateral prefrontal cortex during emotional interference processing in major depression. J Affect Disord. 2009;112(1-3):206–211. doi: 10.1016/j.jad.2008.04.027. [DOI] [PMC free article] [PubMed] [Google Scholar]
- 14.Surguladze S, Brammer MJ, Keedwell P, et al. A differential pattern of neural response toward sad versus happy facial expressions in major depressive disorder. Biol Psychiatry. 2005;57(3):201–209. doi: 10.1016/j.biopsych.2004.10.028. [DOI] [PubMed] [Google Scholar]
- 15.Lisiecka D, Meisenzahl E, Scheuerecker J, et al. Neural correlates of treatment outcome in major depression. Int J Neuropsychopharmacol. 2011;14(4):521–534. doi: 10.1017/S1461145710001513. [DOI] [PubMed] [Google Scholar]
- 16.Murphy FC, Sahakian BJ, Rubinsztein JS, et al. Emotional bias and inhibitory control processes in mania and depression. Psychol Med. 1999;29(6):1307–1321. doi: 10.1017/s0033291799001233. [DOI] [PubMed] [Google Scholar]
- 17.Fales CL, Barch DM, Rundle MM, et al. Altered emotional interference processing in affective and cognitive-control brain circuitry in major depression. Biol Psychiatry. 2008;63(4):377–384. doi: 10.1016/j.biopsych.2007.06.012. [DOI] [PMC free article] [PubMed] [Google Scholar]
- 18.Langenecker SA, Kennedy SE, Guidotti LM, et al. Frontal and limbic activation during inhibitory control predicts treatment response in major depressive disorder. Biol Psychiatry. 2007;62(11):1272–1280. doi: 10.1016/j.biopsych.2007.02.019. [DOI] [PMC free article] [PubMed] [Google Scholar]
- 19.Victor TA, Furey ML, Fromm SJ, et al. Relationship between amygdala responses to masked faces and mood state and treatment in major depressive disorder. Arch Gen Psychiatry. 2010;67(11):1128–1138. doi: 10.1001/archgenpsychiatry.2010.144. [DOI] [PMC free article] [PubMed] [Google Scholar]
- 20.Townsend JD, Eberhart NK, Bookheimer SY, et al. fMRI activation in the amygdala and the orbitofrontal cortex in unmedicated subjects with major depressive disorder. Psychiatry Res. 2010;183(3):209–217. doi: 10.1016/j.pscychresns.2010.06.001. [DOI] [PMC free article] [PubMed] [Google Scholar]
- 21.Keedwell PA, Steven CA, Williams CR. A double dissociation of ventromedial prefrontal cortical responses to sad and happy stimuli in depressed and healthy individuals. Biol Psychiatry. 2005;58:495–503. doi: 10.1016/j.biopsych.2005.04.035. [DOI] [PubMed] [Google Scholar]
- 22.Lorenzettia V, Allenb NB, Fornitoa A, et al. Structural brain abnormalities in major depressive disorder: A selective review of recent MRI studies. J Affect Disord. 2009;117(1-2):1–17. doi: 10.1016/j.jad.2008.11.021. [DOI] [PubMed] [Google Scholar]
- 23.Takahashia T, Yücela M, Lorenzettia V, et al. An MRI study of the superior temporal subregions in patients with current and past major depression. Prog Neuropsychopharmacol Biol Psychiatry. 2010;34(1):98–103. doi: 10.1016/j.pnpbp.2009.10.005. [DOI] [PubMed] [Google Scholar]
- 24.Peng J, Liu J, Nie B, et al. Cerebral and cerebellar gray matter reduction in first-episode patients with major depressive disorder: a voxel-based morphometry study. Eur J Radiol. 2011;80(2):395–399. doi: 10.1016/j.ejrad.2010.04.006. [DOI] [PubMed] [Google Scholar]
- 25.Malykhin NV, Carter R, Seres P, et al. Structural changes in the hippocampus in major depressive disorder: contributions of disease and treatment. J Psychiatry Neurosci. 2010;35(5):337–343. doi: 10.1503/jpn.100002. [DOI] [PMC free article] [PubMed] [Google Scholar]
- 26.Lee HY, Tae WS, Yoon HK, et al. Demonstration of decreased gray matter concentration in the midbrain encompassing the dorsal raphe nucleus and the limbic subcortical regions in major depressive disorder: An optimized voxel-based morphometry study. J Affect Disord. 2011;133(1-2):128–136. doi: 10.1016/j.jad.2011.04.006. [DOI] [PubMed] [Google Scholar]
- 27.Yucela K, McKinnona M, Chahala R, et al. Increased subgenual prefrontal cortex size in remitted patients with major depressive disorder. Psychiatry Res. 2009;173(1):71–76. doi: 10.1016/j.pscychresns.2008.07.013. [DOI] [PubMed] [Google Scholar]
- 28.Lorenzetti V, Allen NB, Whittle S, et al. Amygdala volumes in a sample of current depressed and remitted depressed patients and healthy controls. J Affect Disord. 2010;120(1-3):112–119. doi: 10.1016/j.jad.2009.04.021. [DOI] [PubMed] [Google Scholar]
- 29.Salvadorea G, Nugenta AC, Lemaitreb H, et al. Prefrontal cortical abnormalities in currently depressed versus currently remitted patients with major depressive disorder. Neuroimage. 2011;54(4):2643–2651. doi: 10.1016/j.neuroimage.2010.11.011. [DOI] [PMC free article] [PubMed] [Google Scholar]
- 30.Schlosser RG, Wagner G, Koch K, et al. Fronto-cingulate effective connectivity in major depression: a study with fMRI and dynamic causal modeling. Neuroimage. 2008;43(3):645–655. doi: 10.1016/j.neuroimage.2008.08.002. [DOI] [PubMed] [Google Scholar]
- 31.Lia CT, Linb CP, Choue KH, et al. Structural and cognitive deficits in remitting and non-remitting recurrent depression: A voxel-based morphometric study. Neuroimage. 2010;50(1):347–356. doi: 10.1016/j.neuroimage.2009.11.021. [DOI] [PubMed] [Google Scholar]
- 32.Martin SD, Martin E, Rai SS, et al. Brain blood flow changes in depressed patients treated with interpersonal psychotherapy or venlafaxine hydrochloride: preliminary findings. Arch Gen Psychiatry. 2001;58(7):641–648. doi: 10.1001/archpsyc.58.7.641. [DOI] [PubMed] [Google Scholar]
- 33.Williams LM, Brown KJ, Das P, et al. The dynamics of cortico-amygdala and autonomic activity over the experimental time course of fear perception. Brain Res Cogn Brain Res. 2004;21(1):114–123. doi: 10.1016/j.cogbrainres.2004.06.005. [DOI] [PubMed] [Google Scholar]
- 34.Kanwisher N, McDermott J, Chun MM. The fusiform face area: a module in human extrastriate cortex specialized for face perception. J Neurosci. 1997;17(11):4302–4311. doi: 10.1523/JNEUROSCI.17-11-04302.1997. [DOI] [PMC free article] [PubMed] [Google Scholar]
- 35.Surguladze S, Brammer MJ, Keedwell P, et al. A differential pattern of neural response toward sad versus happy facial expressions in major depressive disorder. Biol Psychiatry. 2005;57(3):201–209. doi: 10.1016/j.biopsych.2004.10.028. [DOI] [PubMed] [Google Scholar]
- 36.Yao Z, Wang L, Lu Q, et al. Regional homogeneity in depression and its relationship with separate depressive symptom clusters: a resting-state fMRI study. J Affect Disord. 2009;115(3):430–438. doi: 10.1016/j.jad.2008.10.013. [DOI] [PubMed] [Google Scholar]
- 37.First MB, Spitzer RL, Gibbon M, et al. New York: New York State Psychiatric Institute; 1996. Structured Clinical Interview for DSM-IV Axis I and II Disorders(version 2.0) [Google Scholar]
- 38.Hamilton M. Development of a rating scale for primary depressive illness. Br J Soc Clin Psychol. 1967;6(4):278–296. doi: 10.1111/j.2044-8260.1967.tb00530.x. [DOI] [PubMed] [Google Scholar]
- 39.Hamilton M. The assessment of anxiety states by rating. Br J Med Psychol. 1959;32(1):50–55. doi: 10.1111/j.2044-8341.1959.tb00467.x. [DOI] [PubMed] [Google Scholar]
- 40.Satterthwaite TD, Wolf DH, Gur RC, et al. Frontolimbic responses to emotional face memory: the neural correlates of first impressions. Hum Brain Mapp. 2009;30(11):3748–3758. doi: 10.1002/hbm.20803. [DOI] [PMC free article] [PubMed] [Google Scholar]