

Abstract
Background: Currently, early weight-loss predictions of long-term weight-loss success rely on fixed percent-weight-loss thresholds.
Objective: The objective was to develop thresholds during the first 3 mo of intervention that include the influence of age, sex, baseline weight, percent weight loss, and deviations from expected weight to predict whether a participant is likely to lose 5% or more body weight by year 1.
Design: Data consisting of month 1, 2, 3, and 12 treatment weights were obtained from the 2-y Preventing Obesity Using Novel Dietary Strategies (POUNDS Lost) intervention. Logistic regression models that included covariates of age, height, sex, baseline weight, target energy intake, percent weight loss, and deviation of actual weight from expected were developed for months 1, 2, and 3 that predicted the probability of losing <5% of body weight in 1 y. Receiver operating characteristic (ROC) curves, area under the curve (AUC), and thresholds were calculated for each model. The AUC statistic quantified the ROC curve’s capacity to classify participants likely to lose <5% of their body weight at the end of 1 y. The models yielding the highest AUC were retained as optimal. For comparison with current practice, ROC curves relying solely on percent weight loss were also calculated.
Results: Optimal models for months 1, 2, and 3 yielded ROC curves with AUCs of 0.68 (95% CI: 0.63, 0.74), 0.75 (95% CI: 0.71, 0.81), and 0.79 (95% CI: 0.74, 0.84), respectively. Percent weight loss alone was not better at identifying true positives than random chance (AUC ≤0.50).
Conclusions: The newly derived models provide a personalized prediction of long-term success from early weight-loss variables. The predictions improve on existing fixed percent-weight-loss thresholds. Future research is needed to explore model application for informing treatment approaches during early intervention. The POUNDS Lost study was registered at clinicaltrials.gov as NCT00072995.
Keywords: dynamic model, energy balance, receiver operating characteristic, weight loss, mathematical model, likelihood function, regression
See corresponding editorial on page 419.
INTRODUCTION
The goal of any weight-loss intervention is to produce long-term weight loss and weight-loss maintenance (1–7). Although monitoring patient progress early in the intervention is theoretically feasible, continual and frequent monitoring can be time-consuming and burdensome for both subjects and clinicians. In addition, a percentage of patients may respond less effectively to selected intervention strategies. Connecting the relation between long-term weight-loss outcomes with short-term intervention quantitatively offers health care providers and patients an opportunity to evaluate intervention strategy early and seek alternate treatment in the case of less effective patient response.
Lifestyle modifications that promote weight loss are often readily applied as a preferred treatment of overweight and obese patients, and an existing body of research has examined short-term predictors of long-term weight-loss success. Analysis of data in the Preventing Obesity Using Novel Dietary Strategies (POUNDS Lost) study (8) revealed that early behavioral adherence (attendance to group sessions, self-monitoring through frequent weighing) was a significant predictor of short-term (<6 mo) and long-term (24 mo) weight loss. In addition, the magnitude of weight lost early in the intervention was a predictor of long-term weight loss. Similar results were found in the Action for Health in Diabetes (Look AHEAD) study (9–12) and within participants of the Diabetes Prevention Program (7).
Here we examined whether short-term predictions of long-term weight-loss success can be improved beyond fixed thresholds of percent weight loss (11) by including known variables that influence weight loss (8) along with quantifications of expected weight loss obtained from a validated dynamic model predicting weight change (13). We defined successful long-term weight loss as individuals who lost ≥5% of their body weight by the end of year 1 (14).
METHODS
Subjects
Details involving the experimental design of the POUNDS Lost study are described elsewhere (15). POUNDS Lost participants (n = 811) were randomly assigned to one of 4 dietary weight-loss interventions (an average of 750 kcal/d below baseline requirements) varying in macronutrient composition. The first diet composition consisted of 20% fat and 15% protein, the second 40% fat and 15% protein, the third 20% fat and 25% protein, and the fourth 40% fat and 25% protein. The study was carried out at 2 sites: the Harvard School of Public Health and Brigham and Women’s Hospital, Boston, Massachusetts, and the Pennington Biomedical Research Center in Baton Rouge, Louisiana. During the first 26 wk of the study, hour-long group sessions were held 3 out of every 4 wk. Participants were strongly encouraged to attend all group meetings; however, if a participant missed a session, he or she was instructed to schedule an individualized visit with his or her assigned counselor. Participants were provided with nutrition education and were taught behavioral strategies to optimize their adherence to dietary targets. In addition to group meetings, participants met individually with their assigned counselor every 8 wk. Individual sessions were applied to review the participant’s adherence to the dietary intervention, find solutions to any challenges encountered between visits, and develop a plan to maximize the participant’s future adherence. Behavior modification strategies were integrated into the group and individual sessions with the aim of promoting adherence to the prescribed macronutrient diet. For all 4 treatment arms, 90 min of physical activity per week was prescribed.
The aim of this current study was to develop a quantitative diagnostic that demarcates participants likely to achieve weight loss of 5% or more at the end of the first intervention year based on early weight change. Weight loss of at least 5% of body weight has been established as the minimal lower weight loss bound to obtain clinically meaningful health benefits and is the guideline currently used by the Food and Drug Administration to define successful weight loss (16).
To accomplish these aims, we analyzed subject data where body weights were available at baseline and months 1, 2, 3, and 12. Monthly body weights were represented by weights obtained from either measurement visits or intervention visits recorded in the last 2 wk of the month. Because the number of subjects greatly decreased if we also imposed existence of a simultaneous weight at the end of year 2, we focused on the relation to year 1 data.
Mathematical model that predicts weight change
Monthly predicted weights for the POUNDS Lost subjects were obtained from a validated dynamic mathematical model that predicts weight change in response to changes in energy intake and expenditure (13, 17, 18) programmed for multiple subjects in the Visual Basic Application within Microsoft Excel.
The dynamic model has been tested and validated on individual subjects undergoing restrictions in energy intake and moderate increases in physical activity in several previously reported studies (13, 17–20).
The distance from predicted weight at the end of each month was defined to be the difference between actual weight and predicted weight. If the actual weight was higher than predicted, then this value would be positive, and if the actual weight was lower than predicted, then this value would be negative.
Statistical methods
Logistic regression model
Logistic regression models for months 1, 2, and 3 were developed that included covariates of age, sex, baseline weight, and target energy intake. Data involving weight-loss patterns from each month were used for the month-specific models predicting ≥5% weight loss at year 1. These additional variables were distance between actual weight loss and predicted weight loss and the percent weight lost. For example, in month 2, the distance between actual and predicted weight loss and percent weight loss in both months 1 and 2 were included for analysis. The logistic model-estimated coefficients were used to calculate success probabilities for each individual by using the probability distribution function, 1 ÷ (1 + e–β), where β is a linear function of study variables, which was then applied as a continuous input variable to derive the receiver operating characteristic (ROC) curve.
Optimal models (at each month) were classified as those that yielded the highest AUC in the ROC analysis. All analyses were performed with the statistical software package SPSS version 22 (SPSS Inc.).
ROC curves
An ROC analysis (21) was performed to determine which included variables yield the best predictive model of successful year 1 weight loss. Successful year 1 weight loss was defined as weight loss ≥5% (14). ROC curves were developed by using the probability function determined by the logistic regression models. The AUC was calculated for each ROC curve, and the 3 logistic models (one that applied covariates obtained from month 1, one that applied available covariates from months 1 and 2, and one that applied available covariates from months 1, 2, and 3) were retained that yielded the highest AUC values. All analyses were performed with SPSS version 22 (SPSS Inc.).
Comparison of models to percent weight loss as a predictor of long-term weight-loss success
Although the AUC provides a score for model capacity to predict long-term weight-loss success, the primary goal was to determine whether the models improve on current practice. Current practice relies on evaluating percent weight loss early during intervention to predict long-term weight-loss outcomes. To compare the newly derived models with the predictor of percent weight loss, we derived ROC curves relying solely on percent weight loss and compared the subsequent AUC with the AUC obtained by the developed models. All analyses were performed with SPSS version 22 (SPSS Inc.).
Leave-one-out cross-validation
A leave-one-out cross-validation was performed for the optimal models in the statistical software package R (R Core Development Team). For each individual in our data set, the predicted probability was computed by using the estimated logistic regression parameters obtained by omitting that sample data. The resulting ROC curve generated from the predicted probabilities and AUC were calculated and compared with the AUC of the original ROC curve.
Determination of thresholds to identify participants likely to achieve ≥5% body weight loss at the end of year 1
To determine thresholds, we calculated the minimal distance from the point (0,1) on the Cartesian plane to the ROC curve (22, 23), which results in the threshold that best simultaneously maximizes sensitivity and specificity. The minimal distance was analytically calculated by finding the real valued root of the derivative of the distance function between the point (0,1) and the ROC curve. The x-coordinate of the critical point, which represents the 1 − sensitivity value, was retained, and the value of the probability function associated with the critical point was recorded as the threshold. Probability values below the threshold are associated with participants likely to achieve successful long-term weight loss. All calculations were performed in the computer algebra system, Maple 12 (Maplesoft, 2013).
RESULTS
Subjects
Table 1 contains the subject characteristics from the participants in the POUNDS Lost study with adequate demographic data and information required to derive percent-weight-loss changes during study duration as described in Williamson et al. (24), along with the reference database used for this analysis. Because our analysis required simultaneous weights at months 1, 2, 3, and 12, the total number of subjects was reduced from 683 subjects who completed the study by year 1 to 354, but the dietary intervention types remained fairly equal across the reference database.
TABLE 1.
Summary and baseline characteristics of the original POUNDS Lost study and the reference database used to develop the diagnostic test1
| POUNDS Lost study: diet group |
||
| Entire study | Reference data | |
| Women enrolled in each diet group, % | n = 427 | n = 135 |
| 40% fat and 25% protein | 27 | 25 |
| 20% fat and 15% protein | 23 | 26 |
| 20% fat and 25% protein | 21 | 27 |
| 40% fat and 15% protein | 28 | 22 |
| Men enrolled in each diet group, % | n = 256 | n = 219 |
| 40% fat and 25% protein | 24 | 25 |
| 20% fat and 15% protein | 29 | 24 |
| 20% fat and 25% protein | 25 | 24 |
| 40% fat and 15% protein | 22 | 27 |
| Total N | 683 | 354 |
| Age, y | 51 ± 9 | 52 ± 9 |
| Weight, kg | 93 ± 15 | 93 ± 16 |
| BMI, kg/m2 | 33 ± 4 | 33 ± 4 |
POUNDS Lost, Preventing Obesity Using Novel Dietary Strategies.
Logistic regression models and ROC analysis
Table 2 contains the logistic regression models associated with the ROC curves (Figure 1) that yielded the highest ROC along with the corresponding AUC and 95% CIs. The AUC statistic varies between 0 and 1, with the value of 1 representing perfect accuracy in identifying true positives (21). An AUC above 0.50 indicates predictions are better than random chance, with higher AUC values reflecting a more accurate classification of individuals who did and did not lose ≥5% of their body weight by the end of year 1.
TABLE 2.
Optimal model that yielded the highest AUC for each month followed by the AUC obtained from using solely percent weight loss to develop the ROC curve1
| Continuous variables used to develop ROC curve | Logistic regression model2 | Probability cutoff values | AUC (95% CI) |
| Month 1 probability model | −0.1655 − 0.0007 × baseline weight − 0.4037 × sex + 0.0455 × age − 0.0006 × target intake − 0.1594 × distance from predicted month 1 − 0.1466 × percent weight loss month 1 | 0.58 | 0.69 (0.63, 0.74) |
| Month 1 % weight loss | — | — | 0.35 (0.30, 0.41) |
| Month 2 probability model | −0.7366 − 0.0064 × baseline weight − 0.5510 × sex + 0.0368 × age − 0.0004 × target intake + 0.6100 × distance from predicted month 1 − 0.3713 × distance from predicted month 2 − 0.4911 × percent weight loss month 1 − 0.0617 × percent weight loss month 2 | 0.57 | 0.76 (0.71, 0.81) |
| Month 2 % weight loss | — | — | 0.26 (0.21, 0.31) |
| Month 3 probability model | −1.349 − 0.0016 × baseline weight − 0.5403 × sex + 0.0334 × age − 0.0004 × target intake − 0.0156 × distance from predicted month 3 − 0.2627 × percent weight loss month 3 | 0.54 | 0.79 (0.74, 0.84) |
| Month 3 % weight loss | — | — | 0.22 (0.17, 0.27) |
ROC, receiver operating characteristic.
Baseline weight (kg); sex = 0 for females, 1 for males; age (y); target intake (kcal/d); and distance from predicted (kg).
FIGURE 1.

The ROC curves in month 1 (A), month 2 (B), and month 3 (C) based on prediction of a binary outcome of 5% weight loss in 1 y. The solid dark curves use a probability function derived from a logistic regression model that includes covariates of age, baseline weight, height, sex, target intake, distance between actual and expected weight, and percent weight loss available by each month. The long-dashed medium dark curves represent the ROC curves derived from the leave-out-one cross-validation. The dashed curves are based solely on percent weight loss. All dashed curves have an AUC below 0.50. The AUC for the probability function–derived curves in months 1, 2, and 3 were 0.68, 0.75, and 0.79, respectively. The AUCs for the leave-one-out cross-validation ROC curves were 0.66, 0.73, and 0.77 respectively. ROC, receiver operating characteristic.
For month 1, the optimal model included the variables age, baseline weight, sex, target intake, distance between actual and predicted weight at the end of month 1, and percent weight loss at the end of month 1. The resulting AUC was 0.69 (95% CI: 0.63, 0.74). The optimal month 2 model included the following variables: age, baseline weight, sex, target intake, distance between actual and predicted weight at the end of months 1 and 2, and percent weight loss at the end of months 1 and 2. The AUC was 0.75 (95% CI: 0.71, 0.81). The optimal model for month 3 included variables age, baseline weight, sex, target intake, distance between actual and predicted weight at the end of month 3, and percent weight loss at the end of month 3. The AUC was 0.79 (95% CI: 0.74, 0.84).
Leave-one-out cross-validation
The ROC curves obtained from the leave-one-out cross-validation had a comparable AUC to the original ROC curve (Figure 1). The AUCs for the leave-one-out cross-validation ROC curve for months 1, 2, and 3 were 0.66 (95% CI: 0.60, 0.71), 0.73 (95% CI: 0.68, 0.78), and 0.77 (95% CI: 0.72, 0.82), respectively.
Comparison of models to percent weight loss as a predictor of long-term weight-loss success
The AUC from the ROC curves derived by using percent weight loss in months 1, 2, and 3 as a predictor of the binary outcome of ≥5% weight loss at year 1 was consistently below 0.50 (Table 2 and Figure 1, dashed curves).
Determination of thresholds from ROC curves
The calculated thresholds for months 1, 2, and 3 were 0.58, 0.57, and 0.54, respectively (Table 2).
Identification of participants likely to achieve successful long-term weight loss
Traditional applications of thresholds derived from ROC curves rely on a single continuous predictor variable. Cut scores are then directly calculated for the predictor variable. In this analysis, however, we applied several variables through a logistic regression model to obtain estimated success probabilities. Therefore, identifying participants who are likely to achieve successful long-term weight loss in a specific month requires a 2-step process. First, the individual’s age, sex, baseline weight, target energy intake, distance from predicted weight, and percent weight-loss information were entered into the appropriate month-specific logistic regression model (Table 2). The model outcome value, β, was then input into the probability function 1 ÷ (1 + e–β), which provides an estimated success probability between 0 and 1. If this estimated probability value is above the proposed the threshold, then the individual is identified as likely to lose ≥5% of his or her body weight by the end of year 1.
To illustrate the algorithm, we provide an example for the second month of weight loss for a man aged 55 y, with a baseline weight of 122.78 kg and a target energy intake of 1200 kcal/d. At the end of month 1, the participant’s actual weight was 127.46 kg and his predicted weight was 114.51 kg, yielding the distance from predicted as 12.95 kg. At the end of month 2, the participant’s actual weight was 122.56 kg and his predicted weight was 107.24 kg, resulting in the month 2 distance from predicted as 15.32 kg. Percent weight loss was 3.82% in month 1 and −0.18% in month 2. Substituting these values into the month 2 regression formula results in the following:
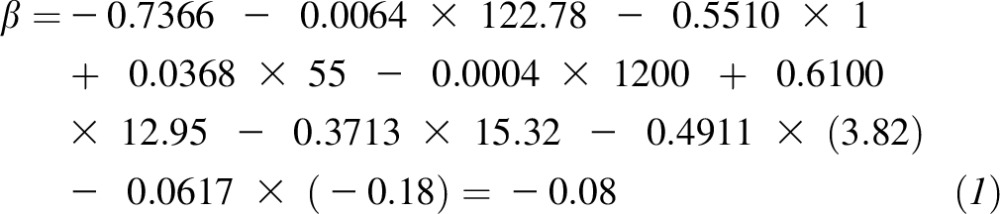 |
Inputting this value into the probability function yields
 |
Because the probability value is less than the threshold for month 2 (0.57), the participant is classified as unlikely to lose ≥5% of his body weight at the end of year 1.
DISCUSSION
Here we used variables of age, sex, baseline body weight, target energy intake, months 1–3 percent weight loss, and months 1–3 deviations from predicted weight loss to classify individuals likely to achieve 5% or more body weight loss at the end of 1 y. The diagnostic determines optimal thresholds from ROC curves derived from models that include the considered variables. The AUCs of the optimal ROC curves were 0.69 using weight-loss data available from month 1, 0.76 using weight-loss data available in month 2, and 0.79 using weight-loss data available in month 3. These results improve on predictions relying on thresholds of percent weight loss. When percent weight loss during the first 3 mo was used as the sole predictor of successful weight loss at year 1 (≥5% body weight), the AUC of the corresponding ROC curves was below 0.50, which indicates predictions that are not better than random chance.
The developed models provide a personalized threshold in each of the first 3 mo that identify individuals likely to lose >5% of their body weight by the end of year 1. Our work extends on a large body of research that has established early behavioral adherence and magnitude of weight lost to long-term weight-loss outcomes (7–11). Inclusion of the covariates of age, sex, baseline weight, target energy intake, and distance from predicted weight in addition to percent weight loss raised the probability of correctly classifying participants who are likely to achieve ≥5% loss of body weight at the end of 1 y from 0.22 to 0.79 in month 3.
This study is not without limitations. The POUNDS Lost study focused primarily on restricting energy intake to reduce weight within the context of 4 diets with differing macronutrient profiles. Although the original study outcomes found that the different diets resulted in clinically meaningful weight loss independent of macronutrient composition (15), the reduced size of each diet arm in our current analysis may obscure a potential macronutrient effect on the predictions.
In addition, because the dynamic model has been validated and successfully applied for lifestyle interventions that include moderate levels of physical activity in combination with restricted energy intake (17, 25), the results presented here are robust and can be applied to interventions that fall in this category. However, the results do not transfer to weight loss achieved from high doses of intense exercise, in which body weight and body composition responses vastly differ from traditional lifestyle interventions that couple restrictions on energy intake with moderate physical activity.
The analysis presented here relied on a binary outcome of ≥5% weight loss at year 1. Five percent weight loss is the magnitude currently employed as the minimum weight loss connected to improved health (10, 14). Although methods employed can be applied to other binary outcomes (e.g., 10% weight loss at year 1), the results would likely be altered. For example, the AUC may be higher or lower with a different year 1 outcome. Similarly, weight loss could be achieved by using alternate treatments such as pharmacotherapy or surgery, which would alter the expected weight-loss trajectory defined by the dynamic model. Finally, because the POUNDS Lost study recruited participants from only Boston and Baton Rouge, the model results should be applied with caution when extending to the entire US population. However, the analysis we performed is robust, and based on the desired definition of successful long-term weight loss, treatment and type of treatment, the ROC analysis, thresholds, and AUC can be readily computed for alternate definitions of successful long-term weight loss and with broader population demographics.
An important limitation of our analyses is that the thresholds cannot be easily translated to an obvious and readily accessible clinical measurement similar to percent weight loss. For example, the Food and Drug Administration has adopted 5% weight loss by 12 wk as an early predictor of long-term weight-loss success (16). On the other hand, more complex models, including the ones developed here, and algorithms can be programmed and made accessible for clinical application through web-based software applications. A second limitation is that absence of a measured body weight at months 1, 2, or 3 would prohibit a long-term success prediction by using data from that particular month. However, we point out that missing early weigh-ins is associated with lower adherence and modest or no long-term weight loss (8, 24).
Finally, providing the ROC analysis as feedback to weight-loss participants could have a positive motivational effect on future weight loss. Several recent studies have successfully applied deviations from validated mathematical model predictions of weight loss to provide participants with feedback to help shift toward more positive weight-loss outcomes (25, 26). Because the model predictions can have a potentially significant impact on patient compliance and enthusiasm along with influencing the commitment of health care providers, it is crucial that the predictions are rigorously validated. Going forward, it will be essential for independent analysis of additional data sets to confirm the approach presented here.
In conclusion, the newly derived thresholds provide an opportunity to identify participants undergoing dietary interventions who are likely to achieve successful long-term weight loss within the first 3 mo of a weight-loss intervention. Application of the dynamic mathematical model that predicts weight change and inclusion of demographic variables provides thresholds that are personalized to each individual. These results can be applied by health care providers to modify treatment strategies in a timely manner.
Acknowledgments
The authors’ responsibilities were as follows—DMT and GAB: conceived of the study; DMT and CKM: developed the dynamic mathematical models; DMT: programmed the software; AEI: performed the statistical analysis; DMT, AEI, CKM, SBH, KM, VEB, and DAW: analyzed the data; DAW, SDA, FMS, DR, and GAB: analyzed the model results in context of the original POUNDS Lost study; and all authors: prepared the manuscript. The authors declared no conflicts of interest related to this study.
REFERENCES
- 1.Anderson JW, Vichitbandra S, Qian W, Kryscio RJ. Long-term weight maintenance after an intensive weight-loss program. J Am Coll Nutr 1999;18:620–7. [DOI] [PubMed] [Google Scholar]
- 2.Anderson JW, Konz EC, Frederich RC, Wood CL. Long-term weight-loss maintenance: a meta-analysis of US studies. Am J Clin Nutr 2001;74:579–84. [DOI] [PubMed] [Google Scholar]
- 3.Ashby WA, Wilson GT. Behavior therapy for obesity: booster sessions and long-term maintenance of weight loss. Behav Res Ther 1977;15:451–63. [DOI] [PubMed] [Google Scholar]
- 4.Wing RR. Behavioral strategies to improve long-term weight loss and maintenance. Med Health R I 1999;82:123. [PubMed] [Google Scholar]
- 5.Sarlio-Lähteenkorva S, Rissanen A. Weight loss maintenance: determinants of long-term success. Eat Weight Disord 1998;3:131–5. [DOI] [PubMed] [Google Scholar]
- 6.Jeffery RW, Drewnowski A, Epstein LH, Stunkard AJ, Wilson GT, Wing RR, Hill DR. Long-term maintenance of weight loss: current status. Health Psychol 2000;19(Suppl):5–16. [DOI] [PubMed] [Google Scholar]
- 7.Wing RR, Hamman RF, Bray GA, Delahanty L, Edelstein SL, Hill JO, Horton ES, Hoskin MA, Kriska A, Lachin J, et al. Achieving weight and activity goals among diabetes prevention program lifestyle participants. Obes Res 2004;12:1426–34. [DOI] [PMC free article] [PubMed] [Google Scholar]
- 8.Williamson DA, Anton SD, Han H, Champagne CM, Allen R, Leblanc E, Ryan DH, Rood J, McManus K, Laranjo N, et al. Early behavioral adherence predicts short and long-term weight loss in the POUNDS Lost study. J Behav Med 2010;33:305–14. [DOI] [PMC free article] [PubMed] [Google Scholar]
- 9.Wadden TA, West DS, Neiberg RH, Wing RR, Ryan DH, Johnson KC, Foreyt JP, Hill JO, Trence DL, Vitolins MZ. One-year weight losses in the Look AHEAD study: factors associated with success. Obesity (Silver Spring) 2009;17:713–22. [DOI] [PMC free article] [PubMed]
- 10.Wadden TA, Neiberg RH, Wing RR, Clark JM, Delahanty LM, Hill JO, Krakoff J, Otto A, Ryan DH, Vitolins MZ. Four-year weight losses in the Look AHEAD study: factors associated with long-term success. Obesity (Silver Spring) 2011;19:1987–98. [DOI] [PMC free article] [PubMed]
- 11.Unick JL, Hogan PE, Neiberg RH, Cheskin LJ, Dutton GR, Evans-Hudnall G, Jeffery R, Kitabchi AE, Nelson JA, Pi-Sunyer FX, et al. Evaluation of early weight loss thresholds for identifying nonresponders to an intensive lifestyle intervention. Obesity (Silver Spring) 2014;22:1608–16. [DOI] [PMC free article] [PubMed] [Google Scholar]
- 12.Ackermann RT, Edelstein SL, Narayan KM, Zhang P, Engelgau MM, Herman WH, Marrero DG. Changes in health state utilities with changes in body mass in the Diabetes Prevention Program. Obesity (Silver Spring) 2009;17:2176–81. [DOI] [PMC free article] [PubMed]
- 13.Thomas DM, Martin CK, Heymsfield SB, Redman LM, Schoeller DA, Levine JA. A simple model predicting individual weight change in humans. J Biol Dyn 2011;5:579–99. [DOI] [PMC free article] [PubMed] [Google Scholar]
- 14.Blackburn G. Effect of degree of weight loss on health benefits. Obes Res 1995;3(Suppl 2):211s–6s. [DOI] [PubMed] [Google Scholar]
- 15.Sacks FM, Bray GA, Carey VJ, Smith SR, Ryan DH, Anton SD, McManus K, Champagne CM, Bishop LM, Laranjo N, et al. Comparison of weight-loss diets with different compositions of fat, protein, and carbohydrates. N Engl J Med 2009;360:859–73. [DOI] [PMC free article] [PubMed] [Google Scholar]
- 16.US Food and Drug Administration. Medications target long-term weight control: consumer health information. Silver Spring (MD): US Food and Drug Administration; 2012.
- 17.Thomas DM, Martin CK, Lettieri S, Bredlau C, Kaiser K, Church T, Bouchard C, Heymsfield SB. Can a weight loss of one pound a week be achieved with a 3,500 kcal deficit? Commentary on a commonly accepted rule. Int J Obes 2013;37:1611–3. [DOI] [PMC free article] [PubMed] [Google Scholar]
- 18.Thomas DM, Gonzalez MC, Pereira AZ, Redman LM, Heymsfield SB. Time to correctly predict the amount of weight loss with dieting. J Acad Nutr Diet 2014;114:857–61. [DOI] [PMC free article] [PubMed] [Google Scholar]
- 19.Thomas DM, Schoeller DA, Redman LA, Martin CK, Levine JA, Heymsfield SB. A computational model to determine energy intake during weight loss. Am J Clin Nutr 2010;92:1326–31. [DOI] [PMC free article] [PubMed] [Google Scholar]
- 20.Thomas DM, Martin CK, Redman LM, Heymsfield SB, Lettieri S, Levine JA, Bouchard C, Schoeller DA. Effect of dietary adherence on the body weight plateau: a mathematical model incorporating intermittent compliance with energy intake prescription. Am J Clin Nutr 2014 Jul 30 (Epub ahead of print; DOI:10.3945/ajcn.113.079822). [DOI] [PMC free article] [PubMed] [Google Scholar]
- 21.Hanley JA, McNeil BJ. The meaning and use of the area under a receiver operating characteristic (ROC) curve. Radiology 1982;143:29–36. [DOI] [PubMed] [Google Scholar]
- 22.Fan J, Upadhye S, Worster A. Understanding receiver operating characteristic (ROC) curves. CJEM 2006;8:19–20. [DOI] [PubMed] [Google Scholar]
- 23.Youden WJ. Index for rating diagnostic tests. Cancer 1950;3:32–5. [DOI] [PubMed] [Google Scholar]
- 24.Williamson DA, Anton SD, Han H, Champagne CM, Allen R, LeBlanc E, Ryan DH, McManus K, Laranjo N, Carey VJ, et al. Adherence is a multi-dimensional construct in the POUNDS Lost trial. J Behav Med 2010;33:35–46. [DOI] [PMC free article] [PubMed] [Google Scholar]
- 25.Martin CK, Miller AC, Thomas DM, Stewart TMC, Han H. Efficacy of an e-Health intervention at promoting weight loss through remote delivery of services: Preliminary results from a randomized controlled trial. 11th International Congress on Obesity; 2010 Jul 11-15; Stockholm, Sweden. 2010:240. 2012.
- 26.Rickman AD, Williamson DA, Martin CK, Gilhooly CH, Stein RI, Bales CW, Roberts S, Das SK. The CALERIE Study: design and methods of an innovative 25% caloric restriction intervention. Contemp Clin Trials 2011;32:874–81. [DOI] [PMC free article] [PubMed]