

Abstract
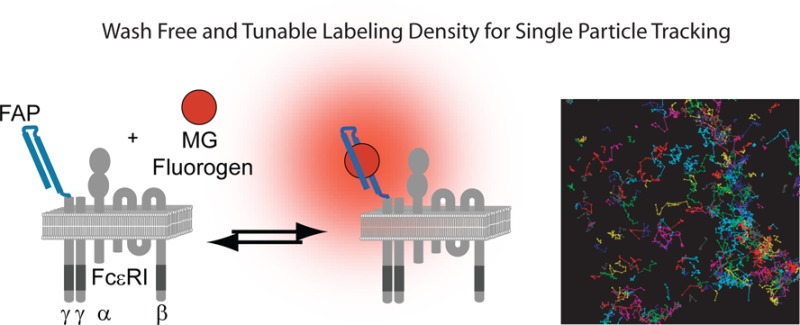
Crosslinking of IgE bound FcεRI on mast cells and basophils by multivalent antigen leads to degranulation and the release of key inflammatory mediators that stimulate the allergic response. Here, we present and characterize the use of fluorogen-activating proteins (FAPs) for single particle tracking of FcεRI to investigate how receptor mobility is influenced after IgE-induced changes in mast cell behavior. FAPs are genetically encoded tags that bind a fluorogen dye and increase its brightness upon binding up to 20,000-fold. We demonstrate that, by titrating fluorogen concentration, labeling densities from ensemble to single particle can be achieved, independent of expression level and without the need for wash steps or photobleaching. The FcεRI γ-subunit fused to a FAP (FAP-γ) provides, for the first time, an IgE-independent probe for tracking this signaling subunit of FcεRI at the single molecule level. We show that the FcεRI γ-subunit dynamics are controlled by the IgE-binding α-subunit and that the cytokinergic IgE, SPE-7, induces mast cell activation without altering FcεRI mobility or promoting internalization. We take advantage of the far-red emission of the malachite green (MG) fluorogen to track FcεRI relative to dynamin–GFP and find that immobilized receptors readily correlate with locations of dynamin recruitment only under conditions that promote rapid endocytosis. These studies demonstrate the usefulness of the FAP system for single molecule studies and have provided new insights into the relationship among FcεRI structure, activity, and mobility.
The targeted response of immune cells to their surrounding environment is mediated through a family of multichain immune recognition receptors (MIRR), typified by the B-cell receptor, T-cell receptor, and high-affinity IgE receptor (FcεRI).1 These receptor systems share a common mechanism of activation in which receptor crosslinking by antigen initiates Src family mediated phosphorylation of immunoreceptor tyrosine-based activation motifs (ITAMs) and propagation of signaling that results in the release of inflammatory mediators and production of cytokines.2−4 MIRRs also share the common structural feature that the extracellular ligand-binding domains and intracellular ITAM-containing domains are carried on separate subunits that interact via noncovalent interfaces between transmembrane regions.5 For each of the MIRR family members, antigen binding is associated with changes in receptor dynamics and topography.6−8 The role of such spatiotemporal changes in regulating signaling remains unclear. In the case of FcεRI, most investigators had concluded that receptor immobilization was requisite for signal initiation.7,9 However, more recently work from our group has demonstrated that small, mobile FcεRI clusters induce Syk kinase activation and near-maximal secretion.10 This finding was made possible through the ability to monitor the molecular-level dynamics of individual IgE-FcεRI during signaling.
FcεRI is composed of four subunits: an α-subunit that binds IgE, and β and γ2 subunits that contribute ITAMs for signaling (Figure 1A). The high affinity of the α-subunit for IgE has provided an opportune method for labeling, as fluorophores can be conjugated to IgE using common linking chemistries.10−12 Although this approach has provided many new insights into FcεRI signaling mechanisms, the use of fluorescently labeled IgE has two major limitations. First, IgE binds specifically to the α-subunit of FcεRI, meaning that the dynamic behavior of the ITAM bearing γ- and β-subunits has not been directly characterized. Early electron microscopy studies suggested that FcεRI subunits did not remain intact after crosslinking,13 and studies of the BCR have suggested that its antigen binding and signaling receptor subunits dissociate, allowing for prolonged signaling at the membrane after the antigen-bound subunits internalize.14 Conversely, more recent fluorescence microscopy experiments have shown colocalization of both α- and γ-subunits within EEA1 positive early endosomes after antigen crosslinking, suggesting that the receptor subunits do remain intact.15 These previous studies used immunofluorescence and biochemical techniques that cannot provide high-resolution information about receptor dynamics. Second, the general use of fluorescent–IgE to label FcεRI means that receptor behavior in the absence of IgE has not been detailed. Traditionally, IgE binding was considered a passive event, with signaling occurring only after multivalent antigen/allergen was captured by IgE–FcεRI complexes. However, it is now clear that IgE binding can itself exhibit a spectrum of effects on mast cells, ranging from increased cell survival and proliferation to complete activation.16−19 IgE binding has been shown to increase FcεRI membrane expression by >2-fold in RBL-2H3 cells20 (Supporting Information Figure 1A) and >6-fold in murine bone marrow mast cells.21 Stabilization of FcεRI at the plasma membrane is a result of decreased receptor turnover rather than increased expression,22,23 but the mechanism of stabilization is mostly uncharacterized. Additionally, a class of IgE, termed cytokinergic, has been shown to be capable of inducing the release of cytokines and inflammatory mediators independent of antigen.24 Serum IgEs taken from human patients with chronic inflammation or allergic diseases exhibit more cytokinergic properties than that of IgEs taken from healthy donors, suggesting that these stimulating IgEs play an important role in autoimmunity and chronic diseases.18 The exact mechanisms through which cytokinergic IgEs trigger a response is still an active area of research. Because small variations in the IgE variable region are thought to be responsible for changes in cytokinergic IgE potency,17,25 fluorescent labeling could result in unintended changes to its cytokinergicity. To overcome these limitations, a new method for following FcεRI that is independent of IgE and reports on the behaviors of the signaling subunits is needed.
Figure 1.
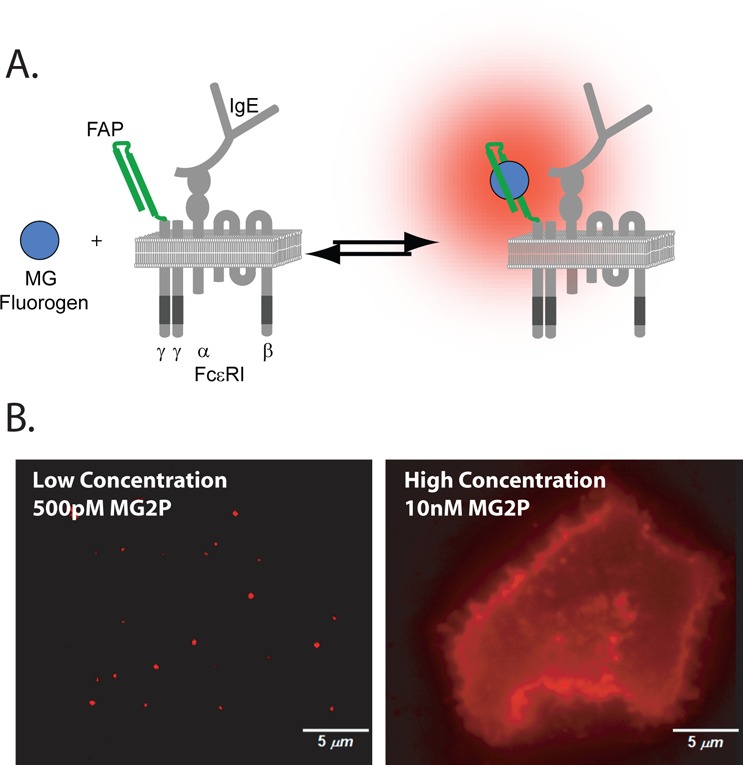
Labeling scheme for fluorogen-activating proteins (FAPs). (A) The HL4.1 FAP-tag was fused to the extracellular N-terminus of the FcεRI γ-subunit. Fluorogen dye is dark when free in solution, but it becomes fluorescent upon binding to its corresponding FAP. (B) Labeling density can be adjusted at the time of imaging on live cells by controlling the concentration of added fluorogen. Single molecule densities for SPT are achieved by addition of fluorogen dye at concentrations below the binding kd (left). Higher fluorogen concentrations result in saturating labeling density (right).
In this work, we extend the studies of FcεRI single molecule dynamics with the introduction of fluorogen activating protein (FAP)26 at the N-terminus (extracellular domain) of the FcεRI γ-subunit (FAP-γ). This construct allows us to directly follow, for the first time, the signaling subunit of FcεRI, independent of IgE. FAPs are genetically expressible single-chain antibody fragments with molecular recognition properties for cognate dye partners termed fluorogens. Binding of fluorogen to the FAP restricts molecular rotations around double bonds in the fluorogen structure and results in significant enhancements in extinction coefficient and fluorescence quantum yield.26 This process (Figure 1A) is fully reversible, and unbound fluorogen, even if previously bound, is essentially nonfluorescent. A number of spectrally distinct FAP variants exist27 and have been used successfully for live cell confocal microscopy and flow cytometry studies.28,29 Recently, it was shown that the MG fluorogen coupled to its cognate FAP exhibited the brightness and photostability needed for single molecule localizations.30 Here, we further characterize the fluorogen properties to evaluate its effectiveness as a single particle-tracking (SPT) probe. We show that the FAP-tag is a versatile tool for live cell imaging and SPT of membrane receptors. The MG fluorogen, with excitation and emission in the far-red, can be fused with a poly(ethylene glycol) (PEG) group to render it membrane impermeable, meaning only receptors at the cell surface have the extracellular FAP-tag accessible for binding. Importantly, fluorogen binding is fast and does not require special buffers or wash steps. Tracking of FAP-γ allowed us to determine, on living cells, that the α- and γ-subunits have equivalent dynamic behavior after antigen crosslinking. We also found that IgE binding causes no change in receptor mobility, even when using concentrations of the cytokinergic IgE SPE-7 that lead to calcium mobilization and mast cell degranulation. Activation with SPE-7 resulted in delayed endocytosis kinetics compared to that with high-valency antigen. Taken together, these results suggest that FcεRI immobilization is correlated with internalization but is not a prerequisite for signaling.
Results and Discussion
FAP−γ Acts as a Functional Subunit of FcεRI
To monitor FcεRI behavior in living cells, we generated a human FcεRI γ-subunit tagged with the HL4.1 FAP attached at the N-terminus (Figure 1A). We expressed the FAP−γ fusion protein in RBL-2H3 cells that endogenously express FcεRI. Priming of FcεRI with IgE has been shown to stabilize the receptor at the plasma membrane.22,23 Consistent with this, overnight addition of Alexa Fluor 488 (AF488) H1-DNP-ε-206 IgE resulted in a 2.4-fold increase in IgE–FcεRIα and a 2.2-fold corresponding increase in surface FAP−γ (Supporting Information Figure S1A). Because IgE binds only the FcεRI α-subunit, the coordinated increase in FAP−γ expression after priming suggests that FAP−γ directly associates with the α-subunit. Co-immunoprecipitation experiments demonstrated directly that both the endogenous β- and γ-subunits can be isolated in complex with FAP−γ and that after receptor crosslinking with multivalent antigen the FAP−γ becomes phosphorylated (Supporting Information Figure S1B). Thus, the presence of endogenous FcεRIγ does not interfere with the ability of the FAP−γ to incorporate into the receptor complex and become activated. Cells expressing FAP−γ also showed normal degranulation and downstream phosphorylation of Syk (Supporting Information Figure S1C,D), suggesting that overexpression of FAP−γ does not alter cellular response to antigen. Addition of membrane-impermeant MG fluorogen to cells expressing FAP−γ showed specific labeling of FAP at the cell surface (Figure 1B, right), which could be easily titrated to the low concentrations needed to follow individual FcεRI at the cell surface (Figure 1B, left). These results indicate that the FAP−γ fusion protein is localized to the plasma membrane, incorporated into the FcεRI receptor complex, and capable of signaling.
FAP Probes for Single Particle Tracking
To demonstrate the potential of the FAP–MG system for SPT, we characterized single particle track length, brightness, and labeling density. SPT requires labeling densities such that individual fluorophores can be identified and tracked over time. Because the MG dye is added at the time of imaging, the fluorogen concentration can be adjusted easily to achieve single molecule labeling densities (Supporting Information Movie 1). Figure 2A shows SPT performed on the same cell with increasing fluorogen concentrations. As fluorogen concentration is increased, the number of molecules tracked increases, demonstrating the simplicity and flexibility of the FAP-based labeling approach. In SPT, it is important to use fluorophores that emit enough photons for precise detection at high frame rates, otherwise mobility estimates are inaccurate due to reduced localization precision. We found the brightness of the MG–FAP complex to be equivalent to other fluorescent proteins,31 with localization precision between 20 and 25 nm (417 mean photons/emitter/frame) with total internal reflection (TIR) illumination at the adherent membrane and 30–35 nm (308 mean photons/emitter/frame) using wide-field excitation on the apical membrane (Figure 2B,C). We found that photobleaching of the fluorogen governs track length (Supporting Information Figure S3A), consistent with the slow dissociation of the MG from HL4.1.30 However, the HL4.1-bound MG is photostable enough to provide trajectories with half-lives on the order of seconds (Figure 2D), sufficient for calculating protein mobility. In addition, the emission of the fluorogen is continuous (Figure 2D, inset), removing the need for tracking corrections due to blinking, as is needed with probes such as quantum dots (QDs).12,32
Figure 2.

Characterizing the FAP–MG system for SPT. (A) MG was added at increasing concentration to the same cell and tracked over 1000 frames for each concentration. Track densities ranging from <1 track/μm2 to >5 tracks/μm2 can be easily adjusted by controlling dye concentration. Scale bar = 3 μm. (B) Histogram of equivalent detected photons for single molecule fits of individual MG fluorogen bound to the FAP−γ probe when imaging on the apical (dashed line) or basal (solid line) surface. (C) Histogram of the corresponding localization precisions obtained for single molecule fits in panel B. (D) Distribution of tracks lengths for trajectories of individual fluorogens. (Inset) Fit intensity over time for an example trajectory exhibits uniform intensity. An acquisition rate of 20 frames/s was used for all single particle-tracking experiments.
FcεRI α- and γ-Subunits Remain Together during Signaling
We first used the FAP−γ as a probe for the FcεRI signaling subunit to determine whether the tetrameric receptor complex remains intact before and after activation. Fluorescently labeled IgE was used in conjunction with FAP−γ to simultaneously follow the γ- and α-subunits before, during, and after activation. Using high concentrations of MG (10 nM), we labeled FAP−γ at the membrane and compared its distribution with that of the α-subunit labeled with saturating levels of AF488-labeled IgE (Figure 3). In the resting state, both the α- and γ-subunits are found uniformly distributed on the plasma membrane (Figure 3A, resting). After addition of 1 μg/mL DNP-BSA, large receptor aggregates are formed that contain both subunits (Figure 3A, +DNP). Because DNP-BSA binds to the DNP-specific IgE on the α-subunit, the observed co-clustering indicates that the γ-subunit remains within the receptor complex after crosslinking. In response to crosslinking at high antigen doses, FcεRI endocytosis can be observed within 2 min.10 After 7 min, we observed vesicles containing both subunits undergoing directed transport (Figure 3B and Supporting Information Movie 2). These results agree with similar studies done in fixed cells labeled with an anti-FcεRIγ antibody.15
Figure 3.

Receptor subunits remain intact during signaling. (A) RBL cells expressing FcεRI FAP−γ labeled with saturating concentrations of AF488-tagged H1-DNP-ε-206 IgE (green) and MG fluorogen (red). Both subunits are uniformly distributed on the plasma membrane in resting cells (top). Crosslinking with 1 μg/mL DNP-BSA leads to co-clustering and co-internalization of the α- and γ-subunits (bottom). (B) Active transport of a vesicle (white arrows) containing both α- and γ-subunits. (C) Simultaneous SPT of α- and γ-subunits shows similar dynamic behavior. Mobility is represented as the cumulative probability distribution of squared displacements (Δt = 2 frames). (D) Immobilization kinetics of FAP−γ and QD585–IgE on the apical cell surface during DNP-BSA addition (black arrow).
Because receptor phosphorylation and calcium mobilization occur within 1 min of antigen addition,10 these ensemble measurements cannot provide insight into the receptor stability during the initial signaling events. To address this, we titrated down the concentration of both fluorogen dye and labeled IgE such that single molecule density was achieved. Either QD585–IgE or AF488–IgE was used for tracking on the apical or basal surface, respectively, in conjunction with saturating concentrations of dark IgE to ensure that all receptors could engage antigen. The spectrally distinct IgE and FAP−γ probes allowed for simultaneous single molecule tracking of the subunits. In the resting state, we found that the α- and γ-subunits exhibit identical mobility (Figure 3C, solid lines). After addition of DNP-BSA at a concentration previously shown to cause immediate receptor immobilization,10 both subunits showed a similar reduction in mobility (Figure 3C, dashed lines). In previous work,10 we have shown that only receptors that are directly engaged by antigen will immobilize under these conditions. Therefore, the observed decrease in FAP−γ mobility is not simply due to a global change in membrane organization but is a result of interactions with the cross-linked α-subunit.
While crosslinking led to subunit co-aggregation, co-endocytosis, and reduced mobility after 5 min, subtle differences in behavior could have still been missed due to the time scale of these measurements. To investigate this possibility, we compared the kinetics of receptor immobilization. By calculating a diffusion coefficient from trajectories over a sliding window of 20 frames, we tracked changes in receptor mobility with ∼1 s time resolution (Figure 3D). Comparing QD585–IgE and FAP−γ mobility on the apical surface revealed that both subunits immobilize rapidly after antigen addition with similar kinetics (Figure 3C). These findings provide strong evidence that the FcεRI complex remains intact throughout crosslinking, activation, and endocytosis. Additionally, the stability of the receptor complex indicates that the behavior of the FAP−γ probe reflects the overall FcεRI behavior.
IgE Binding Does Not Alter FcεRI Mobility
We next took advantage of our FAP−γ probe to investigate the influence of IgE binding on FcεRI mobility, using both non-cytokinergic H1-DNP-ε-206 IgE and the highly cytokinergic SPE-7 IgE. H1-DNP-ε-206 IgE is known to stabilize the receptor at the plasma membrane by preventing receptor turnover22,23 (Supporting Information Figure S1A). SPE-7 IgE promotes Ca2+ mobilization within minutes and degranulation (Supporting Information Figure S2A,B)24,25 similar to that seen with crosslinking antigen. Because these two IgE isoforms elicit different physiological responses, it could be expected that they would also induce unique changes in receptor mobility. Previous studies using time-resolved phosphorescence anisotropy have demonstrated that SPE-7 IgE displays decreased rotational mobility compared to that of H1-DNP-ε-206 IgE on RBL cells, which was attributed to receptor aggregation.24 However, we observed no change in mobility for up to 30 min after IgE addition (Figure 4A,B). These results indicate that the mechanism of action for both types of IgE is not dependent on significant shifts in mobility. In the case of non-cytokinergic IgE, one explanation could be that receptor endocytic events in the absence of IgE are too infrequent to be captured using the low labeling densities needed for SPT. Therefore, subtle changes in a small fraction of receptors may not be reflected in our measurements. In terms of SPE-7, the current hypothesis is that cytokinergic IgEs exhibit either an increased self-affinity or an affinity toward some intermediate autoantigen (dsDNA, histamine releasing factor (HRF), thyroglobulin, β-galactosidase, etc.),17,25 which promotes the formation of small-scale FcεRI aggregation. Interestingly, the concentration of cytokinergic IgE needed to induce a signal is well above saturation, meaning that all receptors are SPE-7 bound and an excess of SPE-7 is in solution. This suggests a role for free IgE in solution in the activation mechanism of SPE-7.17 While high doses of multivalent antigen cause receptor immobilization (Figure 3), our own SPT studies have shown that antigen-induced changes in FcεRI mobility are proportional to antigen concentration and aggregate size rather than signaling capacity.10 In fact, the use of low-valency cross-linker stimulates robust mast cell activation without a measurable change in FcεRI mobility,10 and a recent study from Shelby et al. used live cell super-resolution imaging to provide evidence for receptor signaling before immobilization.11 Therefore, the observation that SPE-7 IgE can initiate signaling without altering FcεRI mobility is consistent with the formation of either very small aggregates (i.e., dimers, trimers) or transient interactions.
Figure 4.
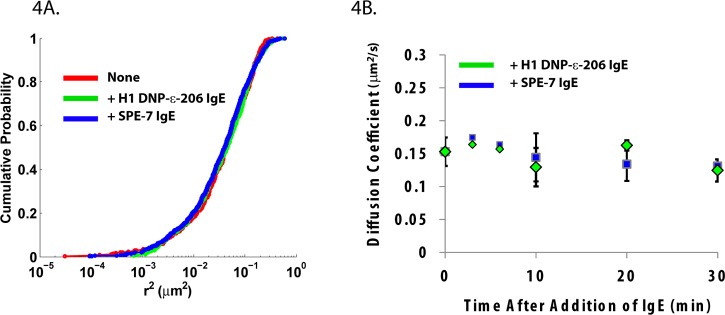
IgE binding does not alter receptor mobility. (A) SPT of FcεRI in the absence of IgE (red) or 30 min after addition of either H1-DNP-ε-206 IgE (green) or SPE-7 IgE (blue). Mobility is represented as the cumulative probability distribution for all squared displacements (Δt = 2 frames). (B) No immediate change in FcεRI diffusion was observed upon IgE addition. SPT time series were collected after addition of IgE for up to 30 min. For the two initial time points, data was collected from 1 to 3 min and 4 to 6 min and binned for analysis. For the 0, 10, 20, 30 min time points, data was binned into 5 min time intervals, beginning at the indicated time point. Diffusion coefficients were calculated as the linear fit of the ensemble MSD for all trajectories within the time window. Error bars for initial time points represent 95% confidence interval of the linear fit. Error bars for all other time points represent the standard deviation over multiple measurements.
Immobilization Correlates with FcεRI Internalization
For many membrane receptors, phosphorylation and ubiquitylation lead to internalization, which is thought to ultimately terminate signal propagation.33 However, previous studies of FcεRI have indicated that phosphorylation is not required for endocytosis.34 It was further shown that receptor mobility is correlated with aggregate size and that large, immobile aggregates are internalized even when the receptors are not phosphorylated.10 Therefore, we postulated that if SPE-7 IgE induces robust signaling without altering mobility, then SPE7-bound FcεRI may have delayed internalization. We took advantage of the extracellular FAP−γ to quantify the influence of IgE binding on receptor internalization kinetics. Although the FAP can be used for quantification of membrane expression levels by flow cytometry (Supporting Information Figure S1A), we found that mast cell activation resulted in a change in membrane permeability that allowed MG cytoplasmic uptake and prevented us from using the FAP-tag to quantify endocytosis. This is perhaps not surprising since FcεRI activation leads to dramatic changes in the actin cytoskeleton and membrane ruffling as well as fusion of granules with the plasma membrane.35 Instead of labeling with fluorogen, we took advantage of the presence of an additional HA-tag at the N terminus of the FAP−γ and labeled surface receptors using an AF488-conjugated anti-HA antibody. The addition of 1 μg/mL DNP-BSA antigen leads to rapid loss of FcεRI from the plasma membrane.10 However, addition and maintenance of cytokinergic SPE-7 IgE in the media did not immediately alter FcεRI cell surface levels (Figure 5A). We found that within the time frame of our SPT experiments (30 min), SPE-7 IgE did not induce any significant changes in surface receptor levels (Figure 5A), and no change was observed until 1.5 h after addition. Consistent with previous studies,24 receptor expression is slightly elevated after 24 h, although the effect is not as pronounced as that with H1-DNP-ε-206 IgE (Figure 5A). Taken together with our observation that SPE7 does not alter receptor mobility, these results are consistent with the idea that activated receptors are not efficiently internalized when they do not immobilize.10 It was shown that the survival effects seen with cytokinergic IgE are dependent on prolonged calcium influx and ERK phosphorylation.36 The delayed endocytosis of SPE-7-bound FcεRI, therefore, may maintain signaling at the membrane for the extended times needed to promote mast cell survival.17
Figure 5.

Monitoring receptor endocytosis. (A) Cell surface levels of FAP−γ were quantified by flow cytometry after addition of either H1-DNP-ε-206 IgE (dark blue) or SPE-7 IgE (light blue) at 10 μg/mL for the indicated time. Error bars represent the standard deviation over multiple measurements. (B) SPT of FAP−γ using TIR illumination on the basal surface of cells co-expressing dynamin–GFP within 2 min of DNP-BSA addition. Examples of dynamin appearance below immobile FAP−γ trajectories (top) as well as FAP−γ immobilization correlated with dynamin localization (bottom). Scale bar, 500 nm. (C) Correlation between FcεRI–FAP−γ mobility and proximity to dynamin quantified by plotting the normalized mean-squared jump distance as a function of distance from dynamin–GFP. Addition of DNP-BSA shows that short jumps correlate with dynamin (dark blue). This effect was not observed for receptors in the absence of IgE (brown) or after 30 min addition of H1-DNP-ε-206 IgE (red) or SPE-7 IgE (pink).
To better understand the mechanism of FcεRI endocytosis, we used two-color imaging to directly correlate FcεRI mobility with endocytic structures. We compared the single molecule trajectories of FcεRIγ with the recruitment of spectrally distinct dynamin–GFP. Dynamin is required for FcεRI endocytosis after crosslinking.37 Using TIR illumination, which excites fluorophores <200 nm from the adherent membrane, we visualized only dynamin recruited to the cell surface. After addition of 1 μg/mL DNP-BSA, we observed that immobilized FcεRI trajectories correlated well with dynamin localizations at the membrane. We found examples of both FcεRI immobilization at sites where dynamin was already present (Figure 5B, bottom, and Supporting Information Movie 3), as well as the appearance of dynamin under immobilized FcεRI (Figure 5B, top, and Supporting Information Movie 4). To quantify these results, we calculated the mean-squared jump distance of FcεRI trajectories as a function of receptor–dynamin proximity (Figure 5C). We found that, after addition of high concentrations of antigen, shorter FcεRI jumps correlated directly with sites of dynamin occurrence (Figure 5B, middle), matching well with our qualitative observations. This correlation was not observed for receptors in the presence of either SPE-7 IgE or H1-DNP-ε-206 IgE, agreeing with our flow cytometry studies (Figure 5A). We also did not see a correlation between jump size and dynamin localization when no IgE was present. These results are also consistent with our SPT experiments (Figure 4) in which no change in receptor mobility was observed with IgE addition. It is important to note that, because of the low labeling densities and expression levels needed for this imaging approach, we cannot directly infer a causal relationship between FcεRI immobilization and dynamin recruitment. Nevertheless, the observation that immobilized receptors colocalize with dynamin at the membrane strengthens the link between receptor mobility and internalization.
Conclusions
We have shown that FAP-tags have sufficient brightness and specificity for SPT studies of membrane receptors. Using a FAP-tagged FcεRI γ-subunit, we investigated the molecular scale dynamics of the receptor independent of IgE. We took advantage of the tunable labeling densities easily attainable with the FAP–fluorogen probe to combine SPT experiments with ensemble wide-field imaging and flow cytometry. This allowed us to directly address two outstanding questions concerning FcεRI: does the receptor remain as a stable complex throughout signaling, and how does the addition of IgE, both non-cytokinergic and cytokinergic, influence receptor mobility and internalization. First, we found that the antigen binding FcεRI α-subunit and the signaling γ-subunit both immobilize with identical kinetics after addition of high concentrations of crosslinking antigen and at later times colocalize within endosomes. While we have not yet examined the dynamics of the FcεRI β-subunit, these results provide compelling evidence that the dynamic behavior of the signaling subunits of FcεRI is regulated by its antigen-bound α-subunit. Second, we find that the activating cytokinergic IgE SPE-7, while shown to induce Ca2+ mobilization and degranulation independent of antigen, does not alter FcεRI mobility or promote immediate receptor internalization. This suggests that cytokinergic IgEs influence mast cell behavior through the formation of small aggregates or a series of transient interactions, insufficient to induce immobilization but sufficient for initiating signaling. Third, we used two-color imaging to correlate receptor mobility with localization to endocytic structures. Under conditions in which FcεRI does rapidly internalize, immobile receptors were found to readily associate within dynamin structures at the plasma membrane. Taken together, these results are consistent with the idea that immobilization is not a requirement for signal initiation but is associated instead with receptor internalization.10 The IgE-independent labeling approach presented here will be useful in further studies to better understand the triggers for FcεRI activation. More generally, the tunable labeling approach provided by the FAP-tag will be directly applicable to the study of many other receptor systems.
Methods
Cell Lines
Rat basophilic leukemia cells were cultured in MEM supplemented with 10% heat-inactivated FBS, puromycin, and l-glutamine. The HL4.1 FAP-tag vector was provided by the Molecular Biosensor Imaging group at Carnegie Mellon University. Stable RBL cell lines were generated by transfecting with FAP−γ (HL4.1) using the Amaxa system according to the manufacturer’s instructions (Solution L, Program T-20) and stable selecting with Geneticin.
Reagents
H1-DNP-ε-206 IgE was prepared as described previously.42 SPE7 IgE (D8406) and DNP-BSA containing ∼25 DNP per BSA (A23018) were both purchased from Sigma. AF488 dye was from Invitrogen. Anti-HA AF488-labeled antibodies were from Cell Signaling (6E2). MG fluorogen was provided as MG-2p by the CMU Molecular Biosensor Imaging group. AF488 labeled H1-DNP-ε-206 IgE was prepared using the antibody labeling kit (Invitrogen) giving a final dye to protein ratio of 3:1. The dynamin–GFP-encoding plasmid was a gift from Dr. Sandra Schmidt (UT Southwestern). Unless specified, SPE7 IgE was used at 10 μg/mL, a concentration previously shown to induce a robust response.24,25
Live Cell Imaging
Cells were grown on piranha-cleaned coverslips for 4–10 h in phenol-free MEM medium supplemented with penicillin–streptomycin and l-glutamine. Cells were imaged in Hank’s buffered saline solution (HBSS) maintained at 35 °C using a Bioptics objective heater. IgE was preincubated for the durations specified in HBSS at 37 °C and then imaged. Between 500 pM and 10 nM of MG fluorogenic dye was added26 at the time of imaging to achieve labeling densities for SPT or high-density ensemble images.
Image Acquisition
All data was collected using an inverted microscope (IX71; Olympus) equipped with a 150×, 1.45 NA oil-immersion total internal reflection fluorescence objective (U-APO; Olympus). A 637 nm laser diode (HL63133DG, Thorlabs) was used for MG excitation, and a 488 nm laser (Cyan Scientific; Spectra-Physics) was used for AF488 and QD585 excitation. A quad-band dichroic and emission filter set (LF405/488/561/635-A; Semrock) set was used for sample illumination and emission. Emission light was separated onto different quadrants of an electron-multiplying charge-coupled device (EMCCD) camera (iXon 897; Andor Technologies), using either a four channel image splitter (QV2; Photometrics) with additional emission filters (692/40 and 525/30 nm; Semrock) or a custom-built two channel splitter with a 635 nm dichroic (Semrock) and additional emission filters (584/20 692/40, 525/30 nm; Semrock). Images were 256 × 256 pixels, with a pixel size of 0.106 μm and acquired at 20 frames/s (50 ms exposure time).
Single Particle-Tracking Analysis
All analysis was performed using custom written software in Matlab (The MathWorks, Inc.) in conjunction with the image processing software DIPImage (Delft University of Technology).
Data was preprocessed by subtracting camera offset and dividing by a gain factor to convert image data from raw output to Poisson distributed “counts” as previously described for each image frame.38 Subregions were selected by finding the local maximum intensity of an image generated by filtering using the difference of two Gaussian kernels. Each subregion was then fitted to a pixelated Gaussian PSF model using a maximum likelihood estimator to find the position, intensity, and background.38 Fit precision was estimated using the Cramér–Rao lower bound values calculated using the parameter fit and accepted or rejected based on a log-likelihood ratio test as well as intensity and background cut-offs.39 Accepted positions were connected using a modification of a cost matrix approach.40
Unless specified, mobility was represented by cumulative distribution of squared displacements for all trajectories as previously described.32 To quantify changes in mobility over time in Figure 4B, a diffusion coefficient for each 5 min time period was estimated on the basis of fitting the first five points (250 ms) of the mean-squared displacement curve for all tracks to a weighted linear fit. To obtain the higher temporal resolution in Figure 3D, a maximum likelihood estimator was used to estimate instantaneous D.41 Individual jumps were grouped temporally using a sliding window of 20 frames (∼1 s) according the temporal midpoint of the observations. To correctly represent the variability in measurement, data from three different experiments was combined and bootstrapped as follows: 100 trials were used in which 1/5 of all trajectories were chosen at random to calculate the instantaneous D over a sliding window of 20 frames. For each sliding window time point, the standard deviation over all trials was used as the upper and lower error bounds. Student’s t test was used to compare the mean values at each time point between the channels. P-values > 0.05 were found consistently across all time points, indicating that differences were not significant.
Flow Cytometry
Flow cytometry was performed using an Accuri C6 flow cytometer. For quantifying FAP−γ expression, cells were either labeled overnight or for 30 min with AF488-IgE; 50 nM MG was then added, and cells were measured. For internalization assays, cells were grown on suspension culture dishes for 12 h before addition of 10 μg/mL IgE. Cells were incubated with the appropriate IgE for the time indicated, collected from the suspension dish by pipetting rigorously, washed, and then placed on ice in the presence of anti-HA AF488 antibody at 1:50 dilution for 15 min.
Channel Overlay and Correlated Motion Analysis
Two-channel image registration was performed by finding the position of multicolor beads (Tetraspek beads, Invitrogen) in both channels as previously described.32 An affine transform was used to transform SPT coordinates into the green color channel. Sequences of dynamin–GFP were first filtered with a Gaussian kernel with sigmax,y of 1 pixel (0.106 μm) and sigmaT of 5 frames (250 ms). Dynamin locations were identified using the preliminary box finding step of the single molecule fitting algorithm, giving localization to within 1 pixel (0.106 μm). A distance transform image was generated from these positions using the DipImage distance transform function “dt” at each frame. Squared displacements for trajectory jumps were then binned based on the distance assignment of their starting localization.
Acknowledgments
This work was supported by National Institutes of Health R01 R01GM100114 (D.S.L.), NSF CAREER Award no. 0954836 (K.A.L.), National Institutes of Health 8U54GM103529, and the New Mexico Spatiotemporal Modeling Center (National Institutes of Health P50GM0852673). S.L.S. was supported by fellowships from CNTC and NSMS IGERT. We thank S. Schmidt for providing the dynamin–GFP construct, H. Johnson and A. Holmes for assistance with tissue culture, B. Wilson for useful discussion, C. Pehlke for assistance in image processing, C. Valley for artistic consulting, and J. Gillette for use of the AccuriC6. We also acknowledge the UNM Flow Cytometry Facility for cell sorting and the UNM Cancer Center Fluorescence Microscopy Shared Resource (http://hsc.unm.edu/crtc/microscopy/acknowledgement.shtml).
Supporting Information Available
Additional methods. Figure 1: FAP-γ successfully incorporates into the FcεRI complex and is capable of signaling. Figure 2: cytokinergic IgE SPE-7 induces calcium mobilization and degranulation independent of antigen. Figure 3: Single molecule MG trajectory lifetime is limited by photobleaching. Movie 1: Example single particle tracking data from MG bound FAP-γ. Movie 2: FcεRIα and FcεRIγ co-internalize and undergo directed transport. Movie 3: FcεRI immobilizes near sites of dynamin recruitment. Movie 4: Dynamin is recruited to sites of immobilized FcεRI. This material is available free of charge via the Internet at http://pubs.acs.org.
The authors declare no competing financial interest.
Funding Statement
National Institutes of Health, United States
Supplementary Material
References
- Sigalov A. (2005) Multi-chain immune recognition receptors: spatial organization and signal transduction. Semin. Immunol. 17, 51–64. [DOI] [PubMed] [Google Scholar]
- Boniface J. J.; Rabinowitz J. D.; Wülfing C.; Hampl J.; Reich Z.; Altman J. D.; Kantor R. M.; Beeson C.; McConnell H. M.; Davis M. M. (1998) Initiation of signal transduction through the T cell receptor requires the multivalent engagement of peptide/MHC ligands. Immunity 9, 459–466. [DOI] [PubMed] [Google Scholar]
- Kraft S.; Kinet J.-P. (2007) New developments in FcepsilonRI regulation, function and inhibition. Nat. Rev. Immunol. 7, 365–78. [DOI] [PubMed] [Google Scholar]
- Thyagarajan R.; Arunkumar N.; Song W. (2003) Polyvalent antigens stabilize B cell antigen receptor surface signaling microdomains. J. Immunol. 170, 6099–106. [DOI] [PubMed] [Google Scholar]
- Sigalov A. B. (2008) Signaling chain homooligomerization (SCHOOL) model. Adv. Exp. Med. Biol. 640, 121–163. [DOI] [PubMed] [Google Scholar]
- Campi G.; Varma R.; Dustin M. L. (2005) Actin and agonist MHC–peptide complex-dependent T cell receptor microclusters as scaffolds for signaling. J. Exp. Med. 202, 1031–6. [DOI] [PMC free article] [PubMed] [Google Scholar]
- Tamir I.; Schweitzer-Stenner R.; Pecht I. (1996) Immobilization of the type I receptor for IgE initiates signal transduction in mast cells. Biochemistry 35, 6872–83. [DOI] [PubMed] [Google Scholar]
- Wilson B. S.; Pfeiffer J. R.; Oliver J. M. (2000) Observing FcepsilonRI signaling from the inside of the mast cell membrane. J. Cell Biol. 149, 1131–42. [DOI] [PMC free article] [PubMed] [Google Scholar]
- Menon A. K.; Holowka D.; Webb W. W.; Baird B. (1986) Crosslinking of receptor-bound IgE to aggregates larger than dimers leads to rapid immobilization. J. Cell Biol. 102, 541–50. [DOI] [PMC free article] [PubMed] [Google Scholar]
- Andrews N. L.; Pfeiffer J. R.; Martinez A. M.; Haaland D. M.; Davis R. W.; Kawakami T.; Oliver J. M.; Wilson B. S.; Lidke D. S. (2009) Small, mobile FcεRI receptor aggregates are signaling competent. Immunity 31, 469–479. [DOI] [PMC free article] [PubMed] [Google Scholar]
- Shelby S. A.; Holowka D.; Baird B.; Veatch S. L. (2013) Distinct stages of stimulated FcεRI receptor clustering and immobilization are identified through superresolution imaging. Biophys. J. 105, 2343–54. [DOI] [PMC free article] [PubMed] [Google Scholar]
- Andrews N. L.; Lidke K. A.; Pfeiffer J. R.; Burns A. R.; Wilson B. S.; Oliver J. M.; Lidke D. S. (2008) Actin restricts FceRI diffusion and facilitates antigen-induced receptor immobilization. Nat. Cell Biol. 10, 955–963. [DOI] [PMC free article] [PubMed] [Google Scholar]
- Asai K.; Fujimoto K.; Harazaki M.; Kusunoki T.; Korematsu S.; Ide C.; Ra C.; Hosoi S. (2000) Distinct aggregation of beta- and gamma-chains of the high-affinity IgE receptor on crosslinking. J. Histochem. Cytochem. 48, 1705–1716. [DOI] [PubMed] [Google Scholar]
- Kim J.-H.; Cramer L.; Mueller H.; Wilson B.; Vilen B. J. (2005) Independent trafficking of Ig-alpha/Ig-beta and mu-heavy chain is facilitated by dissociation of the B cell antigen receptor complex. J. Immunol. 175, 147–154. [DOI] [PMC free article] [PubMed] [Google Scholar]
- Fattakhova G. V.; Masilamani M.; Narayanan S.; Borrego F.; Gilfillan A. M.; Metcalfe D. D.; Coligan J. E. (2009) Endosomal trafficking of the ligated FcvarepsilonRI receptor. Mol. Immunol. 46, 793–802. [DOI] [PMC free article] [PubMed] [Google Scholar]
- Kalesnikoff J.; Huber M.; Lam V.; Damen J. E.; Zhang J.; Siraganian R. P.; Krystal G. (2001) Monomeric IgE stimulates signaling pathways in mast cells that lead to cytokine production and cell survival. Immunity 14, 801–811. [DOI] [PubMed] [Google Scholar]
- Bax H. J.; Keeble A. H.; Gould H. J. (2012) Cytokinergic IgE action in mast cell activation. Front. Immunol. 3, 229. [DOI] [PMC free article] [PubMed] [Google Scholar]
- Kashiwakura J.-I.; Okayama Y.; Furue M.; Kabashima K.; Shimada S.; Ra C.; Siraganian R. P.; Kawakami Y.; Kawakami T. (2012) Most highly cytokinergic IgEs have polyreactivity to autoantigens. Allergy, Asthma Immunol. Res. 4, 332–40. [DOI] [PMC free article] [PubMed] [Google Scholar]
- Kawakami T.; Kitaura J.; Xiao W.; Kawakami Y. (2005) IgE regulation of mast cell survival and function. Novartis Found. Symp. 271, 100–7. [PubMed] [Google Scholar]
- Furuichi K.; Rivera J.; Isersky C. (1985) The receptor for immunoglobulin E on rat basophilic leukemia cells: effect of ligand binding on receptor expression. Proc. Natl. Acad. Sci. U.S.A. 82, 1522–1525. [DOI] [PMC free article] [PubMed] [Google Scholar]
- Hsu C.; MacGlashan D. (1996) IgE antibody up-regulates high affinity IgE binding on murine bone marrow-derived mast cells. Immunol. Lett. 52, 129–134. [DOI] [PubMed] [Google Scholar]
- Kubo S.; Matsuoka K.; Taya C.; Kitamura F.; Takai T.; Yonekawa H.; Karasuyama H. (2001) Drastic up-regulation of Fc RI on mast cells is induced by IgE binding through stabilization and accumulation of Fc RI on the cell surface. J. Immunol. 167, 3427–3434. [DOI] [PubMed] [Google Scholar]
- Borkowski T. A.; Jouvin M. H.; Lin S. Y.; Kinet J. P. (2001) Minimal requirements for IgE-mediated regulation of surface Fc epsilon RI. J. Immunol. 167, 1290–6. [DOI] [PubMed] [Google Scholar]
- Kitaura J.; Song J.; Tsai M.; Asai K.; Maeda-Yamamoto M.; Mocsai A.; Kawakami Y.; Liu F.-T.; Lowell C. A.; Barisas B. G.; Galli S. J.; Kawakami T. (2003) Evidence that IgE molecules mediate a spectrum of effects on mast cell survival and activation via aggregation of the FcepsilonRI. Proc. Natl. Acad. Sci. U.S.A. 100, 12911–6. [DOI] [PMC free article] [PubMed] [Google Scholar]
- Kawakami T.; Kitaura J. (2005) Mast cell survival and activation by IgE in the absence of antigen: a consideration of the biologic mechanisms and relevance. J. Immunol. 175, 4167–73. [DOI] [PMC free article] [PubMed] [Google Scholar]
- Szent-Gyorgyi C.; Schmidt B. F.; Creeger Y.; Fisher G. W.; Zakel K. L.; Adler S.; Fitzpatrick J. A. J.; Woolford C. A.; Yan Q.; Vasilev K. V.; Berget P. B.; Bruchez M. P.; Jarvik J. W.; Waggoner A. (2008) Fluorogen-activating single-chain antibodies for imaging cell surface proteins. Nat. Biotechnol. 26, 235–240. [DOI] [PubMed] [Google Scholar]
- Ozhalici-Unal H.; Pow C. L.; Marks S. A.; Jesper L. D.; Silva G. L.; Shank N. I.; Jones E. W.; Burnette J. M.; Berget P. B.; Armitage B. A. (2008) A rainbow of fluoromodules: a promiscuous scFv protein binds to and activates a diverse set of fluorogenic cyanine dyes. J. Am. Chem. Soc. 130, 12620–1. [DOI] [PMC free article] [PubMed] [Google Scholar]
- Fisher G. W.; Adler S. A.; Fuhrman M. H.; Waggoner A. S.; Bruchez M. P.; Jarvik J. W. (2010) Detection and quantification of beta2AR internalization in living cells using FAP-based biosensor technology. J. Biomol. Screening 15, 703–709. [DOI] [PubMed] [Google Scholar]
- Holleran J. P.; Glover M. L.; Peters K. W.; Bertrand C. A.; Watkins S. C.; Jarvik J. W.; Frizzell R. A. (2012) Pharmacological rescue of the mutant cystic fibrosis transmembrane conductance regulator (CFTR) detected by use of a novel fluorescence platform. Mol. Med. 18, 685–96. [DOI] [PMC free article] [PubMed] [Google Scholar]
- Yan Q.; Schwartz S. L.; Maji S.; Huang F.; Szent-Gyorgyi C.; Lidke D. S.; Lidke K. A.; Bruchez M. P. (2014) Localization microscopy using noncovalent fluorogen activation by genetically encoded fluorogen-activating proteins. ChemPhysChem 15, 687–95. [DOI] [PMC free article] [PubMed] [Google Scholar]
- Shcherbakova D. M.; Sengupta P.; Lippincott-Schwartz J.; Verkhusha V. V. (2014) Photocontrollable fluorescent proteins for superresolution imaging. Annu. Rev. Biophys. 43, 303–329. [DOI] [PMC free article] [PubMed] [Google Scholar]
- Low-Nam S. T.; Lidke K. A.; Cutler P. J.; Roovers R. C.; van Bergen en Henegouwen P. M. P.; Wilson B. S.; Lidke D. S. (2011) ErbB1 dimerization is promoted by domain co-confinement and stabilized by ligand binding. Nat. Struct. Mol. Biol. 18, 1244–9. [DOI] [PMC free article] [PubMed] [Google Scholar]
- Sorkin A.; von Zastrow M. (2009) Endocytosis and signalling: intertwining molecular networks. Nat. Rev. Mol. Cell Biol. 10, 609–22. [DOI] [PMC free article] [PubMed] [Google Scholar]
- Mao S. Y.; Varin-Blank N.; Edidin M.; Metzger H. (1991) Immobilization and internalization of mutated IgE receptors in transfected cells. J. Immunol. 146, 958–66. [PubMed] [Google Scholar]
- Pfeiffer J. R.; Seagrave J. C.; Davis B. H.; Deanin G. G.; Oliver J. M. (1985) Membrane and cytoskeletal changes associated with IgE-mediated serotonin release from rat basophilic leukemia cells. J. Cell Biol. 101, 2145–55. [DOI] [PMC free article] [PubMed] [Google Scholar]
- Sly L. M.; Kalesnikoff J.; Lam V.; Wong D.; Song C.; Omeis S.; Chan K.; Lee C. W. K.; Siraganian R. P.; Rivera J.; Krystal G. (2008) IgE-induced mast cell survival requires the prolonged generation of reactive oxygen species. J. Immunol. 181, 3850–60. [DOI] [PMC free article] [PubMed] [Google Scholar]
- Liu F. T.; Bohn J. W.; Ferry E. L.; Yamamoto H.; Molinaro C. A.; Sherman L. A.; Klinman N. R.; Katz D. H. (1980) Monoclonal dinitrophenyl-specific murine IgE antibody: preparation, isolation, and characterization. J. Immunol. 124, 2728–37. [PubMed] [Google Scholar]
- Cleyrat C.; Darehshouri A.; Anderson K. L.; Page C.; Lidke D. S.; Volkmann N.; Hanein D.; Wilson B. S. (2013) The architectural relationship of components controlling mast cell endocytosis. J. Cell Sci. 126, 4913–25. [DOI] [PMC free article] [PubMed] [Google Scholar]
- Smith C. S.; Joseph N.; Rieger B.; Lidke K. A. (2010) Fast, single molecule localization that achieves theoretically minimum uncertainty. Nat. Methods 7, 373–5. [DOI] [PMC free article] [PubMed] [Google Scholar]
- Huang F.; Schwartz S. L.; Byars J. M.; Lidke K. A. (2011) Simultaneous multiple-emitter fitting for single molecule super-resolution imaging. Biomed. Opt. Express 2, 1377–93. [DOI] [PMC free article] [PubMed] [Google Scholar]
- Jaqaman K.; Loerke D.; Mettlen M.; Kuwata H.; Grinstein S.; Schmid S. L.; Danuser G. (2008) Robust single particle tracking in live-cell time-lapse sequences. Nat. Methods 5, 695–702. [DOI] [PMC free article] [PubMed] [Google Scholar]
- Michalet X.; Berglund A. J. (2012) Optimal diffusion coefficient estimation in single particle tracking. Phys. Rev. E 85, 061916. [DOI] [PMC free article] [PubMed] [Google Scholar]
Associated Data
This section collects any data citations, data availability statements, or supplementary materials included in this article.