

Background: Perilipin 5 (Plin5) protects cardiac lipid droplets from uncontrolled lipolysis.
Results: Plin5-mediated inhibition of lipid droplet triglyceride breakdown is reversed by the action of protein kinase A (PKA) depending on serine 155 of Plin5.
Conclusion: The lipolytic barrier function of Plin5 is under regulation of PKA.
Significance: Regulation of Plin5 is implicated in the development of lipolysis-related cardiac disease.
Keywords: Adipose Triglyceride Lipase (ATGL), Cardiac Metabolism, Cardiac Muscle, Lipase, Lipid Droplet, Lipolysis, Protein Kinase A (PKA), Triacylglycerol, Perilipin 5, Comparative Gene Identification-58
Abstract
Defective lipolysis in mice lacking adipose triglyceride lipase provokes severe cardiac steatosis and heart dysfunction, markedly shortening life span. Similarly, cardiac muscle (CM)-specific Plin5 overexpression (CM-Plin5) leads to severe triglyceride (TG) accumulation in cardiomyocytes via impairing TG breakdown. Interestingly, cardiac steatosis due to overexpression of Plin5 is compatible with normal heart function and life span indicating a more moderate impact of Plin5 overexpression on cardiac lipolysis and energy metabolism. We hypothesized that cardiac Plin5 overexpression does not constantly impair cardiac lipolysis. In line with this assumption, TG levels decreased in CM of fasted compared with nonfasted CM-Plin5 mice indicating that fasting may lead to a diminished barrier function of Plin5. Recent studies demonstrated that Plin5 is phosphorylated, and activation of adenylyl cyclase leads to phosphorylation of Plin5, suggesting that Plin5 is a substrate for PKA. Furthermore, any significance of Plin5 phosphorylation by PKA in the regulation of TG mobilization from lipid droplets (LDs) is unknown. Here, we show that the lipolytic barrier of Plin5-enriched LDs, either prepared from cardiac tissue of CM-Plin5 mice or Plin5-transfected cells, is abrogated by incubation with PKA. Notably, PKA-induced lipolysis of LDs enriched with Plin5 carrying a single mutation at serine 155 (PlinS155A) of the putative PKA phosphorylation site was substantially impaired revealing a critical role for PKA in Plin5-regulated lipolysis. The strong increase in protein levels of phosphorylated PKA in CM of Plin5 transgenic mice may partially restore fatty acid release from Plin5-enriched LDs, rendering these hearts compatible with normal heart function despite massive steatosis.
Introduction
LDs2 are specialized cellular organelles ubiquitously present from bacteria up to humans. These organelles are highly dynamic, and their main function is to store TGs as an energy reservoir (1–4). Furthermore, LDs are involved in several cellular processes, including the generation of signaling molecules and the supply of lipids and precursors as substrates for membrane synthesis (5). The heart has a continuous high energy demand that is met by exogenous fatty acid (FA) and glucose supply. The healthy adult heart relies more on FAs as oxidative fuel than on glucose. In general, LDs and glycogen granules are sparsely distributed in CM indicating that most of the FAs and carbohydrates taken up by the heart are immediately utilized or transiently deposited in the cardiac TG and glycogen pool. Yet the accumulation of LDs within CM is a characteristic of the diabetic heart that may protect from the harmful consequences of increased nonesterified FA levels (6). Until recently, it was assumed that most of the FAs taken up by the heart are immediately activated and taken up by mitochondria for FA oxidation (FAO). This view was challenged by the studies of Banke et al. (7) and Haemmerle et al. (8) demonstrating that the cardiac TG pool is highly dynamic and substantially contributes to FA delivery as oxidative fuel and signaling components, thereby regulating mitochondrial FAO.
Cellular TG breakdown is a three-step process involving ATGL and its co-activator comparative gene identification-58 (CGI-58), HSL, and monoglyceride lipase (5). In white and brown adipose tissue (AT), Plin1 is abundantly dispersed at the LD surface and constitutes a main regulator in TG mobilization (3). Upon β-adrenergic stimulation, Plin1 is phosphorylated by PKA at up to six PKA phosphorylation sites (10). Phosphorylated Plin1 is critical for lipolysis by recruiting and releasing lipases and co-factors required for efficient TG catabolism (11–14). These studies suggest that under basal conditions the lipolytic co-activator CGI-58 is recruited to LDs via binding to Plin1. Upon β-adrenergic stimulation, PKA-mediated phosphorylation of Plin1 releases CGI-58 that is required for the subsequent activation of ATGL TG hydrolytic activity. However, the regulation of lipolysis in non-AT is less understood. In these tissues, Plin1 is absent and is substituted by other members of the perilipin protein family (1, 15). Over the last years, several studies suggested a critical role for Plin5 in the regulation of lipolysis in highly oxidative tissues such as the heart, skeletal muscle, and liver (15–18). Plin5 interacts with central regulators of lipid hydrolysis, including ATGL, HSL, and CGI-58, and the release of CGI-58 from Plin5 interaction is required for stimulation of ATGL-mediated TG catabolism (19–21). Several independent studies demonstrate that Plin5 is a PKA substrate (21–23), but the impact of PKA on the regulation of Plin5 function is currently unknown.
The in vivo role of Plin5 in cardiac TG catabolism is particularly evident in mice globally lacking Plin5, which are virtually devoid of LDs in CM (24). In contrast, cardiac-specific overexpression of Plin5 (CM-Plin5) provokes massive TG deposition in the heart (25, 26). Data suggest that Plin5 acts as a lipolytic barrier thereby protecting the heart from uncontrolled TG mobilization and the harmful consequences of increasing levels of nonesterified FAs, a condition designated as lipotoxicity (6). The extent of cardiomyocyte TG accumulation in CM-Plin5 mice is very similar when compared with cardiac steatosis of mice globally lacking ATGL (26). Curiously, severe cardiac steatosis in Plin5 transgenic mice was compatible with normal heart function (25), whereas ATGL deficiency provoked severe cardiac dysfunction leading to the premature death of the mice (27). The aim of our study was to unravel the potential role of PKA in Plin5-regulated lipolysis, which may deliver novel insights in the metabolic adaptations protecting CM-Plin5 mice from the development of cardiac dysfunction despite cardiac steatosis. Furthermore, we examined the impact of cardiac-specific Plin5 overexpression on mitochondrial FAO and glucose homeostasis.
EXPERIMENTAL PROCEDURES
Animals
Transgenic mice with cardiomyocyte-specific overexpression of Plin5 (CM-Plin5) were generated as described previously (26) and backcrossed onto the C57BL/6 background strain for more than six generations. Animals were housed in a specific pathogen-free facility and maintained on a regular light-dark cycle (14 h light, 10 h dark) with ad libitum access to standard laboratory chow diet (4.5% w/w fat, ssniff Spezialdiäten, Germany) and water. Freshly prepared tissues were immediately snap-frozen. Maintenance, handling, and tissue collection from mice has been approved by the Austrian Federal Ministry for Science and Research and by the local Ethics Committee of the University of Graz.
Tissue Homogenization and Lipid Analysis
Snap-frozen hearts were homogenized in ice-cold lysis buffer A (0.25 m sucrose, pH 7.0, 1 mm EDTA, 1 mm DTT, 20 μg/ml leupeptin, 2 μg/ml antipain, 1 μg/ml pepstatin) using an Ultra Turrax Homogenizer (IKA, Staufen, Germany). The homogenates were centrifuged at 20,000 × g for 30 min at 4 °C, and the infranatants were collected. Protein concentrations were determined using the protein assay reagent from Bio-Rad. Lipid extractions were performed according to the method of Folch (28). Aliquots of the organic phase were evaporated, and lipid extracts were resuspended in ice-cold 1% Triton X-100 by brief sonication. TG concentrations were then measured using a colorimetric kit (Infinity TG reagent, Thermo Fisher Scientific).
Determination of Body Composition
For body composition analysis, mice were weighed followed by fat and lean mass measurements using a miniSpec NMR analyzer (Bruker Optics; Billerica, MA) and the miniSpec plus software.
Metabolic Cages
For the measurement of O2 consumption, CO2 production, and food intake (acclimatized), mice were housed in a laboratory animal monitoring system (PhenoMaster; TSE Systems GmbH, Bad Homburg, Germany) with ad libitum access to standard laboratory chow diet and water as described above.
cDNA Cloning
Mouse Atgl (GenBankTM accession number NM_001163689.1), HSL (Lipe, GenBankTM accession number NM_010719.5), CGI-58 (GenBankTM accession number NM_026179.2), and Plin5 (GenBankTM accession number NM_025874.3) were cloned in the pcDNA4/HisMaxC expression vector as described previously (26, 29). Full-length mouse Plin1 (GenBankTM accession number NM_175640.2) cDNA was amplified from white AT cDNA (forward primer, 5′-CGG TAC CG TCA ATG AAC AAG GGC CCA ACC-3′, and reverse primer, 5′-CTC TAG ATC AGC TCT TCT TGC GCA GCT G-3) and Plin2 (GenBankTM accession number NM_007408.3) cDNA from liver cDNA (forward primer, 5′-AAG GTA CCA GAC CAG AGA GGT GAA GAC ACC ACC-3′, and reverse primer, 5′-GA CTC GAG TCA GAA GTC CAG CTC TGG CAT C-3′) and subsequently cloned into the pcDNA4/HisMaxC (Invitrogen) expression vector.
Expression of Recombinant Proteins
COS-7 cells were grown in low glucose Dulbecco's modified Eagle's medium (Invitrogen) supplemented with 10% fetal calf serum, 100 μg/ml streptomycin, and 100 IU/ml penicillin at 37 °C with 5% CO2 and 95% humidity. Cells were transfected with plasmids encoding respective cDNAs using the Metafectene reagent (Biontex) according to the manufacturer's instructions.
Plin5 Sequence Analysis for Identification of Conserved PKA Phosphorylation Sites
Full-length murine Plin5 protein was analyzed for PKA phosphorylation sequence motifs by applying ExPASy PROSITE motif scan. An exclusive PKA phosphorylation sequence motif (RRWS) encompassing serine 155 was identified. Serine 155 was exchanged by an alanine (Plin5S155A) using the Q5® site-directed mutagenesis kit (New England Biolabs GmbH, Frankfurt am Main, Germany) and cloned into the pcDNA4/HisMaxC expression vector.
Immunoblot Analysis
Equal protein amounts of tissue lysates, organelle preparations, and cell lysates were separated by SDS-PAGE, and proteins were transferred onto a PVDF membrane (Carl Roth, Karlsruhe, Germany). Blotted proteins were probed using the following primary antibodies: anti-GAPDH (catalog no. 2118, Cell Signaling Technology, Boston, MA); anti-His (catalog no. 27-4710-01, GE Healthcare); anti-HSL (catalog no. 4107, Cell Signaling Technology); anti-pHSL (catalog no. 4126, Cell Signaling Technology), and anti-pPKA (catalog no. 4781, Cell Signaling Technology). Bound immunoglobulins were detected using a horseradish peroxidase-conjugated anti-rabbit IgG antibody (Vector Laboratories, Burlingame, CA) or anti-mouse IgG antibody (GE Healthcare). Immunoblots were developed using the ECL Plus Western blotting detection system (GE Healthcare). Densitometric analyses of x-ray films were performed using ImageJ software (National Institutes of Health, Bethesda, MD) representing a semi-quantitative analysis.
TG Hydrolase Assay
TG hydrolase assays were performed as described previously (29). For the measurement of TG hydrolase activity, cell lysates (1000 × g supernatant) were used. Stimulation of ATGL-mediated TG hydrolysis was performed by addition of COS-7 cell lysates containing His-tagged murine CGI-58 (29). Samples in a total volume of 100 μl of buffer A were incubated with 100 μl of substrate in a water bath at 37 °C for 1 h. The micellar TG substrate contained 330 μm triolein, [3H]triolein as tracer, 45 μm phosphatidylcholine/phosphatidylinositol (3:1) and was prepared by sonication (Virsonic 475; Virtis, Gardiner, NJ).
Labeling and Preparation of LDs
COS-7 cells were transfected with lacZ, Plin1, Plin2, or Plin5 expression vectors as described above. To promote LD formation, the next day cells were incubated overnight in medium supplemented with 0.4 mm oleic acid complexed to essentially FA-free bovine serum albumin (BSA) in a molar ratio of 3:1 together with 4 mCi of [9,10-3H]oleate/mmol as radioactive tracer. For isolation of LDs, cells were trypsinized, centrifuged, and washed three times with PBS. Thereafter, cells were suspended in buffer A and disrupted by sonication (Virsonic 475, Virtis, Gardiner, NJ). Cell lysates were transferred to SW41 tubes, overlaid with buffer B (50 mm potassium phosphate, pH 7.4, 100 mm KCl, 1 mm EDTA, 20 μg/ml leupeptin, 2 μg/ml antipain, 1 μg/ml pepstatin), and centrifuged in a SW41 rotor (Beckman, Fullerton, CA) (2 h, 40,000 rpm, 4 °C). LDs (visible as white layer on top of the tube) were collected, transferred to a new tube, and concentrated by centrifugation (20,000 × g, 15 min, 4 °C) and removal of the underlying fluid. Subsequently, LDs were resuspended in buffer B by brief sonication.
Determination of TG Hydrolase Activity Using Purified LDs as Substrate in the Absence/Presence of PKA
LDs, prepared from COS-7 cells, were diluted to 0.05 μmol of TG/100 μl (220 cpm/nmol) containing 0.5% FA-free BSA potassium phosphate buffer (100 mm, pH 7.0), 5 mm MgCl2, 0.4 mm ATP, and without or with 10 IU PKA (Sigma). The LD substrate was incubated for 30 min at 30 °C and subsequently added to the cell lysates. After incubation for 1 h at 37 °C, FA release from LDs was determined by extraction, and determination of radioactivity was essentially as described for the TG hydrolytic assay. LDs from cardiac tissue were isolated as described above and diluted to a TG concentration of 0.4 μmol/100 μl containing 0.5% FA-free BSA potassium phosphate buffer (100 mm, pH 7.0), 5 mm MgCl2, 0.4 mm ATP, without or with 10 IU of purified PKA. After incubation of LDs for 30 min at 30 °C, COS-7 cell lysates containing ATGL, HSL, CGI-58, or LacZ as control were added and incubated for 1 h at 37 °C. The reaction was terminated by addition of 0.1% Triton X-100 followed by centrifugation at 20,000 × g for 30 min. The lower phase was collected, and FFAs were determined with a commercial kit (Wako Chemicals).
FAO Assay with Cardiac Tissue
FAO measurement in CM homogenates was performed as described by Hirschey et al. (30) with minor adaptations. CM tissues from fasted mice were homogenized in chilled STE buffer (0.25 m sucrose, 10 mm Tris, 1 mm EDTA). Homogenates were centrifuged at 420 × g at 4 °C for 10 min to pellet nuclei and cell debris. The supernatant was centrifuged at 15,000 × g at 4 °C for 15 min to obtain a mitochondrion-enriched fraction. Pellets were washed and resuspended in STE buffer, and protein concentration was determined with protein assay reagent from Bio-Rad. Mitochondria were incubated with the reaction mix (100 mm sucrose, 10 mm Tris, 5 mm KH2PO4, 0.2 mm EDTA, 0.3% BSA, 80 mm KCl, 1 mm MgCl2, 2 mm carnitine, 0.1 mm malate, 0.05 mm CoA, 2 mm ATP, 1 mm DTT, 100 μm oleic acid complexed to BSA, 0.1 μCi/reaction of [14C]oleic acid) for 30 min at 37 °C. The reaction was terminated by transferring the reaction mixture in fresh tubes containing 1 m HClO4. For CO2 trapping, the tube caps were equipped with a piece of filter paper soaked with 20 μl of 10 n NaOH. The closed tubes were incubated at 37 °C for 1 h. Afterward, filter papers were subjected to liquid scintillation counting.
Quantitative Analysis of mRNA Expression Levels
Gene expression analysis was performed by quantitative RT-PCR. Total RNA was extracted with the TRIzol reagent (Invitrogen) and treated with DNase I (Invitrogen). For first strand cDNA synthesis, 1 μg of total RNA was reverse-transcribed at 37 °C for 1 h using random hexamer primer (Applied Biosystems) and Superscript II reverse transcriptase (Invitrogen). Primers used for quantitative RT-PCR were designed to span exon-exon boundaries with an amplicon size of less than 150 bp and BLASTed for specificity. Quantitative RT-PCRs (20 μl) contained 8 ng of cDNA, 10 pm each primer, and 10 μl of SYBR Green master mix (Fermentas) and were carried out using ABI-StepOnePlusTM detection system (Applied Biosystems). Relative mRNA levels were quantified using the comparative ΔΔCT method with β-actin as a reference gene. The following primer sequences were used for RT-PCR: β-actin forward, 5′-AGC CAT GTA CGT AGC CAT CCA-3′, and reverse, 5′-TCT CCG GAG TCC ATC ACA ATG-3′; murine glut4 forward, 5′-GTGACTGGAACACTGGTCCTA-3′, and reverse, 5′-CCAGCCACGTTGCATTGTAG-3′.
Relative Quantification of mtDNA Copy Numbers
Genomic DNA was extracted from mouse hearts with the DNeasy® blood and tissue kit (Qiagen) according to the manufacturer's instructions. Quantitative RT-PCR was carried out as described above. Levels of the mtDNA-encoded gene MT-CO1 were measured and normalized to the single copy nuclear gene Ndufv1 as described by Amthor et al. (31).
Glucose and Insulin Tolerance Tests
Glucose and insulin tolerance tests were performed with mice fasted for 6 and 4 h, respectively. Tests were performed as described previously (27). Glucose levels were determined using the Free-Style Freedom Lite® blood glucose monitoring system (Abbott).
Determination of Tissue Glucose Uptake
Tissue-specific glucose uptake measurements were performed as described previously (32). Briefly, [2-3H]deoxyglucose (DG) (10 μCi/mouse; ARC) was injected intraperitoneally under the conditions described for the glucose tolerance test. [2-3H]DG is trapped as [2-3H]2-deoxyglucose 6-phosphate (DGP) in tissues. After 40 min, mice were sacrificed and tissues collected. Tissues were homogenized in 0.5% HClO4 and centrifuged for 20 min at 2000 × g. The supernatant was neutralized using 1 m potassium phosphate, pH 7.0, and 50 μl of 10% KOH. After centrifugation for 10 min, 1 part of the supernatant was used to determine total tissue counts of [2-3H]DGP and [2-3H]DG and the other part to precipitate 2-deoxyglucose 6-phosphate with 0.15 m Ba(OH)2 and 0.15 m ZnSO4. After centrifugation at 20,000 × g for 5 min, the supernatant was measured to determine [2-3H]DG. Tissue [2-3H]DGP counts were calculated as the difference between total tissue counts and [2-3H]DG counts. For protein measurements, pellets obtained after tissue homogenization were lysed overnight at 55 °C in 0.3 n NaOH, 0.1% SDS.
Statistical Analysis
Data are presented as mean + S.D. Statistical significance was determined by the Student's unpaired two-tailed t test. Group differences were considered significant for p < 0.05 (*), p < 0.01 (**), and p < 0.001 (***).
RESULTS
CM-Plin5 Mice Exhibit Normal Life Span and Fasting Reduced Cardiac TG Content
Cardiomyocyte-specific Plin5 overexpression leads to massive TG accumulation in CM comparable with levels observed in mice lacking ATGL (ATGL-KO) (27). Notably, the life span of CM-Plin5 mice (Fig. 1a) was normal as compared with ATGL-KO mice that die prematurely (27). We hypothesized that cardiac Plin5 overexpression does not constantly impair endogenous TG catabolism in contrast to the persistent lipolytic defect in ATGL-KO mice. Overnight fasting of CM-Plin5 mice provoked a 0.8-fold decrease in cardiac TG levels as compared with nonfasted transgenic mice (Fig. 1b). In contrast, fasting increased (1.8-fold) cardiac TG deposition in wild type (WT) mice. The reduction in cardiac TG levels of fasted CM-Plin5 mice suggests that Plin5 overexpression does not generally impair cardiac TG catabolism. In contrast to the heart, TG levels were comparable in liver and white and brown AT of both genotypes, independent of the nutritional status (data not shown). Determination of body mass composition revealed a mild 1.2-fold increase in body fat mass of CM-Plin5 mice as compared with WT (Fig. 1c). This was accompanied by a 1.3-fold increase in food intake (Fig. 1d) during the light period. Furthermore, respiratory exchange quotient (Fig. 1e), calculated from the ratio of carbon dioxide elimination versus oxygen consumption, was moderately increased (+5%) in CM-Plin5 mice during the light period (when mice are typically less active), indicating a mild increase in glucose utilization as energy fuel. Together, these findings show that cardiac Plin5 overexpression differentially interferes with heart and whole body energy homeostasis in the nonfasted compared with the fasted state.
FIGURE 1.

Life span, cardiac TG content, and metabolic parameters of WT and CM-Plin5 mice. a, Kaplan-Meier plot showing the cumulative survival of CM-Plin5 transgenic mice compared with ATGL-deficient mice (ATGL-KO) over a period of 400 days (n = 12–21). b, cardiac TG levels in 12-week-old nonfasted and fasted WT and CM-Plin5 mice (n ≥ 4). c, body mass composition determined in 12-week-old WT and CM-Plin5 mice compared with WT (n = 5). d, food intake of 12-week-old CM-Plin5 mice compared with WT (n = 5). e, respiratory exchange quotient of 12-week-old WT and CM-Plin5 mice (n = 5). Data are shown as mean ± S.D. *, p < 0.05; **, p < 0.01 and ***, p < 0.001 compared with WT; ##, p < 0.01 compared with nonfasted state.
PKA-mediated Stimulation of FA Release of LDs Isolated from Cardiac Tissue of CM-Plin5 Mice
In cardiac tissue of CM-Plin5 mice, Plin5 protein levels were not significantly changed in the nonfasted compared with the fasted state (Fig. 2a), suggesting that Plin5 function in the regulation of cardiac TG breakdown is not apparently controlled by changes in Plin5 protein expression levels. Recent studies suggest that Plin5 can be a substrate for PKA (21), and in accordance with this hypothesis, studies by Macpherson et al. (22) and Mason et al. (23) demonstrated that Plin5 is a serine-phosphorylated protein and a substrate for PKA phosphorylation. These studies prompted us to examine whether incubation with PKA catalytic subunit interferes with FA release from Plin5-enriched LDs prepared from hearts of CM-Plin5 mice.
FIGURE 2.

PKA stimulates FA release from cardiac LDs of CM-Plin5 mice. a, immunoblot and densitometric analysis of Plin5 protein levels in heart homogenates (1000 × g and 20,000 × g supernatant fraction) derived from 14-week-old nonfasted and fasted WT mice. GAPDH served as loading control and cytosolic marker protein. Immunoblots are representative for two individual tissue preparations using 20 μg of protein (n = 3). b, FA release from LDs prepared from CM of ATGL-deficient and CM-Plin5 mice incubated with COS-7 cell lysates containing LacZ, ATGL, ATGL + CGI-58, and HSL in the absence or presence of PKA (−PKA/+PKA) (n = 3). Data are shown as mean ± S.D. *, p < 0.05; **, p < 0.01, and ***, p < 0.001 versus LDs incubated with LacZ containing lysates (control); #, p < 0.05; ##, p < 0.01; and ###, p < 0.001 versus CM-Plin5 LDs without PKA. c, immunoblot analysis showing protein levels of recombinant HSL, CGI-58, ATGL, and LacZ in cell lysates of transfected COS-7 cells. Coomassie stain served as loading control. d, immunoblot analysis of phosphorylated versus nonphosphorylated HSL protein levels in COS-7 cell lysates in the absence and presence of PKA. 10 μg of protein were resolved by SDS-PAGE (c and d).
The very low abundance of cardiac LDs present in WT mice does not allow their preparation in adequate quantities for assay applications. Therefore, we prepared LDs from ATGL-deficient cardiac tissue as a control and as an additional model of defective cardiac lipolysis. LDs isolated from CM of nonfasted mice were preincubated in the absence and presence of PKA. Subsequently, FA release was measured in the presence of cell lysates containing ATGL, ATGL/CGI-58, HSL, or LacZ as control. As shown previously (26), FA release of LDs prepared from cardiac tissue of CM-Plin5 mice was markedly impaired when incubated with lipase-enriched lysates (ATGL −51.4.0%, ATGL + CGI-58 −45.1%, and HSL −55.2%) as compared with the FA release observed in LD preparations of ATGL-KO mice (Fig. 2b). Notably, PKA incubation increased ATGL- and HSL-mediated FA release from Plin5-enriched LDs (Fig. 2b) (up to 2.2-fold) suggesting that PKA incubation diminishes the lipolytic barrier caused by Plin5 overexpression. In contrast, addition of PKA to cardiac LDs isolated from ATGL-deficient mice did not further increase FA release. Western blot analysis showed comparable protein levels of ATGL, CGI-58, and HSL in the assay (Fig. 2c). To confirm that addition of PKA resulted in protein phosphorylation, we analyzed signal intensities of an antibody detecting phosphorylated HSL and for comparison an antibody detecting total HSL. As shown in Fig. 2d, signal intensities of phosphorylated HSL were increased upon incubation with PKA (Fig. 2d, lower panel), whereas total HSL protein content was unchanged (Fig. 2d, upper panel), confirming that PKA was active. Taken together, the results suggest that PKA-mediated phosphorylation of Plin5 unlocks the barrier function of Plin5 at the LD surface.
Increased Levels of Phosphorylated PKA in CM of CM-Plin5 Mice
The stimulatory impact of PKA incubation on FA release of Plin5-enriched LDs prompted us to measure levels of phosphorylated active PKA in cardiac tissues of Plin5 transgenic and WT mice. As shown in Fig. 3a, signal intensities corresponding to phosphorylated PKA were strongly increased in cardiac tissue of nonfasted (13.5-fold) and fasted (3.7-fold) CM-Plin5 mice as compared with that of WT cardiac tissue (Fig. 3a). In accordance with increased levels of active PKA, levels of phosphorylated HSL were 2.5-fold increased in CM of fasted CM-Plin5 mice (Fig. 3b). Similarly to CM-Plin5 mice, levels of phosphorylated PKA were 2.0-fold increased in CM of ATGL-deficient mice (Fig. 3c) suggesting that the changes in PKA levels are an adaptation to impaired cardiac lipolysis either caused by Plin5 overexpression or the absence of ATGL.
FIGURE 3.

Phosphorylated PKA protein levels are highly increased in heart homogenates of CM-Plin5 mice. a, immunoblot and densitometric analysis of phosphorylated PKA (p-PKA) protein levels in heart homogenates of 12-week-old nonfasted compared with fasted WT and CM-Plin5 mice, respectively. Data are shown as mean ± S.D. *, p < 0.05, and **, p < 0.01 compared with WT; ##, p < 0.01 compared with nonfasted state (n = 4). b, immunoblot and densitometric analysis of phosphorylated HSL (p-HSL) versus nonphosphorylated HSL protein levels in cardiac lysates derived from nonfasted and fasted CM-Plin5 mice. Data are shown as mean ± S.D. **, p < 0.01 versus nonfasted state (n = 3). c, Western blot and densitometric analysis of p-PKA protein levels in cardiac homogenates of 8–11-week-old WT and ATGL-KO mice in the nonfasted state (n = 3). a–c, 20 μg of tissue protein were loaded onto the gels. Immunoblots are representative for two individual tissue preparations.
PKA Regulates Plin5 Barrier Function at the LD Surface
Increased FA release upon PKA incubation of cardiac LDs from CM-Plin5 mice may involve the phosphorylation of LD proteins distinct from Plin5. To examine the specific impact of PKA incubation on Plin5 barrier function, we pursued a cell culture approach. We transfected COS-7 cells with Plin1, Plin2, or Plin5 and as control LacZ, and we analyzed the PKA-induced FA release from LD preparations. Immunoblot analysis confirmed that LDs isolated from transfected COS-7 cells contained similar quantities of the respective recombinant proteins (Fig. 4a). First, we measured FA release of LDs prepared from LacZ-transfected COS-7 cells when incubated with lysates containing ATGL, ATGL/CGI-58, HSL, or as control LacZ and in the absence or presence of PKA. As shown in Fig. 4b, PKA incubation exclusively increased (1.4-fold) FA release in the presence of HSL, which is in accordance with the established role of HSL as a PKA target. In contrast, and as reported previously (26), lipase-mediated FA release was substantially reduced from Plin5-enriched LDs. Notably, PKA incubation fully restored lipolysis from Plin5-enriched LDs (Fig. 4c) leading to a 4.8- and 2.7-fold raise in FA release in the presence of ATGL/CGI-58 and HSL, respectively. This finding demonstrates that the presence of PKA abolishes the Plin5 lipolytic barrier. Several studies have shown that Plin1 interacts with the ATGL co-activator CGI-58 under basal conditions, followed by the release of CGI-58 upon β-adrenergic stimulation thereby allowing CGI-58 to stimulate ATGL-mediated TG hydrolysis (12, 13, 21, 33). To validate our in vitro approach, we measured the impact of PKA incubation on FA release of LDs prepared from Plin1-transfected COS-7 cells. PKA incubation significantly increased the release of FAs from Plin1-enriched LDs in the presence of ATGL/CGI-58 or HSL (1.7- and 2.2-fold) (Fig. 4d) in line with the concept that phosphorylated Plin1 stimulates ATGL- and HSL-mediated lipolysis.
FIGURE 4.

Plin5 barrier function is under regulation of PKA. LDs were prepared from COS-7 cells transfected with Plin1-, Plin2-, Plin5-, and Plin5S155A and as control LacZ. Transfected cells were loaded with oleic acid and 3H-labeled oleic acid as tracer prior to LD isolation. a, immunoblot analysis of the LD fractions showing expression of the respective perilipin protein family member (10 μg of protein was loaded per lane). b–f, LD preparations were incubated with LacZ, ATGL, ATGL, and CGI-58 or HSL-containing COS-7 cell lysates and the release of 3H-labeled FAs was measured from control LDs (b), LDs enriched with Plin5 (c), Plin1 (d), Plin2 (e), or Plin5S155A (f). Data are mean ± S.D. of n = 3. *, p < 0.05; **, p < 0.01, and ***, p < 0.001 versus LacZ control, and ##, p < 0.01, and ###, p < 0.001 versus substrate without PKA.
Similar to Plin5, overexpression of Plin2 leads to TG accumulation, whereas Plin2 deficiency decreases TG deposition (34–36), which prompted us to examine the impact of PKA on FA release from Plin2-enriched LDs. In contrast to Plin5, addition of PKA had virtually no effect on FA release of Plin2-enriched LDs (Fig. 4e) supporting the concept that Plin5 but not Plin2 is regulated by PKA.
Next, we asked which PKA phosphorylation site(s) of Plin5 may be involved in the regulation of lipolysis. A Plin5 amino acid sequence analysis revealed a potential PKA phosphorylation site at amino acid positions 152–155 (consisting of RRWS). To examine the functional role of this potential PKA phosphorylation sequence, we replaced serine 155 by an alanine (Plin5S155A) and examined the impact of this mutation on the PKA regulation of Plin5. LDs either prepared from COS-7 cells transfected with an expression vector encoding WT Plin5 or Plin5S155A showed a very similar impairment in lipase-mediated FA release in the absence of PKA (Fig. 4f). Addition of PKA markedly stimulated FA release from LDs enriched with WT Plin5 in the presence of ATGL (5.5-fold), ATGL/CGI-58 (6.8-fold), and HSL (2.1-fold). In strong contrast, addition of PKA only moderately induced FA release from Plin5S155A-enriched LDs (2.0-, 1.6-, and 1.7-fold in the presence of ATGL, ATGL/CGI-58, and HSL, respectively) suggesting that serine 155 of Plin5 protein plays a critical role in the PKA-mediated regulation of Plin5 function.
Plin5 Overexpression Reduces Cardiac FAO Capacity but Increases Mitochondrial Number
It has been reported that Plin5 also localizes to the surface of mitochondria and that Plin5 overexpression promotes the association of LDs and mitochondria (37, 38), which may link FA generation to mitochondrial FA uptake. Whether Plin5 has a specific impact on mitochondrial function per se has not been tested so far. Given that Plin5 plays such a role, it is feasible that changes in Plin5 protein expression levels may divergently impact mitochondrial function. To address this question, we measured FAO in mitochondria prepared from CM of different CM-Plin5 mouse strains exhibiting low or high overexpression of Plin5 in the heart (designated as CM-Plin5 low and CM-Plin5 high) (Fig. 5a). The release of 14CO2 (Fig. 5b) and 14C-labeled acid-soluble metabolites (Fig. 5c) was significantly reduced in mitochondria prepared from both transgenic lines. Interestingly, the extent of Plin5 overexpression inversely correlated with mitochondrial FAO indicating that Plin5 overexpression in fact interferes with FAO of isolated mitochondria. Impaired cardiac TG breakdown as present in ATGL-deficient or Plin5 transgenic mice (25–27) was accompanied by reduced mRNA expression levels of peroxisome proliferator-activated receptor α target genes, including carnitine palmitoyltransferase-1b (CPT-1b). In line with these studies, we observed decreased CPT-1 protein levels in mitochondria of CM-Plin5 low/high transgenic mice and the degree of reduction in CPT-1 protein expression inversely correlated with cardiac Plin5 expression levels of the Plin5 transgenic mice (Fig. 5d). Next, we determined whether Plin5 overexpression affects mitochondrial content. As shown in Fig. 5e, mitochondrial protein levels from whole hearts were increased (1.9-fold) in CM-Plin5 mice, which was paralleled by a 1.4-fold increase in mitochondrial copy number (Fig. 5f). Increased mitochondrial content in CM-Plin5 mice may be an adaptation to impaired mitochondrial FAO capacity.
FIGURE 5.

Impaired mitochondrial FAO, reduced mitochondrial CPT1 protein levels, and increased mitochondrial copy number in CM of CM-Plin5 mice. a, relative Plin5 mRNA expression in CM of 14-week-old fasted transgenic mice (n = 5–6) derived from a founder with relatively low Plin5 transgene overexpression (designated as CM-Plin5 low) relative to the established CM-Plin5 transgenic line (in this figure designated as CM-Plin5 high). Mitochondrial FAO was analyzed by measuring the generation of 14C-labeled CO2 (b) and acid-soluble metabolites (asm) (c) from mitochondrial preparations derived from 14-week-old fasted WT, CM-Plin5 low, and CM-Plin5 high mice and incubated with 14C-labeled oleic acid (n = 5–6). d, immunoblot and densitometric analysis of cardiac CPT1 protein levels in isolated mitochondria of 14-week-old mice as indicated (n = 3; representative for two individual tissue preparations; 10 μg of protein analyzed per lane). e, total protein content of mitochondria isolated from whole hearts of 14-week-old WT and CM-Plin5 mice (n = 5–6). f, mitochondrial DNA copy number of whole hearts prepared from 12-week-old WT and CM-Plin5 mice (n = 5). Data are shown as mean ± S.D. **, p < 0.01 and ***, p < 0.001 versus WT mice.
Cardiac-specific Plin5 Overexpression Interferes with Glucose Homeostasis
Impaired lipolysis in mice lacking ATGL markedly interfered with systemic glucose homeostasis and cardiac glucose uptake (27). We assessed the impact of cardiac Plin5 overexpression on whole body glucose homeostasis. In glucose tolerance tests, glucose clearance from the circulation was significantly enhanced in 6-h-fasted CM-Plin5 mice when compared with controls (Fig. 6a). To investigate whether increased glucose tolerance was due to increased glucose uptake/utilization, we injected glucose together with [2-3H]DG as a radioactive tracer and quantitated the amount of [2-3H]DGP in several tissues as a measure for glucose utilization. Glucose uptake was increased (2.0-fold) in CM of 6-h-fasted CM-Plin5 mice but not in any of the other tissues investigated (Fig. 6b) suggesting that the increase in glucose clearance of CM-Plin5 mice originates from increased cardiac glucose utilization. Insulin injection led to a comparable glucose clearance in CM-Plin5 mice and WT controls (Fig. 6c), demonstrating no gross changes in whole body insulin sensitivity. Finally, and in accordance with increased cardiac glucose uptake, mRNA expression level of the Glut4 glucose transporter was 1.6-fold increased in CM of transgenic mice compared with WT controls (Fig. 6d). Taken together, Plin5 overexpression interferes with whole body energy homeostasis favoring cardiac glucose utilization at least in fasted CM-Plin5 mice.
FIGURE 6.
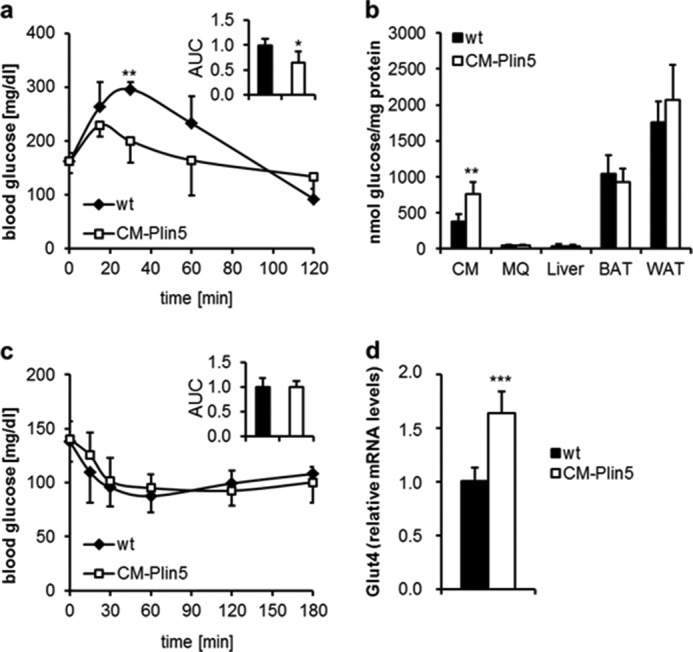
Changes in glucose homeostasis in CM-Plin5 transgenic mice. a, glucose tolerance test of 12-week-old 6-h fasted WT and CM-Plin5 mice (n = 5, normalized area under the curve (AUC)). b, tissue-specific glucose uptake determined in 16-week-old 6-h fasted mice (n = 5) using [2-3H]deoxyglucose as radioactive tracer. c, insulin tolerance test of 14-week-old 4-h fasted mice (n = 5). d, relative mRNA levels of glucose transporter 4 (Glut4) in CM of fasted WT and CM-Plin5 mice, determined by quantitative RT-PCR (n = 6). Data are shown as mean ± S.D. *, p < 0.05; **, p < 0.01 and ***, p < 0.001 versus WT control.
DISCUSSION
The heart is the most energy-consuming organ of the body, mainly utilizing FA and glucose for energy production. Despite this prevalent role in energy homeostasis, only a few studies have investigated the regulation of TG mobilization from cardiomyocyte LDs as compared with the numerous studies on AT lipolysis. A better understanding of the molecular mechanisms regulating cardiac lipolysis may deliver novel therapeutic strategies to interfere with pathological changes in cardiac TG homeostasis as often present in metabolic disorders, including diabetes and obesity.
The role of Plin5 in the regulation of TG homeostasis is particularly evident in mice lacking Plin5 (24), which are virtually devoid of cardiac LDs, whereas heart-specific Plin5 overexpression provokes massive TG accumulation in CM (25, 26). Similar to the heart, Plin5 deficiency also interferes with TG homeostasis in the liver, leading to a reduction in hepatic TG content and LD size (9). In accordance with these findings, Plin5-enriched LDs, either derived from cardiac tissue of CM-Plin5 mice or from COS-7 cells overexpressing recombinant Plin5, were resistant toward TG breakdown in vitro (26) suggesting that Plin5 acts as a lipolytic barrier. Severe cardiac steatosis in CM-Plin5 mice was compatible with normal heart function, whereas defective lipolysis and massive cardiac steatosis in ATGL-deficient mice provoke premature lethal heart dysfunction (27). Consistent with normal heart function of Plin5 transgenic mice (25), we observed no significant impact of cardiac steatosis on life span in our Plin5 transgenic mouse model. These phenotypic divergences indicate that cardiac Plin5 overexpression does not constitutively impair ATGL-mediated TG catabolism.
Overnight fasting of CM-Plin5 mice led to a moderate but untypical reduction in cardiac TG content in CM-Plin5 mice compared with the fasting-mediated increase in cardiac TG deposition in WT mice suggesting that cardiac TG breakdown is not entirely impaired at least in fasted CM-Plin5 mice. In adipocytes, the fasting-mediated increase in lipolysis depends on the rise in endogenous cAMP levels, including PKA-mediated Plin1 phosphorylation and recruitment of cytosolic HSL to the LD moiety (20). In parallel, phosphorylation of Plin1 releases CGI-58 from Plin1 thereby allowing CGI-58 to stimulate the TG hydrolytic activity of ATGL (12–14, 21). Similar to Plin1, CGI-58 is also recruited by Plin5 at the LD surface (19–21), suggesting that Plin5 may exert a similar role in the regulation of lipolysis in non-AT. A very recent study exploring the impact of Plin5 deficiency on hepatic TG metabolism demonstrated that increasing concentrations of Plin5 counteract ATGL and CGI-58 interactions, whereas the absence of Plin5 stimulates lipolysis in the presence of CGI-58 and ATGL (9). These findings further suggest that Plin5 controls lipolysis via recruiting or releasing CGI-58.
It has been demonstrated in vivo and in vitro that Plin5 is a substrate for PKA phosphorylation implicating a role for PKA in the regulation of Plin5 function in response to β-adrenergic stimulation (21–23). Presumably, phosphorylation of Plin5 leads to the release of CGI-58, which is a prerequisite for CGI-58 function as a lipolytic co-activator. So far, specific PKA phosphorylation sites of Plin5 in the context of Plin5-mediated regulation of TG breakdown have not been investigated.
Here, we show that the lipolytic barrier of Plin5-enriched LDs is reduced upon PKA incubation. This abrogation of the lipolytic barrier is most pronounced when CGI-58 and ATGL are present suggesting that PKA incubation triggers the release of CGI-58 from Plin5. Accordingly, PKA treatment strongly stimulates FA release from Plin5-enriched LDs, prepared from Plin5 transgenic mice, indicating that PKA unlocks the Plin5 barrier function thereby promoting TG hydrolysis. In strong contrast, PKA incubation had no effect on ATGL/CGI-58-mediated FA release from control LDs isolated from LacZ-transfected COS-7 cells demonstrating that PKA incubation per se does not affect ATGL/CGI-58-mediated FA release. These findings are in line with a previous study showing that ATGL's TG hydrolytic activity is not under direct PKA regulation (39). In silico, amino acid sequence analysis revealed a single PKA phosphorylation sequence motif in Plin5 protein, consisting of serine 155. Remarkably, the exchange of serine 155 with an alanine codon (Plin5S155A) in the predicted PKA phosphorylation motif strongly changed the characteristic of Plin5-enriched LDs. In contrast to the strong increase in FA release from LDs enriched with WT Plin5 upon PKA incubation, FA release was markedly blunted from LDs enriched with the Plin5S155A mutant in response to PKA incubation. These findings suggest that Plin5 controls lipolysis in a very similar mechanism in oxidative tissues as compared with that of Plin1 in AT. The fasting-induced rise in cellular cAMP levels activates PKA, which in turn phosphorylates serine 155 of Plin5 at the LD thereby releasing CGI-58 from Plin5 binding, which is then available for co-activation of ATGL (Fig. 7a).
FIGURE 7.
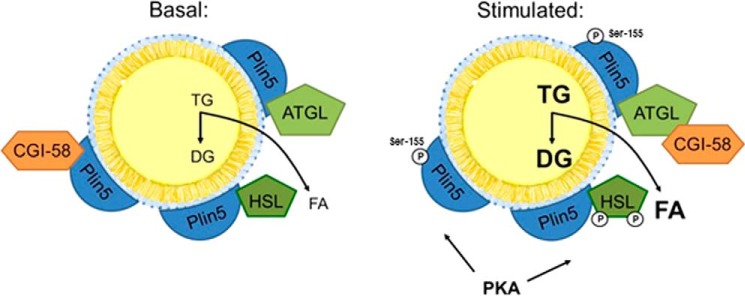
Proposed scheme depicting the impact of PKA phosphorylation of Plin5 on the regulation of TG breakdown from Plin5-containing LDs. In the nonfasted state, Plin5 recruits and binds CGI-58. Upon fasting and the concomitant rise in cAMP, active PKA phosphorylates Plin5, leading to the release of CGI-58 from Plin5, a prerequisite required for the CGI-58-mediated stimulation of the TG hydrolytic activity of ATGL. Results from this study strongly suggest that PKA phosphorylation of Plin5 at serine 155 triggers the release of CGI-58 from Plin5 binding.
Also for Plin2, a barrier function comparable with that of Plin5 has been demonstrated in overexpression or knockdown models (24, 34–36). Furthermore, the study by Yamaguchi et al. (14) identified Plin2 as a potential interacting partner of CGI-58, suggesting that Plin2 may have an impact on CGI-58-mediated stimulation of ATGL activity. In strong contrast to Plin5, however, we found that Plin2-enriched LDs efficiently released FAs in the presence of ATGL, ATGL/CGI-58, and HSL, which was independent of PKA. This demonstrates that Plin5 but not Plin2 exerts a critical and specific role in PKA regulation of LD barrier function.
The strong overexpression of Plin5 in CM of our transgenic mouse model may additionally interfere with mitochondrial function beyond its direct impact on lipolysis and the supply of FAs as oxidative fuel. Interestingly, the extent of Plin5 overexpression inversely correlated with mitochondrial FAO suggesting that Plin5 overexpression might additionally impact mitochondrial function in a lipolysis-independent manner. Notably, protein expression level of mitochondrial CPT-1 inversely correlated with the extent of Plin5 overexpression suggesting that the effect on mitochondrial FAO was rather due to changes in mitochondrial CPT-1 expression, because CPT-1 limits mitochondrial FA uptake. Furthermore, impaired lipolysis was shown to lower cardiac peroxisome proliferator-activated receptor α target gene expression in ATGL-deficient mice, which was also found in mice with cardiac Plin5 overexpression (8, 25, 26). From these observations, we conclude that increased or decreased CPT-1 expression levels in mice exhibiting low or high Plin5 expression in CM, respectively, are linked to the degree of Plin5 inhibition of lipolysis and the availability of FAs for β-oxidation.
TG breakdown in cardiomyocytes significantly contributes to FA supply as oxidative fuel (7, 8), and it has been found that impaired cardiac lipolysis leads to lower FA and enhanced glucose oxidation (32). Similarly, also in this study, glucose uptake was increased in cardiac tissue of CM-Plin5 mice, which was paralleled by reduced mitochondrial FAO. In contrast to the strong 6.7-fold increase in cardiac glucose uptake in mice lacking CGI-58 in cardiac (and skeletal) muscle (32), the impact of Plin5 overexpression on cardiac glucose uptake was relatively mild (2.0-fold increased) further supporting our conclusion that the Plin5 barrier function is regulated by the nutritional state and PKA, respectively. Whether the increase in mitochondria number observed in cardiac tissue of Plin5 mice can compensate for the reduced mitochondrial FAO capacity requires further investigation.
To summarize, our study provides several lines of evidence that PKA phosphorylation of Plin5 plays a critical role in the regulation of cardiac lipolysis and energy metabolism. Data suggest that Plin5 overexpression primarily impacts cardiac energy metabolism via regulating ATGL- and HSL-mediated cardiac TG breakdown. The increase in cardiac PKA expression level may partially compensate for reduced cardiac lipolysis in CM-Plin5 transgenic mice, which is compatible with normal heart function and life span despite severe fat accumulation in the heart.
This work was supported by the Austrian Ministry for Science and Research grants, Fonds zur Förderung der Wissenschaftlichen Forschung Project DK-MCD W1226 and P20602-B05, Austrian Science Fund (Fonds zur Förderung der Wissenschaftlichen Forschung), and Special Research Program Lipotox F30-B05.
This article was selected as a Paper of the Week.
- LD
- lipid droplet
- TG
- triglyceride
- AT
- adipose tissue
- ATGL
- adipose triglyceride lipase
- Plin5
- perilipin 5
- HSL
- hormone-sensitive lipase
- FA
- fatty acid
- CGI-58
- comparative gene identification-58
- Plin1
- perilipin 1
- CM
- cardiac muscle
- DG
- deoxyglucose
- DGP
- 2-deoxyglucose 6-phosphate
- FAO
- FA oxidation.
REFERENCES
- 1. Bickel P. E., Tansey J. T., Welte M. A. (2009) PAT proteins, an ancient family of lipid droplet proteins that regulate cellular lipid stores. Biochim. Biophys. Acta 1791, 419–440 [DOI] [PMC free article] [PubMed] [Google Scholar]
- 2. Kühnlein R. P. (2012) Thematic review series: Lipid droplet synthesis and metabolism: from yeast to man. Lipid droplet-based storage fat metabolism in Drosophila. J. Lipid Res. 53, 1430–1436 [DOI] [PMC free article] [PubMed] [Google Scholar]
- 3. Brasaemle D. L. (2007) Thematic review series: adipocyte biology. The perilipin family of structural lipid droplet proteins: stabilization of lipid droplets and control of lipolysis. J. Lipid Res. 48, 2547–2559 [DOI] [PubMed] [Google Scholar]
- 4. Konige M., Wang H., Sztalryd C. (2014) Role of adipose-specific lipid droplet proteins in maintaining whole body energy homeostasis. Biochim. Biophys. Acta 1842, 393–401 [DOI] [PMC free article] [PubMed] [Google Scholar]
- 5. Zechner R., Zimmermann R., Eichmann T. O., Kohlwein S. D., Haemmerle G., Lass A., Madeo F. (2012) Fat signals–lipases and lipolysis in lipid metabolism and signaling. Cell Metab. 15, 279–291 [DOI] [PMC free article] [PubMed] [Google Scholar]
- 6. Schaffer J. E. (2003) Lipotoxicity: when tissues overeat. Curr. Opin. Lipidol. 14, 281–287 [DOI] [PubMed] [Google Scholar]
- 7. Banke N. H., Wende A. R., Leone T. C., O'Donnell J. M., Abel E. D., Kelly D. P., Lewandowski E. D. (2010) Preferential oxidation of triacylglyceride-derived fatty acids in heart is augmented by the nuclear receptor PPARα. Circ. Res. 107, 233–241 [DOI] [PMC free article] [PubMed] [Google Scholar]
- 8. Haemmerle G., Moustafa T., Woelkart G., Büttner S., Schmidt A., van de Weijer T., Hesselink M., Jaeger D., Kienesberger P. C., Zierler K., Schreiber R., Eichmann T., Kolb D., Kotzbeck P., Schweiger M., Kumari M., Eder S., Schoiswohl G., Wongsiriroj N., Pollak N. M., Radner F. P., Preiss-Landl K., Kolbe T., Rülicke T., Pieske B., Trauner M., Lass A., Zimmermann R., Hoefler G., Cinti S., Kershaw E. E., Schrauwen P., Madeo F., Mayer B., Zechner R. (2011) ATGL-mediated fat catabolism regulates cardiac mitochondrial function via PPAR-α and PGC-1. Nat. Med. 17, 1076–1085 [DOI] [PMC free article] [PubMed] [Google Scholar]
- 9. Wang C., Zhao Y., Gao X., Li L., Yuan Y., Liu F., Zhang L., Wu J., Hu P., Zhang X., Gu Y., Xu Y., Li Z., Zhang H., Ye J. (2014) Perilipin 5 improves hepatic lipotoxicity by inhibiting lipolysis. Hepatology 10.1002/hep.27409 [DOI] [PubMed] [Google Scholar]
- 10. Egan J. J., Greenberg A. S., Chang M. K., Londos C. (1990) Control of endogenous phosphorylation of the major cAMP-dependent protein kinase substrate in adipocytes by insulin and β-adrenergic stimulation. J. Biol. Chem. 265, 18769–18775 [PubMed] [Google Scholar]
- 11. Miyoshi H., Perfield J. W., 2nd, Souza S. C., Shen W.-J., Zhang H.-H., Stancheva Z. S., Kraemer F. B., Obin M. S., Greenberg A. S. (2007) Control of adipose triglyceride lipase action by serine 517 of perilipin A globally regulates protein kinase A-stimulated lipolysis in adipocytes. J. Biol. Chem. 282, 996–1002 [DOI] [PubMed] [Google Scholar]
- 12. Granneman J. G., Moore H.-P., Krishnamoorthy R., Rathod M. (2009) Perilipin controls lipolysis by regulating the interactions of AB-hydrolase containing 5 (Abhd5) and adipose triglyceride lipase (Atgl). J. Biol. Chem. 284, 34538–34544 [DOI] [PMC free article] [PubMed] [Google Scholar]
- 13. Subramanian V., Rothenberg A., Gomez C., Cohen A. W., Garcia A., Bhattacharyya S., Shapiro L., Dolios G., Wang R., Lisanti M. P., Brasaemle D. L. (2004) Perilipin A mediates the reversible binding of CGI-58 to lipid droplets in 3T3-L1 adipocytes. J. Biol. Chem. 279, 42062–42071 [DOI] [PubMed] [Google Scholar]
- 14. Yamaguchi T., Omatsu N., Matsushita S., Osumi T. (2004) CGI-58 interacts with perilipin and is localized to lipid droplets. Possible involvement of CGI-58 mislocalization in Chanarin-Dorfman syndrome. J. Biol. Chem. 279, 30490–30497 [DOI] [PubMed] [Google Scholar]
- 15. Kimmel A. R., Sztalryd C. (2014) Perilipin 5, a lipid droplet protein adapted to mitochondrial energy utilization. Curr. Opin. Lipidol. 25, 110–117 [DOI] [PMC free article] [PubMed] [Google Scholar]
- 16. Wolins N. E., Quaynor B. K., Skinner J. R., Tzekov A., Croce M. A., Gropler M. C., Varma V., Yao-Borengasser A., Rasouli N., Kern P. A., Finck B. N., Bickel P. E. (2006) OXPAT/PAT-1 is a PPAR-induced lipid droplet protein that promotes fatty acid utilization. Diabetes 55, 3418–3428 [DOI] [PubMed] [Google Scholar]
- 17. Yamaguchi T., Matsushita S., Motojima K., Hirose F., Osumi T. (2006) MLDP, a novel PAT family protein localized to lipid droplets and enriched in the heart, is regulated by peroxisome proliferator-activated receptor α. J. Biol. Chem. 281, 14232–14240 [DOI] [PubMed] [Google Scholar]
- 18. Dalen K. T., Dahl T., Holter E., Arntsen B., Londos C., Sztalryd C., Nebb H. I. (2007) LSDP5 is a PAT protein specifically expressed in fatty acid oxidizing tissues. Biochim. Biophys. Acta 1771, 210–227 [DOI] [PubMed] [Google Scholar]
- 19. Granneman J. G., Moore H.-P., Mottillo E. P., Zhu Z. (2009) Functional interactions between Mldp (LSDP5) and Abhd5 in the control of intracellular lipid accumulation. J. Biol. Chem. 284, 3049–3057 [DOI] [PMC free article] [PubMed] [Google Scholar]
- 20. Wang H., Hu L., Dalen K., Dorward H., Marcinkiewicz A., Russell D., Gong D., Londos C., Yamaguchi T., Holm C., Rizzo M. A., Brasaemle D., Sztalryd C. (2009) Activation of hormone-sensitive lipase requires two steps, protein phosphorylation and binding to the PAT-1 domain of lipid droplet coat proteins. J. Biol. Chem. 284, 32116–32125 [DOI] [PMC free article] [PubMed] [Google Scholar]
- 21. Wang H., Bell M., Sreenivasan U., Sreenevasan U., Hu H., Liu J., Dalen K., Londos C., Yamaguchi T., Rizzo M. A., Coleman R., Gong D., Brasaemle D., Sztalryd C. (2011) Unique regulation of adipose triglyceride lipase (ATGL) by perilipin 5, a lipid droplet-associated protein. J. Biol. Chem. 286, 15707–15715 [DOI] [PMC free article] [PubMed] [Google Scholar]
- 22. Macpherson R. E., Vandenboom R., Roy B. D., Peters S. J. (2013) Skeletal muscle PLIN3 and PLIN5 are serine phosphorylated at rest and following lipolysis during adrenergic or contractile stimulation. Physiol. Rep. 1, e00084. [DOI] [PMC free article] [PubMed] [Google Scholar]
- 23. Mason R. R., Mokhtar R., Matzaris M., Selathurai A., Kowalski G. M., Mokbel N., Meikle P. J., Bruce C. R., Watt M. J. (2014) PLIN5 deletion remodels intracellular lipid composition and causes insulin resistance in muscle. Mol. Metab. 3, 652–663 [DOI] [PMC free article] [PubMed] [Google Scholar]
- 24. Kuramoto K., Okamura T., Yamaguchi T., Nakamura T. Y., Wakabayashi S., Morinaga H., Nomura M., Yanase T., Otsu K., Usuda N., Matsumura S., Inoue K., Fushiki T., Kojima Y., Hashimoto T., Sakai F., Hirose F., Osumi T. (2012) Perilipin 5, a lipid droplet-binding protein, protects heart from oxidative burden by sequestering fatty acid from excessive oxidation. J. Biol. Chem. 287, 23852–23863 [DOI] [PMC free article] [PubMed] [Google Scholar]
- 25. Wang H., Sreenivasan U., Gong D.-W., O'Connell K. A., Dabkowski E. R., Hecker P. A., Ionica N., Konig M., Mahurkar A., Sun Y., Stanley W. C., Sztalryd C. (2013) Cardiomyocyte-specific perilipin 5 overexpression leads to myocardial steatosis and modest cardiac dysfunction. J. Lipid Res. 54, 953–965 [DOI] [PMC free article] [PubMed] [Google Scholar]
- 26. Pollak N. M., Schweiger M., Jaeger D., Kolb D., Kumari M., Schreiber R., Kolleritsch S., Markolin P., Grabner G. F., Heier C., Zierler K. A., Rülicke T., Zimmermann R., Lass A., Zechner R., Haemmerle G. (2013) Cardiac-specific overexpression of perilipin 5 provokes severe cardiac steatosis via the formation of a lipolytic barrier. J. Lipid Res. 54, 1092–1102 [DOI] [PMC free article] [PubMed] [Google Scholar]
- 27. Haemmerle G., Lass A., Zimmermann R., Gorkiewicz G., Meyer C., Rozman J., Heldmaier G., Maier R., Theussl C., Eder S., Kratky D., Wagner E. F., Klingenspor M., Hoefler G., Zechner R. (2006) Defective lipolysis and altered energy metabolism in mice lacking adipose triglyceride lipase. Science 312, 734–737 [DOI] [PubMed] [Google Scholar]
- 28. Folch J., Lees M., Sloane Stanley G. H. (1957) A simple method for the isolation and purification of total lipids from animal tissues. J. Biol. Chem. 226, 497–509 [PubMed] [Google Scholar]
- 29. Lass A., Zimmermann R., Haemmerle G., Riederer M., Schoiswohl G., Schweiger M., Kienesberger P., Strauss J. G., Gorkiewicz G., Zechner R. (2006) Adipose triglyceride lipase-mediated lipolysis of cellular fat stores is activated by CGI-58 and defective in Chanarin-Dorfman syndrome. Cell Metab. 3, 309–319 [DOI] [PubMed] [Google Scholar]
- 30. Hirschey M. D., Shimazu T., Goetzman E., Jing E., Schwer B., Lombard D. B., Grueter C. A., Harris C., Biddinger S., Ilkayeva O. R., Stevens R. D., Li Y., Saha A. K., Ruderman N. B., Bain J. R., Newgard C. B., Farese R. V., Jr., Alt F. W., Kahn C. R., Verdin E. (2010) SIRT3 regulates mitochondrial fatty-acid oxidation by reversible enzyme deacetylation. Nature 464, 121–125 [DOI] [PMC free article] [PubMed] [Google Scholar]
- 31. Amthor H., Macharia R., Navarrete R., Schuelke M., Brown S. C., Otto A., Voit T., Muntoni F., Vrbóva G., Partridge T., Zammit P., Bunger L., Patel K. (2007) Lack of myostatin results in excessive muscle growth but impaired force generation. Proc. Natl. Acad. Sci. U.S.A. 104, 1835–1840 [DOI] [PMC free article] [PubMed] [Google Scholar]
- 32. Zierler K. A., Jaeger D., Pollak N. M., Eder S., Rechberger G. N., Radner F. P., Woelkart G., Kolb D., Schmidt A., Kumari M., Preiss-Landl K., Pieske B., Mayer B., Zimmermann R., Lass A., Zechner R., Haemmerle G. (2013) Functional cardiac lipolysis in mice critically depends on comparative gene identification-58. J. Biol. Chem. 288, 9892–9904 [DOI] [PMC free article] [PubMed] [Google Scholar]
- 33. Yamaguchi T., Omatsu N., Omukae A., Osumi T. (2006) Analysis of interaction partners for perilipin and ADRP on lipid droplets. Mol. Cell. Biochem. 284, 167–173 [DOI] [PubMed] [Google Scholar]
- 34. Chang B. H., Li L., Paul A., Taniguchi S., Nannegari V., Heird W. C., Chan L. (2006) Protection against fatty liver but normal adipogenesis in mice lacking adipose differentiation-related protein. Mol. Cell. Biol. 26, 1063–1076 [DOI] [PMC free article] [PubMed] [Google Scholar]
- 35. Bosma M., Hesselink M. K., Sparks L. M., Timmers S., Ferraz M. J., Mattijssen F., van Beurden D., Schaart G., de Baets M. H., Verheyen F. K., Kersten S., Schrauwen P. (2012) Perilipin 2 improves insulin sensitivity in skeletal muscle despite elevated intramuscular lipid levels. Diabetes 61, 2679–2690 [DOI] [PMC free article] [PubMed] [Google Scholar]
- 36. McManaman J. L., Bales E. S., Orlicky D. J., Jackman M., MacLean P. S., Cain S., Crunk A. E., Mansur A., Graham C. E., Bowman T. A., Greenberg A. S. (2013) Perilipin-2-null mice are protected against diet-induced obesity, adipose inflammation, and fatty liver disease. J. Lipid Res. 54, 1346–1359 [DOI] [PMC free article] [PubMed] [Google Scholar]
- 37. Wang H., Sreenivasan U., Sreenevasan U., Hu H., Saladino A., Polster B. M., Lund L. M., Gong D. W., Stanley W. C., Sztalryd C. (2011) Perilipin 5, a lipid droplet-associated protein, provides physical and metabolic linkage to mitochondria. J. Lipid Res. 52, 2159–2168 [DOI] [PMC free article] [PubMed] [Google Scholar]
- 38. Bosma M., Minnaard R., Sparks L. M., Schaart G., Losen M., de Baets M. H., Duimel H., Kersten S., Bickel P. E., Schrauwen P., Hesselink M. K. (2012) The lipid droplet coat protein perilipin 5 also localizes to muscle mitochondria. Histochem. Cell Biol. 137, 205–216 [DOI] [PMC free article] [PubMed] [Google Scholar]
- 39. Zimmermann R., Strauss J. G., Haemmerle G., Schoiswohl G., Birner-Gruenberger R., Riederer M., Lass A., Neuberger G., Eisenhaber F., Hermetter A., Zechner R. (2004) Fat mobilization in adipose tissue is promoted by adipose triglyceride lipase. Science 306, 1383–1386 [DOI] [PubMed] [Google Scholar]