

Background: C3larvin toxin from P. larvae modifies RhoA protein through its ADP-ribosyltransferase activity.
Results: The crystal structure of C3larvin reveals that it is a single domain toxin/enzyme in the C3 subclass.
Conclusion: A lead inhibitor of the ADP-ribosyltransferase activity has been developed.
Significance: C3larvin may be an important virulence factor in P. larvae pathogenesis.
Keywords: ADP-ribosylation, Bacterial Toxin, Bioinformatics, Enzyme Kinetics, Fluorescence, X-ray Crystallography, ADP-ribosyltransferase Inhibitor, C3 Toxins
Abstract
C3larvin toxin was identified by a bioinformatic strategy as a putative mono-ADP-ribosyltransferase and a possible virulence factor from Paenibacillus larvae, which is the causative agent of American Foulbrood in honey bees. C3larvin targets RhoA as a substrate for its transferase reaction, and kinetics for both the NAD+ (Km = 34 ± 12 μm) and RhoA (Km = 17 ± 3 μm) substrates were characterized for this enzyme from the mono-ADP-ribosyltransferase C3 toxin subgroup. C3larvin is toxic to yeast when expressed in the cytoplasm, and catalytic variants of the enzyme lost the ability to kill the yeast host, indicating that the toxin exerts its lethality through its enzyme activity. A small molecule inhibitor of C3larvin enzymatic activity was discovered called M3 (Ki = 11 ± 2 μm), and to our knowledge, is the first inhibitor of transferase activity of the C3 toxin family. C3larvin was crystallized, and its crystal structure (apoenzyme) was solved to 2.3 Å resolution. C3larvin was also shown to have a different mechanism of cell entry from other C3 toxins.
Introduction
Mono-ADP-ribosyltransferase (mART)2 toxins are a class of protein exotoxins that act by removing an ADP-ribose group from NAD+ and covalently attaching it to a protein target (usually) within a cell (1). Examples of mART toxins include exotoxin A, a major virulence factor in Pseudomonas aeruginosa, cholera toxin from Vibrio cholerae, diphtheria toxin from Corynebacterium diphtheriae, and pertussis toxin from Bordetella pertussis (2, 3). Several different amino acid residues are targets, including cysteine, arginine, asparagine, and diphthamide (a modified histidine residue) (4). Along with various potential target residues, mART toxins act on a variety of different proteins within cells, including actin, elongation factor-2, and RhoA (4). In addition to protein targets for transferase activity, many mART toxins have glycohydrolase (GH) activity, in which water is the acceptor for the ADP-ribose group; however, the GH activity is much slower than the transferase activity (5).
Paenibacillus larvae is a Gram-positive, spore-forming bacterium that can be transmitted within and between colonies (6). The only effective method for controlling an infected colony is burning the hive and associated equipment (6). Adult bees can act as carriers for the spores and then infect the larval food with these spores. As few as 10 spores can cause infection, and an infected individual can release millions of spores to further infect the colony (6). P. larvae has also been shown to be capable of infection in humans, although cases have proven to be rare (7).
In silico analysis has revealed a putative novel mART toxin, which we have named C3larvin (Uniprot: W2E3J5), in the P. larvae subsp. larvae BRL-230010. C3larvin is a single-domain toxin with 190 residues and is 22 kDa, PI = 9.62, and it does not possess a secretion signal peptide. We have cloned, purified, and characterized this enzyme to show that it is a mART toxin with both GH and transferase activities. C3larvin toxin expression in yeast, driven by the CupI promoter, shows cell death in the presence of the wild-type toxin. We have solved the crystal structure of C3larvin to 2.30 Å and show that it is a member of the C3 mART subgroup (4). It also shows a strong similarity with the C3 toxin subgroup by multiple-sequence alignment, and the likely physiological target is the Rho protein family (8). We characterized the GH and ADP-ribosyltransferase activities defining its Michaelis-Menten kinetic parameters. We conducted a virtual screen for small molecule inhibitors using ι-toxin as the target. The best compounds arising from the screen were then tested against C3larvin transferase activity, and one compound was identified as a good lead inhibitor, to our knowledge, the first reported inhibitor of the C3 toxin subclass.
EXPERIMENTAL PROCEDURES
Unless otherwise noted, chemicals were purchased from Sigma-Aldrich.
C3larvin Expression and Purification
The C3larvin gene was overexpressed in Escherichia coli BL21 λDE3 cells, and C3larvin was purified from the soluble fraction of the lysed cells. The C3larvin gene was cloned into a pET-28+ vector with an N-terminal His6 tag and a tobacco etch virus protease cut site. The plasmid was used to transform chemically competent E. coli BL21 λDE3 cells. Cells were grown in 4 liters of 2×YT broth to an A600 of 0.6 at 37 °C in the presence of kanamycin. Upon reaching this OD, the temperature was decreased to 16 °C, and 1 mm isopropyl β-d-1-thiogalactopyranoside was added. Cells were grown for a further 16 h, at which point they were harvested by centrifugation at 4000 × g for 15 min.
The pelleted cells were resuspended in lysis buffer containing 50 mm Tris, pH 7.5, and 500 mm NaCl and lysed using an Emulsiflex-C3 high pressure homogenizer (Avestin Inc., Ottawa, Canada). The lysed cells were centrifuged for 50 min at 14,000 × g. The supernatant was passed over a 5-ml HiTrap chelating Sepharose fast flow column (GE Healthcare) charged with Ni2+ and equilibrated with lysis buffer containing 5 mm imidazole. The protein was first washed with lysis buffer containing 5 mm imidazole and then with lysis buffer containing 75 mm imidazole, and finally it was eluted with lysis buffer containing 250 mm imidazole.
Further purification was performed using a HiLoad 16/60 Superdex 200 column (GE Healthcare) for size exclusion chromatography. Gel filtration buffer was the same as lysis buffer.
C3larvin purification for crystallography was performed as described above, with the exception that 150 mm NaCl rather than 500 mm was used in buffers. For assays where C3larvin was used with the His6 tag removed, a digestion with tobacco etch virus protease was conducted at room temperature for 2 h and then 16 h at 4 °C. For every mg of C3larvin, the digestion reaction contained 0.1 mg of tobacco etch virus in a buffer containing 500 μm EDTA and 1 mm DTT.
C3larvin Chimera
The C3larvin chimera was prepared by designing a construct that encoded the addition of the N-terminal portion of C3bot1 (Tyr2–Trp19) immediately following the Met1 residue in C3larvin. This resulted in an extension of helix 1 in C3larvin to closely match the same helix in C3bot1. This protein was then purified as C3larvin above but without the gel filtration step.
C3bot1 and C3lim Purification
C3bot1 in pGEX2TGL plasmid was received as a gift from Thomas Jankra (Albert-Ludwigs-Universität Freiburg). This vector contains an N-terminal glutathione-S-transferase (GST) followed by a thrombin cut site to allow for removal of the GST tag. This was used to transform E. coli BL21 λDE3 cells, which were grown overnight and plated onto 2×YT agar plates containing 100 μg/ml ampicillin. Colonies were scraped into 50 ml of LB broth containing ampicillin and grown for 1 h at 37 °C. Then 50 ml of culture was used to inoculate 2 liters of 2×YT, which was grown to an A600 of 0.6. This culture was induced with 1 mm isopropyl β-d-1-thiogalactopyranoside and grown for an additional 3 h before centrifugation at 4000 × g for 15 min.
C3bot1 pellets were resuspended in 20 mm Tris, pH 7.5, 10 mm NaCl, and 5 mm MgCl2. The cells were lysed using an Emulsiflex-C3 homogenizer, with 1 mm phenylmethylsulfonyl fluoride (PMSF) added before lysis. After lysis was completed, the lysed cells were spun at 14,000 × g for 50 min, and the supernatant was passed over a glutathione-agarose column previously equilibrated with buffer A (20 mm Tris, pH 7.5, 500 mm NaCl, 0.1% Tween). The column was washed with 10 column volumes of buffer A, and the C3bot1-GST was eluted with 20 ml of buffer B (20 mm Tris, pH 7.5, 150 mm NaCl, 0.1% Tween, 20 mm reduced glutathione). The eluted protein was dialyzed for 16 h at 4 °C in 2 liters of buffer B without glutathione.
The GST tag on C3bot1 was cleaved from the protein using 1 unit of thrombin for each mg of protein, and 5 mm CaCl2 (final concentration) was also present in the reaction. The digestion was left at room temperature on a rotator for 8 h and then at 4 °C for another 16 h. The cleaved GST tag was removed by passage through a glutathione-agarose column equilibrated with buffer B without glutathione, and the flow-through was collected and concentrated. C3lim was purified in an identical manner to C3bot1.
RhoA Purification
Human GST-RhoA (ΔCAAX) plasmid was obtained as a gift from Dr. Joseph Barbieri (Medical College of Wisconsin). GST-RhoA (ΔCAAX) in E. coli TG1 was plated onto 2×YT agar plates containing 30 μg/ml kanamycin. Cells were grown to an A600 of 0.6 at 37 °C. The temperature was lowered to 27 °C, and the cultures were induced with 1 mm isopropyl β-d-1-thiogalactopyranoside for 16 h. The cells were then harvested and lysed as described previously for C3larvin using a lysis buffer of 10 mm HEPES, pH 7.5, 150 mm NaCl, 2.5 mm MgCl2, and 1 mm DTT. Prior to lysis, 1 mg of DNase was added.
After lysis and centrifugation, the supernatant was passed three times over a glutathione-agarose resin column equilibrated with lysis buffer. The column was washed with 10 column volumes of lysis buffer, and the protein was eluted with 5 column volumes of lysis buffer containing 10 mm reduced glutathione. The elution was dialyzed into 1 liter of lysis buffer overnight to remove glutathione.
Protein Crystallography
C3larvin was screened for crystallization conditions using the Red Wing screen (Structural Genomics Consortium, Toronto) in 96-well screening trays, using several different concentrations of C3larvin. Initial hits appeared after 1 month in a well containing 30% PEG 4000, 200 mm sodium acetate, and 100 mm Tris, pH 8.5.
Crystallization conditions were further optimized, and C3larvin was crystallized in 18-mm hanging drop trays with 200 μl of well solution containing 28% PEG 4000, 200 mm sodium acetate, and 100 mm Tris, pH 8.5. One μl of this solution was mixed with 1 μl of 18 mg/ml C3larvin on the cover slide to form the crystal drop. The trays were incubated at room temperature, and crystals would generally appear after 2–3 weeks. This process could be accelerated by seeding with a crushed crystal mixture, enabling point crystals to appear in 1–2 days. Crystals were immersed in Paratone-N oil to remove surface liquid, and crystals were then flash-frozen in liquid nitrogen.
Crystals were sent to the Canadian Light Source at the Canadian Macromolecular Crystallography Facility (08ID-1) for x-ray diffraction data collection. The data were processed in XDS (9). Molecular replacement on the crystal data set was conducted using the MR-Rosetta tool in Phenix (10). The search model was based on C3bot1 (with non-conserved residues truncated to residue 67; PDB entry 1G24). Iterative cycles of model building in COOT (11) and refinement in Phenix were performed. Table 1 shows the refinement statistics for the C3larvin structure.
TABLE 1.
Crystallographic data and refinement statistics for P. larvae C3larvin toxin
| Sample | C3larvin |
|---|---|
| Diffraction data | |
| PDB code | 4TR5 |
| X-ray source | CLS beamline 08ID |
| Wavelength (Å) | 0.9762 |
| Unit cell parameters(Å) | a = 55.85 |
| b = 55.85 | |
| c = 120.88 | |
| Space group | P412121 |
| Resolution range (Å) | 41–2.30 (2.382–2.3)a |
| Data completeness (%) | 99.98 (99.89) |
| Rmerge (%) | 6.2 (5.49) |
| Redundancy | 9.3 (9.5) |
| Average I/σ(I) | 25.83 (5.86) |
| Refinement statistics | |
| Molecular replacement program | PHASER |
| Molecular replacement model | C3bot1 (PDB code 1G24) |
| Rwork (%)b/Rfree (%)c | 18.7/22.5 (25.25/29.98) |
| No. of atoms | |
| Non-bonded hydrogen atoms | 1681 |
| Protein | 1640 |
| Water | 41 |
| Root mean square deviation from ideal | |
| Bond length (Å) | 0.005 |
| Bond angles (degrees) | 0.87 |
| B-factors (Å2) | 45.90 |
| Wilson | 36.49 |
| Ramachandran plot (%) | |
| Favored | 99 |
| Outliers | 0.0 |
a Statistics for the highest resolution shell are shown in parentheses.
b Σ‖Fo| − |Fc‖ Σ|Fo|, where |Fo| and |Fc| are the observed and calculated structure factor amplitudes, respectively.
c The Rfree value was calculated with a random 5% subset of all reflections excluded from refinement.
NAD+ Binding
NAD+ binding measurements were conducted in a Cary Eclipse fluorescence spectrometer (Varian Instruments, Mississauga, Canada), with an excitation wavelength of 295 nm and an emission wavelength of 340 nm and band passes of 5 nm. Using quartz UV cuvettes, 1 μm C3larvin in 600 μl of NAD+ buffer (20 mm Tris, pH 7.9, 50 mm NaCl) was titrated with various concentrations of β-NAD+ in solution between 1 and 1000 μm, and the fluorescence intensity was measured at 340 nm. The fluorescence intensity data were adjusted to account for the increase in volume of the sample upon the addition of NAD+, and a blank titration using N-acetyl tryptophanamide was used to account for inner filter effects. The data were analyzed using GraphPad Prism version 5 (La Jolla, CA) to calculate the dissociation constant.
Circular Dichroism Spectra
The circular dichroism (CD) spectra were acquired for C3larvin WT and the Q155A/E157A variant in a JASCO J-815 CD spectropolarimeter (190–250-nm scan, average of six spectra). The proteins were at 0.16 mg/ml in 5 mm Tris-HCl, pH 7.5, buffer in a 1-mm pathlength UV CD cuvette.
GH Activity
GH measurements were carried out using either a Cary Eclipse fluorescence spectrometer or FLUOstar Omega plate reader (BMG, Ortenberg, Germany). GH was monitored using the fluorescent NAD+ analog etheno-NAD+ (ϵNAD+). Cleavage of the bond between nicotinamide and etheno-ADP-ribose causes a 10-fold increase in the fluorescence quantum yield of the etheno group by reducing intramolecular quenching (12). Fluorescence was monitored using an excitation wavelength of 300 nm (305 nm using the Cary Eclipse spectrometer) and an emission wavelength of 405 nm, using excitation and emission band passes of 5 nm. For measurement on the Cary Eclipse spectrometer, various concentrations of ϵNAD+ (from 1 μm up to 2 mm) and C3larvin (20 μm) were added to a buffer containing 20 mm Tris, pH 7.9, 50 mm NaCl (NADGH buffer) to a final volume of 70 μl, and the reaction was covered with 200 μl of mineral oil. This was then monitored at 37 °C for a minimum of 2 h. Monitoring of the reaction using the FLUOstar Omega plate reader occurred under similar conditions, using a 96-well Grenier half-area clear plate (Corning, Inc.), with a final reaction volume of 50 μl, sealed with clear tape.
Initial sample slopes were measured and converted from fluorescence units/min to units of ϵADP-ribose formed/min using an etheno-AMP standard curve. These slopes were plotted against ϵNAD+ concentration and fitted to the Michaelis-Menten model using GraphPad Prism version 5 to determine Km and Vmax using residual plots to judge the goodness of each fit.
N-Methylanthraniloyl Guanosine Triphosphate Activity Assay
N-Methylanthraniloyl guanosine triphosphate (mGTP) (Molecular Probes, Inc., Eugene, OR) is a fluorescent GTP analog for which the fluorescence quantum yield increases upon binding to proteins, making it ideal for use in nucleotide exchange assays to monitor whether RhoA is binding GDP/GTP and thus correctly folded. RhoA was incubated with a 2-fold molar excess of GDP for at least 30 min at room temperature before the start of the assay (13). RhoA was then added to a final concentration of 0, 100, 500, or 1000 nm in a reaction volume of 70 μl of buffer (10 mm triethanolamine, pH 7.5, 150 mm NaCl, 2.5 mm MgCl2) containing 1 μm mGTP. The reaction was monitored over a period of 1 h in the Cary Eclipse spectrometer using an excitation wavelength of 360 nm and an emission wavelength of 444 nm, with excitation and emission band passes of 5 nm. The samples were excited for 1 s every 20 s to minimize photobleaching of the mGTP.
Virtual Screen for C3larvin Inhibitors
Prior to obtaining crystallography data for C3larvin, a virtual screen was conducted against a high resolution structure of a representative mART family member, ι-toxin, in complex with NADH (PDB code 1GIQ) to identify a set of compounds to test as inhibitors against C2/C3-like mART toxins. This screening was conducted using tools from both the Schrödinger software suite and the OpenEye software suite (14, 15). Briefly, NAD+ was used to define the ι-toxin active site, and all of the waters were removed. The structure was processed using the Schrödinger Protein Preparation Wizard with default settings. All Ser, Thr, and Tyr hydroxyl groups pointing into the active site were treated as rotatable. Also, two hydrogen bond constraints were set for Arg296. The starting library was the ZINC Drugs NOW set of ∼6.5 million druglike compounds (16). High throughput virtual screening was conducted using Schrödinger Glide, and we kept only the top 1% of the docked compounds for the next step. Then standard precision docking was conducted using Schrödinger Glide, and, again, we kept only the top 1% of the docked compounds (294 in total). These compounds were filtered again and refined to select a set for in vitro and cell-based testing. First, 11 compounds were selected on the basis of the Schrödinger r_i_docking_score alone, 5 compounds were selected on the basis of passing the OpenEye BlockBuster filter, and 9 compounds were selected based on an additional round of focused screening using a procedure described previously (17).
Inhibitor Tests
Inhibitor testing was conducted against the GH activity of C3larvin, utilizing inhibitors designed to be competitive against the NAD+ substrate. The compounds (designated M-series) were obtained from Molport, (Riga, Latvia). The P6-series was obtained from Sinova Inc. (Bethesda, MD). V-series inhibitors were obtained from ChemBridge (San Diego, CA). Inhibitor assays were performed using a FLUOstar Omega plate reader in 96-well Grenier half-area clear plates, with a final reaction volume of 50 μl. Then 20 μm C3larvin was incubated with 300 μm ϵNAD and a 30–50 μm concentration of each inhibitor at 37 °C. Because some of the inhibitors were dissolved in DMSO, a control was performed using the same volume of DMSO (2%, final concentration) as the amount of inhibitors used. The remainder of the reaction volume consisted of NADGH buffer. The reaction was monitored over the course of 8 h using an excitation wavelength of 300 nm and an emission wavelength of 405 nm. The initial slope of each reaction was taken and then normalized to the average of the DMSO control reactions.
IC50 Determination
IC50 determinations were performed using a Cary Eclipse fluorimeter with an excitation wavelength of 305 nm and an emission wavelength of 405 nm, using 5-nm band passes. C3larvin (20 μm) was mixed in a cuvette with 300 μm ϵNAD with various inhibitor concentrations and NAD+-glycohydrolase buffer to a final volume of 70 μl. Cuvette samples were covered with mineral oil to prevent evaporation. The reaction was monitored for a minimum of 2 h, and the initial slopes were measured. Slopes were converted from fluorescence units/min to units of ϵADP-ribose formed/min using an etheno-AMP standard curve. The IC50 was calculated using non-linear regression in GraphPad Prism version 5.
NAD+ Pocket Definition in C3larvin
This procedure was performed in two stages. First, the C3larvin and C3bot1-NAD+ (PDB code 2C8F) x-ray structures were protonated at 300 K, pH 7.4, and 0.1 m ionic strength using the Protonated3D MOE module (Molecular Operating Environment, Chemical Computing Group Inc., Montreal, Canada). Both structures were superposed based upon their backbone atoms, with an emphasis on secondary structure matching. The superposed NAD+ was energy-optimized in the context of fixed C3larvin as the receptor. In the second stage, the active pose of NAD+ was estimated by conducting 12 ns of a simulated annealing protocol (2 ns of heating and equilibration at 300 K, 5 ns of each production and cooling phase) under an implicit solvent model with fixed backbone atom coordinates. The final NAD+ conformation was docked onto the original C3larvin structure (PDB code 4TR5) (including crystallographic waters), allowing both ligand and side chains to relax under a restrained potential. For this final complex, all of the residues with atoms within a 4.5-Å distance from the ligand were considered pocket residues.
M3 Docking in C3larvin
Inhibitor M3 was docked into the prepared C3larvin structure using the NAD+ pocket as the “site,” guided by a pharmacophore model that considers the two fused rings of adenine as aromatic centers (and projections) and a hydrogen acceptor corresponding to the N1A heteroatom as features. The final top 30 poses according to the London score were saved for a final refinement allowing pocket side chains to relax (induced fit protocol) using reaction field electrostatics, while restraining the M3 ligand to the pharmacophore definitions. The final score was based on the ΔG GB/IV-WSA score function provided by Molecular Operating Environment.
RhoA Substrate Identification
Substrate identification was performed with a fluorescein-NAD+ blotting method. A solution of 8.3 μm fluorescein-NAD+ (Trevigen, Gaithersburg, CT) was incubated for 1 h in a reaction containing 3 μm C3larvin and 6.7 μm RhoA-GST for 1 h in 15 μl, made to volume with buffer (1 mm DTT, 5 mm MgCl2, 1 mm EDTA, 20 mm Tris-HCl, pH 7.5). The reactions were shaken on a MixMate (Eppendorf, Hamburg, Germany) at 300 rpm in the dark. After incubation, the reactions were mixed with 5 μl of Laemmli buffer and run on an SDS-polyacrylamide gel. The gel was exposed, and the fluorescence was imaged using a ChemiDoc MP system (Bio-Rad).
Transferase Reaction
Transferase kinetic parameters were determined using an end point fluorescein-NAD+ blot assay at 22 °C. Then 3 μm C3larvin was incubated with 25 μm fluorescein-NAD+, 275 μm β-NAD+, and between 0 and 150 μm RhoA-GST in a 15-μl reaction made to volume with buffer (1 mm DTT, 5 mm MgCl2, 1 mm EDTA, 20 mm Tris-HCl, pH 7.5). The reactions were started with the addition of the NAD+ mixture and allowed to continue for 10 s in the dark before adding 5 μl of Laemmli buffer to stop the reaction. The band fluorescence intensity in each well corresponding to RhoA-GST was measured using a ChemiDoc MP system with Image Lab software (Bio-Rad) and set relative to the band containing 7 μm RhoA-GST undergoing the same reaction. The data were then converted from fluorescence intensity to concentration units using a standard curve and analyzed using GraphPad Prism version 5 to generate Km, Vmax, and kcat data.
The same technique was used to generate Km, Vmax, and kcat data for the transferase reaction with respect to the NAD+ substrate, in which case the NAD+ concentration was varied while the RhoA-GST concentration was held at 200 μm.
The standard curve was generated by performing a control reaction as described above and separated on an SDS-polyacrylamide gel along with samples containing 5 μl of Laemmli buffer and 25, 50, 75, 100, 150, and 200 nm fluorescein-NAD+. The sample fluorescence values were taken relative to the control band using a ChemiDoc MP system and plotted against their known concentration values in order to obtain a standard curve.
Cell Assays
A frozen 1-ml aliquot of RAW 264.7 murine macrophage cells (ATCC, Manassas, VA; catalogue no. TIB-71) was rapidly heated to 37 °C and diluted in 9 ml of prewarmed Dulbecco's modified Eagle's medium (DMEM) (Lonza, Basel, Switzerland) containing 10% fetal bovine serum (FBS) (Invitrogen) and a penicillin (100 units/ml)-streptomycin (100 μg/ml) mixture (Lonza) in a 25-cm2 culture flask (Corning) and grown in a 37 °C water-jacketed incubator at 5% CO2. Cells were passaged by scraping to resuspend the cells and transferring 1 ml to a new 25-cm2 flask containing 9 ml of prewarmed medium. The same revival and passaging protocols were followed for J774A.1 murine macrophage cells (ATCC, Manassas, VA; catalogue no. TIB-67).
Cell morphology assays were performed in a similar manner. J774A.1 or RAW 264.7 cells were grown to confluence in 25-cm2 culture flasks, the cells were resuspended, and 100 μl was transferred to 6-well or 96-well culture plates (Corning) containing 4 ml of supplemented medium (200 μl for the 96-well plates). For RAW 264.7 cells, pressure was used to break up cell clumps by keeping the pipette tip opening pressed against the bottom of the plate, which ensured monolayer formation. J774A.1 cells naturally form a monolayer, so there was no need to use pressure to break up clumps with these cells. The cells were left for 48 h to grow in the new medium, at which point either toxin or control buffer was added. The cells were observed 20 h later, and any morphological changes were recorded.
RESULTS
P. larvae Encodes a C3-mART Toxin
The 190-residue C3larvin protein is encoded within the ERICI and ERICII regions in P. larvae but is distinct from the Plx1 and Plx2 characterized recently (19). C3larvin is a single-domain mART toxin that lacks a leader sequence, and it has the catalytic QXE signature of mART toxins (Fig. 1A). Most QXE mART toxins fall within the cholera toxin subgroup of C3-like toxins (4). C3-like mART toxins are all single domain enzymes of between 20 and 25 kDa (8). Until recently, they have been described in the literature as being produced exclusively by four Gram-positive pathogens, two of which produce multiple C3 exotoxins. The seven C3 exotoxins share a minimum of 35% sequence identity, and the most similar are 77% identical (Fig. 1, A and B). All C3 enzymes are single-domain toxins, except for the recently reported Plx2 toxin in P. larvae (19), which awaits further characterization. The C3 proteins all share a conserved α-3 motif, catalytic Arg, STS motif, PN loop, ARTT loop, and catalytic QXE motif (Fig. 1A). Additionally, the C3 enzymes consist of the <25-kDa mART domain and have both transferase and GH activity, although GH activity is much weaker than transferase activity (8).
FIGURE 1.

Multiple-sequence alignment of the C3 toxins. A, sequence alignment of C3 toxins and C3larvin produced using the T-Coffee Web server to align the sequences and ESPript to generate the figure (36). Key catalytic regions are highlighted. Identical residues are highlighted in red, and similar residues are shown in red type. B, identity matrix showing the amino acid identity between the 100 core catalytic residues of the known C3 toxins and C3larvin. Red, highly diverse sequences; green, a large amount of conservation between sequences. The identity matrix was generated using ClustalX2 (18) and colored using Microsoft Excel. C, purification and identification of C3larvin from E. coli lysate. Shown is an SDS-polyacrylamide gel and anti-His tag Western blot showing the purification and identification of C3larvin. Lane 1, molecular mass standards, 14.4, 21.5, 31, 45, 66.2, 97.4 kDa; lane 2, total E. coli cell lysate; lane 3, soluble cell lysate fraction; lane 4, purified C3larvin after gel filtration chromatography; lane 5, Western blot, purified C3larvin; arrow, position of C3larvin.
Almost all C3 toxins modify the small G-proteins RhoA, RhoB, and RhoC at the Asn41 residue (8). RhoA ADP-ribosylation occurs at the highest rate, followed by that of RhoB and then RhoC (20). Rac and Cdc42 are targets of several C3 toxins but show a slower ADP-ribose acceptor rate than that of RhoA (8, 20). C3stau1 and C3stau2 are C3-like toxins that modify RhoE and Rnd3 as well as RhoA, -B, and -C and show slower transferase activity against these protein substrates compared with RhoA (4, 8).
The one notable exception to the universal targeting of RhoA by C3 toxins is SpyA from Streptococcus pyogenes (21). Structurally, SpyA closely resembles a C3 toxin. It exists as an A domain and is approximately the same size as the other C3 toxins. It shares 25% amino acid sequence identity to members of the C3 subgroup. A key difference between SpyA and the rest of the C3 group, however, is that the catalytic signature of SpyA matches the Glu-X-Glu signature of the C2 and cholera toxin-pertussis toxin groups. Similar to the C3lim mutational experiments mentioned previously, SpyA targets Arg instead of Asn and has been shown to target several eukaryotic proteins, most notably actin, but not any Rho proteins (21).
Expression of C3larvin in E. coli
The C3larvin gene was overexpressed in Rosetta E. coli cells, and the protein was purified at a yield of several mg/liter of culture using immobilized metal affinity chromatography. The purity level was assessed by SDS-PAGE (Fig. 1C, lane 4), and the protein was positively identified by Western blot analysis using an anti-His tag antibody (Fig. 1C, lane 5).
C3larvin Crystal Structure
The structure of C3larvin was refined to a resolution of 2.30 Å in the apo (substrate-free) form (Fig. 2A). This crystal structure includes the entire polypeptide chain of C3larvin (but not the recombinant N-terminal region) and shares similar topology with the other C3 toxins (Fig. 2B). It folds into a mixed α/β structure and displays a characteristic mART fold, containing two perpendicular β-sheets next to a NAD+ binding loop (Fig. 2C). Superimposition of C3larvin with the NAD+-free conformations of C3bot1 (PDB code 1G24), C3stau2 (PDB code 1OJQ), and C3lim (PDB code 3BW8) reveals low root mean square deviations of 1.437, 1.389, and 1.479 Å, respectively. However, upon closer observation of the backbone traces, more pronounced differences in certain regions are observed. The N terminus of the structure appears to be truncated compared with that of other solved C3 toxins (Fig. 2B), resulting in a shortened helix 1 and no N-terminal loop (the loop region seen at the N terminus of the structure is an artifact of the recombinant sequence from the parental plasmid used for recombinant protein expression, affinity tag, and cleavage site and would not be present for a wild-type sequence, which starts at Met23). If helix 1 in C3larvin were similar in size to helix 1 in the other C3 toxins, it would likely clash with some of the residues from the PN loop of C3larvin. Helices 2, 3, and 4 all appear quite similar to previous C3 structures (helices 2 and 3 combine to contain the α-3 motif) but are oriented at a slightly different angle compared with other C3 toxins.
FIGURE 2.

C3larvin structures. A, C3larvin crystal structure shown as a ribbon diagram. Secondary structural elements (α-helix (H) and β strands (β)) are shown and numbered in succession. The location of the only Trp residue in C3larvin is shown in helix 1 and faces inward. The N-terminal recombinant sequence is colored black. B, structural comparison of C3larvin (green), C3bot1 (PDB code 1G24; red), and C3lim (PDB code 3BW8; yellow) based on an iterative three-dimensional alignment of protein backbone Cα atoms using PyMOL (version 1.5.0.4; Schrödinger, LLC, New York). C, C3larvin catalytic elements are shown. Catalytic residues Arg71, Gln155, and Glu157 are colored magenta, red, and blue. Other elements include the STS motif (lime green), PN loop (yellow), and ARTT loop (orange). D, the overall C3larvin structure, C3bot1 (PDB code 1G24), and C3bot1-NAD+ bound (PDB code 1GZF) are shown in light gray. The catalytic Gln residue conformations of C3larvin (red), C3bot1 (green), and C3bot1-NAD+ bound (yellow) are shown. The distance between Gln residues of C3larvin and C3bot1 is ∼4.0 Å. The distance between Gln residues of C3bot1 and C3bot1-NAD+ bound and between those of C3larvin and C3bot1-NAD+ bound is ∼8.0 Å.
Overall, the active site is remarkably similar to that of C3bot1, with the location of the β-strands appearing almost identical between the two structures. An interesting feature in C3larvin is the presence of extended β-strands (β-5, β-6, and β-7), the most significant being the β-sheet (β-5) on the N-terminal region of the ARTT loop (Fig. 2B) and the β-sheet (β-6) containing the QXE motif. As a result, the ARTT loop has comparatively fewer residues and may provide more stability within the active site. Also, the solvent-exposed loops (i.e. ARTT loop and PN loop in C3larvin) adopt a more open conformation compared with other C3 structures (Fig. 2B). The catalytic Glu157 is in a similar position to that of other C3 toxins. However, the catalytic Gln155 of C3larvin has an orientation significantly different from that of the conserved Gln residues found in other NAD+-free conformations of C3 toxins (Fig. 2D). The Gln155 in its current position would clash with the residues of the PN loop of other C3 toxins. It is rotated along the axis of the main chain, moving ∼4 Å farther than the similar residue (Gln212) in C3bot1. The source of this change in orientation may lie in the residue separating the Gln and Glu (QXE motif). In other solved structures, the residue that separates these catalytic residues is a Lys (or another Gln, in the case of C3stau2). C3larvin is the first C3 structure solved in which that residue has been substituted with a Tyr (Tyr is also present in this position in C3cer, for which there is no crystal structure). This Tyr may exert some steric hindrance with residues in nearby areas of the protein and cause a displacement of the backbone structure in this area. It is also possible that there is an induced fit mechanism in this region of the structure, in which binding of a substrate would cause the Glu155 to shift to a more catalytically relevant position. Upon binding an NAD+ molecule, the ARTT loop changes its conformation from a solvent-exposed environment to a more buried conformation in C3bot1. In particular, the Gln212 residue in C3bot1 makes a large shift (∼8 Å) toward the interior of the NAD+ binding cleft. Interestingly, the distance from the Gln155 residue of C3larvin is also similar (∼8 Å; Fig. 2D).
C3larvin Is Lethal to Yeast
To test the toxicity of C3larvin to eukaryotic cells; we employed a yeast-based growth inhibition assay. In this method, we control C3larvin gene expression with the CUP1 (copper-inducible) promoter, and an active toxin will cause a growth defect phenotype in yeast (22). The effect of C3larvin WT and variants on yeast growth is shown in Fig. 3A. This test shows that at low levels of copper induction, WT C3larvin is highly toxic to yeast cells, even more so than ExoA from P. aeruginosa (control toxin) (Fig. 3A). None of the catalytic variant toxins showed any yeast cell death and restored the growth defect phenotype caused by the WT C3larvin. It is normally expected that the single catalytic variants would have at least some toxicity to yeast cells; however, in one previous case, catalytic variants of C3cer have been shown to lose all transferase activity when either the catalytic Gln or Glu was substituted with an Ala residue (20). This suggests a highly specialized catalytic site, where both the Gln and Glu are absolutely essential for proper function. Thus, these results suggest that C3larvin is a bona fide mART toxin and confirmed its cytotoxicity (caused by its mART activity) in a eukaryotic system.
FIGURE 3.

C3larvin inhibition of yeast growth and substrate binding. A, inhibition of yeast growth by C3larvin and selected catalytic variants. All growth is compared with that of yeast expressing a control toxin, P. aeruginosa exotoxin A. Growth is shown at four different concentrations of Cu2+ induction, indicated on the abscissa. Black bar, ExoA; white bar, C3larvin WT; thin stripes, C3larvin Q155A; wide stripes, C3larvin E157A; grid pattern, C3larvin Q155A/E157A. B, NAD+ substrate binding by C3larvin. The binding isotherm for NAD+ with C3larvin was determined by quenching the intrinsic protein fluorescence. The raw fluorescence quenching data were converted to fractional saturation values (ΔF/ΔFmax) and are plotted against the NAD+ concentration. The excitation was 295 nm, and the emission was 340 nm with excitation and emission band passes at 5 nm in 5 mm Tris-HCl, 50 mm NaCl, pH 7.9 buffer. Error bars, S.D. C, CD spectra of C3larvin wild type (thick line) and Q155A/E157A variant (thin line) in 5 mm Tris, pH 7.5, buffer. The concentration of both proteins was 0.1 mg/ml, and each spectrum is the average of six independent spectra.
C3larvin Binds and Hydrolyzes NAD+ as Substrate
C3larvin has a single Trp residue (Trp31) that is located within helix 1 (Fig. 2A) and faces inward. This Trp was exploited to characterize the NAD+ substrate binding to the active site. C3larvin was titrated with NAD+ substrate (Fig. 3B). Titration of C3larvin resulted in a 73% reduction in the initial (single) Trp fluorescence (Fig. 3B), and binding analysis revealed a single binding site with a KD of ∼21 μm (Table 2), which is consistent with the known NAD+ affinity for other C3 toxins, such as C3bot1 (60 ± 6 μm) (23).
TABLE 2.
Kinetic parameters of the GH and transferase reactions and NAD+ binding affinity of C3larvin
Kinetic parameters were obtained as described under “Experimental Procedures” and represent the means ± S.E.. All represent triplicate measurements for three separate experiments. ND, not determined.
| Parameter | Substrate |
|
|---|---|---|
| NAD+ (GH) | RhoA-GST (transferase) | |
| Km (μm) (transferase) | 33.6 ± 11.9 | 16.8 ± 2.5 |
| Km (μm) (GH) | 120.1 ± 16.4 | |
| Vmax (nm min−1) | 26.4 ± 1 | 15,800 ± 680 |
| kcat (min−1) | 1.3 ± 0.05 × 10⁻³ | 5.26 ± 0.23 |
| kcat/Km (m−1 min−1) | 10.9 | 3.13 × 10⁵ |
| Kd (μm)a | 21.4 ± 3.2 | ND |
a The Kd value for the NAD+ substrate represents the binding affinity of NAD+ for active site of C3larvin and was measured by the Trp quenching caused by NAD+ docking within the active site of the enzyme (see “Experimental Procedures”). All represent triplicate measurements for three separate experiments ± S.D.
GH activity is present as a secondary enzymatic activity in most mART enzymes and represents the first step of the mART reaction, where OH− serves as the nucleophile in the absence of a target protein (1). C3larvin GH activity was characterized with a fluorescence-based assay developed in our laboratory (Fig. 4A) (12). C3larvin GH activity showed Michaelis-Menten behavior and gave a Km value of 120 ± 16 μm and a kcat of 1.3 ± 0.05 × 10⁻³ min−1 (Table 2). Other C3 enzymes have similar kinetic parameters for GH activity; for example, C3lim had a Km (NAD+) = 160 μm and a kcat = 2 × 10⁻³ min−1 (24). The GH reaction rate for the catalytic variant, Q155A/E157A, was not detectable and appeared as baseline values (Fig. 4A). To assess folded integrity of the enzymes, CD spectroscopy was conducted on the WT C3larvin and the double variant (Q155A/E157A), which showed typical spectra for an α/β-type domain, and also there were no significant differences in the folding of the two proteins based on their CD spectra (Fig. 3C). This indicates that C3larvin was properly folded and was an active enzyme (Figs. 3 and 4). This result for the Q155A/E157A C3larvin variant is consistent with other C3 enzymes, in which the catalytic Glu is essential for any detectable transferase or GH activity (20, 24, 25).
FIGURE 4.

C3larvin enzyme activity. A, GH activity of WT and Q155A/E157A C3larvin. Fluorescence was monitored using an excitation wavelength of 305 nm and an emission wavelength of 405 nm, using excitation and emission band passes of 5 nm. Various concentrations of ϵNAD+ (from 1 μm to 1.5 mm) and C3larvin (20 μm) were added to a buffer containing 20 mm Tris, pH 7.9, 50 mm NaCl to a final volume of 70 μl, and the reactions were covered with 200 μl of mineral oil. The reactions were monitored at 37 °C for a minimum of 2 h. Filled circles, WT C3larvin; open circles, Q155A/E157A C3larvin. The data were fit to the Michaelis-Menten model. Error bars, S.D. B, mGTP binding to RhoA. Purified RhoA was incubated with a 2-fold molar excess of GDP for at least 30 min at room temperature before the start of the assay. RhoA was added to a final concentration of 0, 100, 500, or 1000 nm in a reaction volume of 70 μl of buffer (10 mm triethanolamine, pH 7.5, 150 mm NaCl, 2.5 mm MgCl2) containing 1 μm mGTP. The binding/exchange kinetics were monitored over a period of 1 h in a Cary Eclipse spectrometer using an excitation wavelength of 360 nm and an emission wavelength of 444 nm, with excitation and emission band passes of 5 nm. The samples were excited for 1 s every 20 s to minimize photobleaching of the mGTP. The arrow indicates the addition of the RhoA protein to the reaction. C, ADP-ribosylation of RhoA-GST by C3larvin. ADP-ribosyltransferase kinetic parameters were determined using an end point fluorescein-NAD+ blot assay at 22 °C (see “Experimental Procedures”). C3larvin (3 μm) was incubated with 25 μm fluorescein-NAD+, 275 μm β-NAD+, and between 0 and 150 μm RhoA-GST in a 15-μl reaction volume in reaction buffer (1 mm DTT, 5 mm MgCl2, 1 mm EDTA, 20 mm Tris-HCl, pH 7.5). The reactions were started by adding the NAD+ mixture and allowed to continue for 10 s in the dark before the addition of 5 μl of Laemmli buffer to stop the reaction. The fluorescence of the bands in each well corresponding to RhoA-GST was measured using a ChemiDoc MP system with ImageLab (Bio-Rad) and set relative to the band containing 7 μm RhoA-GST. The data were then converted from fluorescence intensity to concentration units using a standard curve and fit to a Michaelis-Menten model to generate Km, Vmax, and kcat data. The arrow indicates the position of RhoA. The original image was converted to a negative image. D, ADP-ribosyltransferase activity of C3larvin as a function of RhoA-GST concentration. The data from C above were plotted according to the Michaelis-Menten model. Error bars, S.D.
C3larvin ADP-ribosylates RhoA
All C3 toxins have been shown to target RhoA as the primary substrate and have also been shown to target both RhoB and RhoC (C3stau1, -2, and -3 have also been shown to have several other secondary substrates). Thus, it was reasoned that C3larvin would target the Rho A protein. Because P. larvae is a known pathogen of honey bee larvae (6), the honey bee genome was searched for a RhoA homolog. A Basic Local Alignment Search Tool (BLAST) query was performed using the human RhoA protein sequence as a search template, and several predicted proteins with primary sequences showing high identity to RhoA were discovered in the honey bee genome (26). One protein in particular, Rho1, proved to be identical to RhoA for the first N-terminal 124 amino acids, including the previously identified C3 target residue, Asn41. Because the C-terminal region of Rho proteins has been implicated in targeting within the cell and shown to have a minimal effect on labeling by C3 toxins, it was determined that human RhoA would be a suitable homolog for these experiments.
A constitutively active RhoA-GST variant, with a deleted CAAX motif, was used as the substrate protein for C3larvin. This allowed for a simplified assay to determine whether RhoA-GST was properly folded because there were no additional steps required for activation that could pose problems. An mGTP binding assay was performed on purified RhoA-GST before its use in ADPRT assays to confirm that the RhoA protein was properly folded and active (Fig. 4B).
RhoA was confirmed as the target for C3larvin transferase activity by using fluorescein-NAD+ as an NAD+ substrate analog. The addition of the fluorescein group to the adenine ring of the NAD+ molecule allows for visualization of the ADP-ribose moiety covalently attached to a protein resolved on an SDS-polyacrylamide gel. After separating the reaction mixture containing C3larvin, purified RhoA-GST, and fluorescein-NAD+ on an SDS-polyacrylamide gel and illuminating it with ultraviolet light, a band (in a dose-dependent relationship) corresponding to RhoA-GST was visualized, confirming RhoA as the target (Fig. 4B). Using this fluorescein-NAD+ technique, C3larvin was found to have Km = 16.8 ± 2.5 3 μm and a kcat of 5.26 ± 0.23 min−1 with respect to the RhoA substrate (Fig. 4, C and D, and Table 2). These values assume that the fluorescein-NAD+ is consumed at the same rate as β-NAD+ as a substrate for C3larvin transferase activity. Previously, it has been shown that ethno-NAD+ is utilized at a slightly slower rate than β-NAD+ (27). However, the etheno group in ϵ-NAD+ is an additional “bridge” on the ADP-ribose group, whereas in fluorescein-NAD+, the fluorescein group is attached by a large, flexible linker. The more distant fluorescein group in fluorescein-NAD+ would be expected to cause less interference than the etheno group and provide Km and kcat values that are closer to the natural β-NAD+ substrate. To our knowledge, these kinetic values represent the first of their kind among the C3 subgroup because there is no report of Km or kcat values for C3 toxins with respect to the RhoA substrate. The Km for NAD+ under conditions of saturating RhoA (200 μm RhoA-GST) was 33.6 ± 11.9 3 μm.
Inhibition of C3larvin Transferase Activity
Previous work with C3 toxins has not produced any inhibitors of enzyme transferase activity (although at least one cell entry inhibitor has been identified for both C3bot1 and C3lim) (28). Because a number of inhibitors have been developed against mART toxin enzymatic function (29–31), the lack of inhibitors reported for C3 toxins suggests that there are properties of the C3 subgroup which make them unique. Even Certhrax, a non-C3 QXE toxin from Bacillus cereus, has several good inhibitors of its enzyme activity (32).
An initial screen for inhibitors against C3larvin using our in-house libraries of mART inhibitors did not produce any hits, indicating that C3larvin (and the C3 subgroup) have a unique architecture associated with the ADP-ribosyltransferase fold that requires a new, unique lead parent compound. Prior to obtaining crystallography data for C3larvin, we conducted a virtual screen against a high resolution structure of ι-toxin in complex with NADH (PDB code 1GIQ) to identify a set of compounds to use in tests against C2/C3-like mART toxins, including C3larvin. The screen produced a list of potential inhibitors, and the top 25 compounds were chosen for experimental testing (designated the M-series). A number of compounds (including M4 and M8, two of the most promising from the screen) revealed that high concentrations of the compounds also caused precipitation of C3larvin. However, one compound, M3, did not precipitate C3larvin and had an IC50 of 104 ± 27 μm (Ki = 11 ± 2 μm) (Fig. 5A and inset). M3 also caused similar inhibition of C3bot1 activity, indicating that it may have some universal significance as an inhibitor of the C3 subgroup.
FIGURE 5.

Inhibition of C3larvin GH activity. A, dose-response curve for M3 inhibitor on C3larvin activity. Activity loss in the presence of increasing doses of M3 inhibitor was assessed as described under “Experimental Procedures,” and the IC50 value was calculated from the data. Error bars, S.D. from at least three experiments. Inset, structure of the M3 inhibitor, N-[(1-[1H-pyrazolo[3,4-d]pyrimidin-4-yl]piperidin-3-yl)methyl]methanesulfonamide. B, pocket definition of C3larvin (gray surface) based on the modeled active conformation of NAD+ (green carbon atoms). C, pharmacophore model for C3larvin. Modeled active NAD+ (green carbon atoms) on C3larvin, with M3 (cyan carbon atoms) superposed (manually) to the adenine ring system, to depict the common features. The orange spheres/mesh show the pharmacophore definition based on the NAD+ adenine moiety, and the large yellow sphere is an anion center feature. D, docked poses of M3 (cyan carbon atoms), based on the pharmacophore definition (only features at the adenine moiety) and an induced fit (flexible) receptor. The ring system of M3 is rotated in relation to the previous slide (initial conformation), fulfilling in turn the anionic center.
Although M3 is not a potent inhibitor of C3larvin enzyme activity, it represents the first known C3 subgroup inhibitor to our knowledge and may serve as an important lead compound to develop inhibitors with greater efficacy. M3 differs from most mART inhibitors in that it consists of an adenine ring linked to a piperidine ring with a sulfated amine side chain (Fig. 5A, inset). Because C3larvin-M3 crystals did not diffract sufficiently well to solve the structure, we used an MM/MD approach to define the ligand-binding pocket of C3larvin (Fig. 5B). We then built a ligand pharmacophore in the C3larvin active site (Fig. 5C), and then the M3 inhibitor was fit into the pocket and pharmacophore model (Fig. 5D). According to this analysis, M3 probably competes with the adenine portion of NAD+ in the toxin active site, with Lys52, Asn55, and Arg59 predicted as residues with strong interactions with M3. Notably, most mART inhibitors compete with the nicotinamide portion of the NAD+ substrate (31). It may be that this relatively unmodified adenine ring is necessary for binding in the C3 toxin active site. Unfortunately, we were unsuccessful in obtaining well diffracting crystals of M3 bound to C3larvin to verify this hypothesis.
Cell Entry Experiments
C3larvin cell entry was tested against the macrophage cell lines J774A.1 and RAW 264.7, both of which are derived from mice. C3bot1 and C3lim can enter these cell lines at nanomolar concentrations (33). Both toxins were previously shown to cause distinct morphological changes in both cell lines, with the most obvious changes occurring in J774A.1 cells (33). Both C3bot1 and C3lim entered macrophages and caused morphological changes, as expected (Fig. 6, B and C, respectively). Under these same conditions, C3larvin did not cause any obvious morphological changes either with or without the His6 tag cleaved (Fig. 6D). This indicates that either C3larvin does not enter these macrophage cell lines by the same mechanism as C3bot1 and C3lim or that its effect on the cells is different from that of C3bot1 and C3lim.
FIGURE 6.
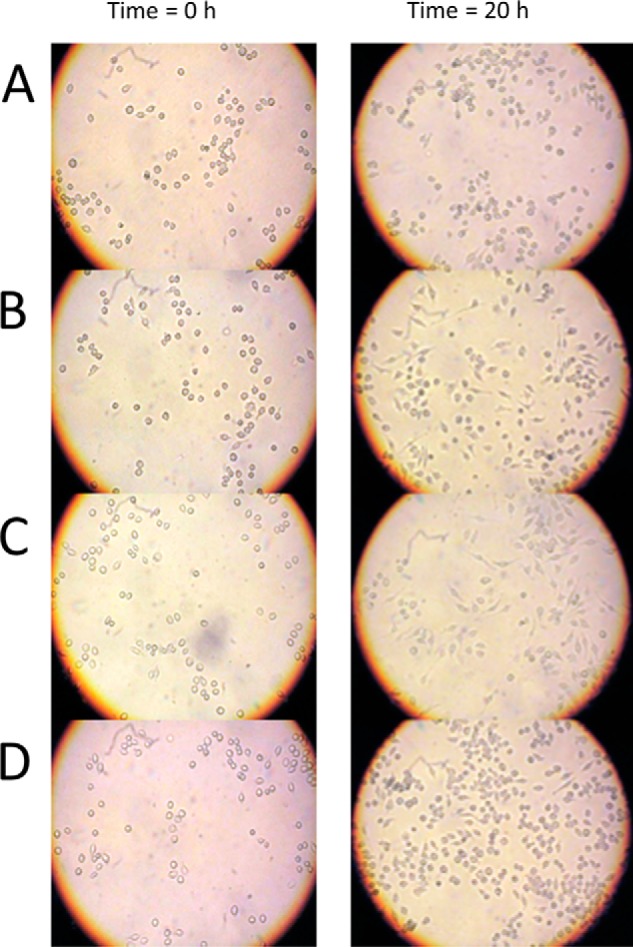
C3larvin and C3 toxin cell entry experiments. Cell morphology assays were performed with J774A.1 mouse macrophage cells that were grown to confluence in 25-cm2 culture flasks, the cells were resuspended, and 100 μl was transferred to 6- or 96-well culture plates containing 4 ml of supplemented medium (200 μl in the case of the 96-well plates). The cells were left for 48 h to grow in the new medium, at which point either toxin or control buffer was added. The cells were observed 20 h later, and any morphological changes were recorded. A, untreated macrophage cells; B, cells with buffer only; C, 30 nm C3bot1; D, 300 nm C3bot1. The elongated protrusions from the cells visible in B and C are phenotypic changes indicative of infection with C3 toxins. These protrusions are visibly absent for C3larvin-treated cells.
Previous work suggested that the N-terminal helices of C3bot1 and C3lim may be important for their cell entry (33). Upon examination of the structure of the four N-terminal α-helices of these three toxins, C3larvin clearly has a shorter helix 1. If these helices do contribute to cell entry, it is possible that this truncation may be part of the reason C3larvin does not appear to enter macrophage cells. Consequently, a C3larvin chimera was prepared by adding the C3bot1 N-terminal sequence (Tyr2–Trp19) that is lacking in C3larvin. The cell entry experiments were then conducted with C3larvin chimera and its corresponding catalytically inactive variant, Q155A/E157A. The results of the macrophage entry experiments are shown in Fig. 7. As observed from the data shown in Fig. 6, C3larvin did not enter mouse macrophage cells because there was no change in their morphology upon treatment with up to 300 nm C3larvin (Fig. 7, E and F). However, the C3larvin chimera caused significant morphological changes in the macrophages at 300 nm (Fig. 7H) but did not have much effect at 30 nm (Fig. 7G), as seen for C3bot1 (Fig. 7C). The C3larvin chimera variant Gln155/Glu157 had no effect upon macrophage morphology, as expected (Fig. 7, I and J). These results indicate that helix 1 is important for conferring cell entry activity in the C3 toxins; however, C3larvin does not appear to be as effective on a molar basis in entering macrophage cells. Notably, there was no difference in C3larvin chimera activity against macrophage cells with or without the His6 tag (data not shown). Interestingly, C3larvin lacks several conserved residues compared with other C3 toxins in this N-terminal region, including Arg14 (serine in other C3 toxins), Leu20 (an alanine in other C3 toxins), and Ala26 (either an arginine or a lysine in other C3 toxins). No specific residues have been shown so far to play a role in C3 cell entry, but the overall conservation of these residues in other C3 toxins indicates that they have a role in attenuating the cell entry mechanism.
FIGURE 7.
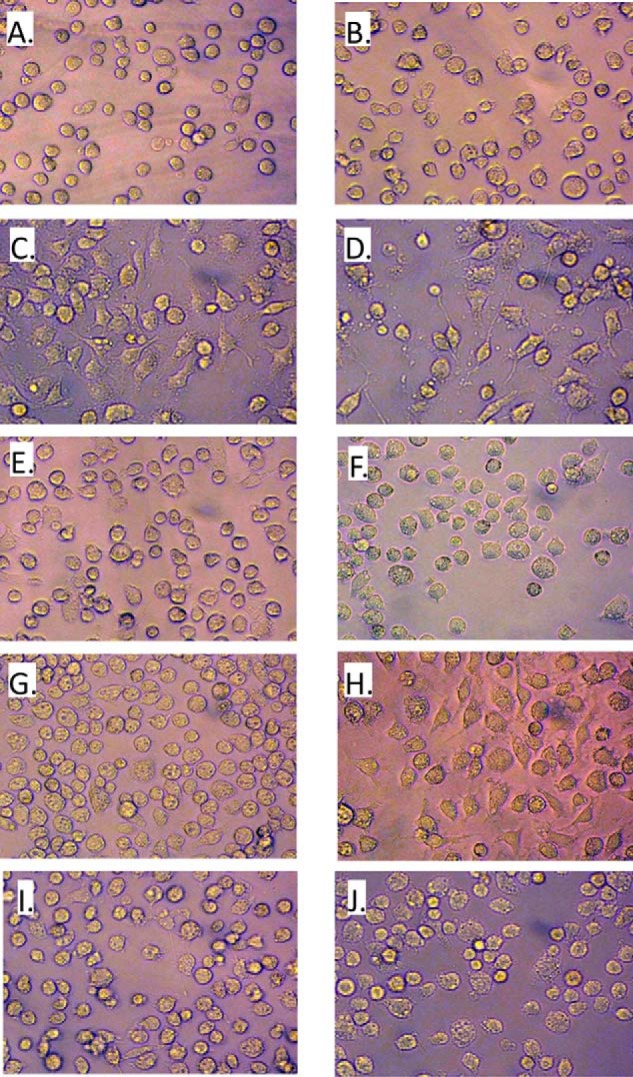
C3bot1 and C3larvin chimeras and effect on macrophages. Cell morphology assays were performed as described in the legend to Fig. 6 with mouse macrophage cells grown to confluence in 25-cm2 culture flasks. The cells were incubated with either toxin or control buffer in a 96-well plate. The cells were observed 20 h later, and any morphological changes were recorded. The cells were untreated (A) or treated with C3larvin buffer only (control) (B), 30 nm C3bot1 (C), 300 nm C3bot1 (D), 30 nm C3larvin (E), 300 nm C3larvin (F), 30 nm C3larvin chimera (G), 300 nm C3larvin chimera (H), 30 nm C3larvin chimera Q155A/E157A variant (I), and 300 nm C3larvin chimera Q155A/E157A variant (J).
Although cell entry mechanisms for the C3 toxins are not well understood, these results suggest that C3larvin may use a mechanism different from that used by both C3bot1 and C3lim. P. larvae has previously been shown to be an extracellular pathogen, so it is also unlikely that C3larvin follows the entry method of C3stau2 (6). It is possible that C3larvin simply does not enter macrophage cells but uses a unique mechanism for honey bee larval cells. The cell entry mechanisms shown for C3bot1 and C3lim (both of which are produced by bacteria pathogenic to humans) do not show the ability to enter several mammalian cell lines, including CHO and HeLa cells (33). The specificity of this cell entry mechanism indicates that it is highly evolved for its target cell. Because C3larvin would be expected to target larval insect cells and not mammalian macrophages, it is possible that it too is specific for its target cell type.
DISCUSSION
In this study, C3larvin, a novel mART toxin from P. larvae, was identified and characterized as another member of the C3 toxin subgroup. In silico methods were used to discover C3larvin within the sequenced genome of P. larvae by identifying conserved mART toxin residues and the characteristic ADP-ribosyltransferase fold. After in silico discovery, C3larvin was tested in a yeast assay and was shown to be extremely cytotoxic when expressed into the cytoplasm of yeast under control of a weak CUP1 promoter. Importantly, C3larvin catalytic variants (Q155A, E157A, and Q155A/E157A) designed to reduce or eliminate mART activity showed no toxicity to yeast, indicating that C3larvin is indeed a mART toxin with enzymatically driven cytotoxicity in a eukaryotic cell host.
C3larvin was expressed and purified from E. coli and was shown to possess both GH (OH− from water as the nucleophile) and transferase activities (Asn41 from RhoA as the nucleophile) (2). This is similar to previously characterized C3 mART toxins, all of which have been shown to label RhoA. The characterization of the GH activity using a fluorescent NAD+ analog revealed that C3larvin follows Michaelis-Menten kinetics with respect to the NAD+ substrate. Kinetic parameters were determined for the GH activity and were similar to those previously determined for C3 toxins. Transferase kinetic parameters to the RhoA substrate were also determined quantitatively (under conditions of saturating substrate concentrations) for a C3 toxin for the first time. An initial search for inhibitors against C3larvin GH activity showed no hits from our established mART toxin inhibitor libraries. These inhibitor libraries are composed of NAD+ analogs that are designed to bind to the active site of mART toxins and compete for binding into the nicotinamide pocket of these enzymes. Consequently, a virtual screen was conducted using ι-toxin as the universal C2/C3 model, target receptor because none of our mART toxin inhibitors proved effective against either C3larvin or C3bot1. One inhibitor, M3, was identified from the 25 top hits that were tested from the virtual screen. Notably, to our knowledge, this is the first known enzyme inhibitor for the C3 subgroup of mART toxins and may be used as a lead compound to develop more effective inhibitors. Our initial modeling results indicated that M3 may show a different mode of binding (docking within the adenine rather than nicotinamide subsite) within the NAD+ pocket of C3larvin, but verification must await a high resolution structure of the C3larvin-M3 complex. Notably, M3 has a substitution at C6 of the purine ring, whereas the adenine in NAD+ is substituted at the C9 position. This means that the orientation of M3 compared with the adenine in NAD+ is rotated with respect to one another; however, the aromatic center features do match, and in turn, the hydrogen acceptor of N1 in NAD+ aligns with the N7 in M3, and also in turn, the anion character of the phosphates in NAD+ aligns with the sulfonic group in M3.
Although previously characterized C3 toxins are capable of entry into macrophage cell lines, C3larvin did not display the same effect because it lacks the extended N terminus (longer helix 1) of the other C3 family members. Since C3larvin is a C3 toxin produced by an organism that targets a non-mammalian host, it is proposed that the macrophage cell lines tested were not similar enough to the natural target cell for C3larvin, thus preventing cell entry.
The crystal structure of C3larvin was determined to 2.3 Å, and C3larvin shows a high similarity to previously crystalized toxins from the C3 subgroup. However, several important differences between C3larvin and other C3 toxins were revealed from the C3larvin structure, most notably a truncated N-terminal helix 1 and a more open conformation of the ARTT and PN loops. The four N-terminal helices of C3 toxins were previously implicated in cell entry, suggesting that C3larvin is either utilizing a different mechanism of entry or targets another receptor on the cell surface. It is also possible that there is a B-domain that is required for C3larvin cell entry recently shown for a novel C3-like toxin, Plx2 from P. larvae (19). Regardless, the cell entry experiments suggest that C3larvin uses a different mechanism for gaining access to its target, host cells.
Although human RhoA has been identified as a protein substrate for C3larvin, it can be safely assumed that human RhoA is not the natural substrate, because P. larvae primarily infects honey bees. The natural substrate of C3larvin remains to be shown conclusively, because it has not been tested against insect proteins. BLAST searches reveal a putative protein within the Apis mellifera genome that closely resembles RhoA; they share identical amino acids for the first 120 residues. Testing C3larvin against this protein substrate and any others found in the honey bee genome that bear resemblance to RhoA could yield an additional natural substrate (or substrates) for C3larvin. C3larvin could also be tested for activity against human RhoB and RhoC. Both of these proteins are substrates for other C3 toxins. Although they are extremely similar to RhoA, no C3 toxin has identical kinetic parameters for the three substrate proteins. Investigation of the activity of C3larvin against the three Rho proteins and the residues involved (both from C3larvin and the Rho) could lead to a better understanding of the C3 catalytic mechanism and the specific interactions between Rho proteins and C3 toxins.
Previous work on C3bot1 has shown several non-enzymatic functions of the toxin (25). These functions suggest that C3bot1 has toxic effects independent of its transferase activity, which may apply to the larger C3 subgroup. C3bot1 interacts with the RalA GTPase, in which the toxin acts as a guanine nucleotide dissociation inhibitor, and these effects are seen to apply to the broader C3 subgroup, whereas its neurotrophic functionality has shown to be specific to only C3bot1. An investigation of these effects with C3larvin (as well as identification of the appropriate homologous targets in honey bees) would allow for a greater understanding of the effects of C3larvin.
To date, C3larvin has not been seen to enter any macrophage cell lines, unless equipped with a modified helix 1 (Fig. 7H), potentially because all tested cell lines have been mammalian. It is likely that there is some mechanism of cell entry for C3larvin that has yet to be discovered because it lacks the required helix 1 extension for macrophage cell entry. C3larvin may require a separate B-type subunit to facilitate receptor binding and cell entry, or it may require a specific host protein secreted into the extracellular medium. P. larvae was previously shown to be an extracellular pathogen, making it unlikely that C3larvin follows the cell entry mechanisms of the C3stau toxins. A logical next step would be to test C3larvin for cell entry into an insect cell line. Until recently, there have been no available honey bee cell lines for testing; however, a honey bee cell line has recently been developed (34). This cell line should be tested to see whether C3larvin can enter and cause morphological changes. Previous C3 cell entry work has shown a distinct morphological change in the cells upon entry; however, it may be prudent to fluorescently label C3larvin before these experiments, to see if it is visible within the cell even if no morphological changes occur. It may also be possible to use this cell line to determine a receptor for C3larvin on the cell surface. Receptors for C3 toxins in cell entry have previously been posited to exist, but to date, none have been discovered. As mentioned above, the other possibility is that there exists a B-domain in the genome of P. larvae that functions as the receptor-binding module to facilitate C3larvin cell entry as for the case of the Plx2 C3-like toxin from P. larvae (19).
With the discovery of the M3 inhibitor, there is now a structural basis from which new inhibitors can be derived. Modifications of M3 may provide tighter interactions with C3larvin and overall function as better inhibitors. Structure-function relationships may involve co-crystalizing C3larvin with M3. Unfortunately, we have been unsuccessful to date in obtaining good diffracting crystals of the C3larvin-M3 complex. This co-crystallization would reveal exactly how M3 binds to C3larvin and which residues are important for the interactions. This would allow the introduction of groups onto the M3 inhibitor to interact specifically with C3larvin residues or allow for changes in the backbone structure of M3 to fit better into the binding pocket. These rationally designed inhibitors would represent potent anti-virulence compounds against P. larvae.
Several other co-crystallization experiments should be conducted to give more insight into the catalytic mechanism of C3larvin. Presently, several mART toxins have been crystalized with their protein substrates. However, no structures exist of a C3 toxin with its mART substrate (C3bot1 has been crystalized with RalA). Co-crystallization of C3larvin with RhoA will give insight into the residues involved in interaction and binding and could potentially give insights into the catalytic mechanism (35).
As well, C3larvin will be co-crystallized with an NAD+ analog because we have previously found success with cholix toxin (17). Although it would be ideal to co-crystallize C3larvin with NAD+, the alkaline pH of the crystallization conditions does not presently allow it. However, in crystalizing with an NAD+ analog, many of the conformational changes that occur upon NAD+ binding will be seen. This would provide a greater understanding of the differences between the active site of C3larvin and those of other C3 toxins. Bacterial infections are a major source of disease and death worldwide as well as a detriment to crop yields. Previously controlled with antibiotics, pathogenic bacteria are now rapidly developing resistance to these compounds, making them increasingly difficult to treat. In using anti-virulence compounds to specifically target virulence factors, the impact of these pathogens may be diminished. The study of mART toxins allows for the development of anti-virulence compounds that can eventually mitigate much of the damage caused by these bacteria.
Acknowledgments
We thank Dawn White, Ana Loncar, Rob Reid-Taylor, and Tom Keeling for excellent technical assistance. We also thank Drs. Matthieu Schapira and Kong Nguyen (Structural Genomics Consortium, Toronto) for virtual screening expertise. Research described in this paper was performed using beamline 08ID-1 at the Canadian Light Source.
This work was supported by the Canadian Institutes of Health Research (to A. R. M.). The Canadian Light Source is supported by the Natural Sciences and Engineering Research Council of Canada, the National Research Council Canada, the Canadian Institutes of Health Research, the Province of Saskatchewan, Western Economic Diversification Canada, and the University of Saskatchewan.
The atomic coordinates and structure factors (code 4TR5) have been deposited in the Protein Data Bank (http://wwpdb.org/).
- mART
- mono-ADP-ribosyltransferase
- ϵNAD+
- etheno-NAD+
- GH
- glycohydrolase
- mGTP
- N-methylanthraniloyl guanosine triphosphate
- PDB
- Protein Data Bank.
REFERENCES
- 1. Yates S. P., Jørgensen R., Andersen G. R., Merrill A. R. (2006) Stealth and mimicry by deadly bacterial toxins. Trends Biochem. Sci. 31, 123–133 [DOI] [PubMed] [Google Scholar]
- 2. Jørgensen R., Wang Y., Visschedyk D., Merrill A. R. (2008) The nature and character of the transition state for the ADP-ribosyltransferase reaction. EMBO Rep. 9, 802–809 [DOI] [PMC free article] [PubMed] [Google Scholar]
- 3. Collier R. J. (2001) Understanding the mode of action of diphtheria toxin: a perspective on progress during the 20th century. Toxicon 39, 1793–1803 [DOI] [PubMed] [Google Scholar]
- 4. Fieldhouse R. J., Merrill A. R. (2008) Needle in the haystack: structure-based toxin discovery. Trends Biochem. Sci. 33, 546–556 [DOI] [PubMed] [Google Scholar]
- 5. Holbourn K. P., Shone C. C., Acharya K. R. (2006) A family of killer toxins. Exploring the mechanism of ADP-ribosylating toxins. FEBS J. 273, 4579–4593 [DOI] [PubMed] [Google Scholar]
- 6. Genersch E. (2010) American Foulbrood in honeybees and its causative agent, Paenibacillus larvae. J. Invertebr. Pathol. 103, S10–S19 [DOI] [PubMed] [Google Scholar]
- 7. Rieg S., Martin Bauer T., Peyerl-Hoffmann G., Held J., Ritter W., Wagner D., Kern W. V., Serr A. (2010) Paenibacillus larvae Bacteremia in injection drug users. Emerg. Infect. Dis. 16, 487–489 [DOI] [PMC free article] [PubMed] [Google Scholar]
- 8. Vogelsgesang M., Pautsch A., Aktories K. (2007) C3 exoenzymes, novel insights into structure and action of Rho-ADP-ribosylating toxins. Naunyn Schmiedebergs Arch. Pharmacol. 374, 347–360 [DOI] [PubMed] [Google Scholar]
- 9. Kabsch W. (2010) XDS. Acta Crystallogr. D Biol. Crystallogr. 10.1107/S0907444909047337 [DOI] [PMC free article] [PubMed] [Google Scholar]
- 10. Adams P. D., Grosse-Kunstleve R. W., Hung L. W., Ioerger T. R., McCoy A. J., Moriarty N. W., Read R. J., Sacchettini J. C., Sauter N. K., Terwilliger T. C. (2002) PHENIX: building new software for automated crystallographic structure determination. Acta Crystallogr. D Biol. Crystallogr. 58, 1948–1954 [DOI] [PubMed] [Google Scholar]
- 11. Emsley P., Cowtan K. (2004) Coot: model-building tools for molecular graphics. Acta Crystallogr. D Biol. Crystallogr. 60, 2126–2132 [DOI] [PubMed] [Google Scholar]
- 12. Armstrong S., Merrill A. R. (2001) Application of a fluorometric assay for characterization of the catalytic competency of a domain III fragment of Pseudomonas aeruginosa exotoxin A. Anal. Biochem. 292, 26–33 [DOI] [PubMed] [Google Scholar]
- 13. Rojas R. J., Kimple R. J., Rossman K. L., Siderovski D. P., Sondek J. (2003) Established and emerging fluorescence-based assays for G-protein function: Ras-superfamily GTPases. Comb. Chem. High Throughput Screen 6, 409–418 [DOI] [PubMed] [Google Scholar]
- 14. Swann S. L., Brown S. P., Muchmore S. W., Patel H., Merta P., Locklear J., Hajduk P. J. (2011) A unified, probabilistic framework for structure- and ligand-based virtual screening. J. Med. Chem. 54, 1223–1232 [DOI] [PubMed] [Google Scholar]
- 15. Friesner R. A., Banks J. L., Murphy R. B., Halgren T. A., Klicic J. J., Mainz D. T., Repasky M. P., Knoll E. H., Shelley M., Perry J. K., Shaw D. E., Francis P., Shenkin P. S. (2004) Glide: a new approach for rapid, accurate docking and scoring. 1. Method and assessment of docking accuracy. J. Med. Chem. 47, 1739–1749 [DOI] [PubMed] [Google Scholar]
- 16. Irwin J. J., Raushel F. M., Shoichet B. K. (2005) Virtual screening against metalloenzymes for inhibitors and substrates. Biochemistry 44, 12316–12328 [DOI] [PubMed] [Google Scholar]
- 17. Fieldhouse R. J., Jørgensen R., Lugo M. R., Merrill A. R. (2012) The 1.8 Å cholix toxin crystal structure in complex with NAD+ and evidence for a new kinetic model. J. Biol. Chem. 287, 21176–21188 [DOI] [PMC free article] [PubMed] [Google Scholar]
- 18. Larkin M. A., Blackshields G., Brown N. P., Chenna R., McGettigan P. A., McWilliam H., Valentin F., Wallace I. M., Wilm A., Lopez R., Thompson J. D., Gibson T. J., Higgins D. G. (2007) Clustal W and Clustal X version 2.0. Bioinformatics 23, 2947–2948 [DOI] [PubMed] [Google Scholar]
- 19. Funfhaus A., Poppinga L., Genersch E. (2013) Identification and characterization of two novel toxins expressed by the lethal honey bee pathogen Paenibacillus larvae, the causative agent of American foulbrood. Environ. Microbiol. 10.1111/1462-2920.12229 [DOI] [PubMed] [Google Scholar]
- 20. Wilde C., Vogelsgesang M., Aktories K. (2003) Rho-specific Bacillus cereus ADP-ribosyltransferase C3cer cloning and characterization. Biochemistry 42, 9694–9702 [DOI] [PubMed] [Google Scholar]
- 21. Coye L. H., Collins C. M. (2004) Identification of SpyA, a novel ADP-ribosyltransferase of Streptococcus pyogenes. Mol. Microbiol. 54, 89–98 [DOI] [PubMed] [Google Scholar]
- 22. Turgeon Z., White D., Jørgensen R., Visschedyk D., Fieldhouse R. J., Mangroo D., Merrill A. R. (2009) Yeast as a tool for characterizing mono-ADP-ribosyltransferase toxins. FEMS Microbiol. Lett. 300, 97–106 [DOI] [PubMed] [Google Scholar]
- 23. Ménétrey J., Flatau G., Stura E. A., Charbonnier J. B., Gas F., Teulon J. M., Le Du M. H., Boquet P., Menez A. (2002) NAD binding induces conformational changes in Rho ADP-ribosylating Clostridium botulinum C3 exoenzyme. J. Biol. Chem. 277, 30950–30957 [DOI] [PubMed] [Google Scholar]
- 24. Böhmer J., Jung M., Sehr P., Fritz G., Popoff M., Just I., Aktories K. (1996) Active site mutation of the C3-like ADP-ribosyltransferase from Clostridium limosum: analysis of glutamic acid 174. Biochemistry 35, 282–289 [DOI] [PubMed] [Google Scholar]
- 25. Vogelsgesang M., Aktories K. (2006) Exchange of glutamine-217 to glutamate of Clostridium limosum exoenzyme C3 turns the asparagine-specific ADP-ribosyltransferase into an arginine-modifying enzyme. Biochemistry 45, 1017–1025 [DOI] [PubMed] [Google Scholar]
- 26. Altschul S. F., Madden T. L., Schäffer A. A., Zhang J., Zhang Z., Miller W., Lipman D. J. (1997) Gapped BLAST and PSI-BLAST: a new generation of protein database search programs. Nucleic Acids Res. 25, 3389–3402 [DOI] [PMC free article] [PubMed] [Google Scholar]
- 27. Yates S. P., Merrill A. R. (2005) Characterization of oxidized nicotinamide adenine dinucleotide (NAD(+)) analogues using a high-pressure-liquid-chromatography-based NAD(+)-glycohydrolase assay and comparison with fluorescence-based measurements. Anal. Biochem. 340, 41–51 [DOI] [PubMed] [Google Scholar]
- 28. Tautzenberger A., Förtsch C., Zwerger C., Dmochewitz L., Kreja L., Ignatius A., Barth H. (2013) C3 rho-inhibitor for targeted pharmacological manipulation of osteoclast-like cells. PLoS One 8, e85695. [DOI] [PMC free article] [PubMed] [Google Scholar]
- 29. Armstrong S., Li J. H., Zhang J., Merrill A. R. (2002) Characterization of competitive inhibitors for the transferase activity of Pseudomonas aeruginosa exotoxin A. J. Enzyme Inhib. Med. Chem. 17, 235–246 [DOI] [PubMed] [Google Scholar]
- 30. Yates S. P., Taylor P. L., Jørgensen R., Ferraris D., Zhang J., Andersen G. R., Merrill A. R. (2005) Structure-function analysis of water-soluble inhibitors of the catalytic domain of exotoxin A from Pseudomonas aeruginosa. Biochem. J. 385, 667–675 [DOI] [PMC free article] [PubMed] [Google Scholar]
- 31. Turgeon Z., Jørgensen R., Visschedyk D., Edwards P. R., Legree S., McGregor C., Fieldhouse R. J., Mangroo D., Schapira M., Merrill A. R. (2011) Newly discovered and characterized antivirulence compounds inhibit bacterial mono-ADP-ribosyltransferase toxins. Antimicrob. Agents Chemother. 55, 983–991 [DOI] [PMC free article] [PubMed] [Google Scholar]
- 32. Visschedyk D., Rochon A., Tempel W., Dimov S., Park H. W., Merrill A. R. (2012) Certhrax toxin, an anthrax-related ADP-ribosyltransferase from Bacillus cereus. J. Biol. Chem. 287, 41089–41102 [DOI] [PMC free article] [PubMed] [Google Scholar]
- 33. Fahrer J., Kuban J., Heine K., Rupps G., Kaiser E., Felder E., Benz R., Barth H. (2010) Selective and specific internalization of clostridial C3 ADP-ribosyltransferases into macrophages and monocytes. Cell Microbiol. 12, 233–247 [DOI] [PubMed] [Google Scholar]
- 34. Goblirsch M. J., Spivak M. S., Kurtti T. J. (2013) A cell line resource derived from honey bee (Apis mellifera) embryonic tissues. PLoS One 8, e69831. [DOI] [PMC free article] [PubMed] [Google Scholar]
- 35. Jørgensen R., Merrill A. R., Yates S. P., Marquez V. E., Schwan A. L., Boesen T., Andersen G. R. (2005) Exotoxin A-eEF2 complex structure indicates ADP ribosylation by ribosome mimicry. Nature 436, 979–984 [DOI] [PubMed] [Google Scholar]
- 36. Gouet P., Courcelle E., Stuart D. I., Metoz F. (1999) ESPript: analysis of multiple sequence alignments in PostScript. Bioinformatics 15, 305–308 [DOI] [PubMed] [Google Scholar]