

Background: Positive transcription elongation factor b (P-TEFb) partitions between free (active) P-TEFb and inactive 7SK small nuclear ribonucleoprotein (snRNP) in cells.
Results: Bimolecular fluorescence complementation (BiFC) detects interactions between active P-TEFb and its C-terminal domain substrate in vivo.
Conclusion: BiFC follows the release of P-TEFb from 7SK snRNP in living cells.
Significance: This system is the first to monitor P-TEFb activation in living cells.
Keywords: 7SK snRNP, drug screening, fluorescence, gene transcription, transcription elongation factor
Abstract
Regulation of transcription elongation by positive transcription elongation factor b (P-TEFb) plays a central role in determining the state of cell activation, proliferation, and differentiation. In cells, P-TEFb exists in active and inactive forms. Its release from the inactive 7SK small nuclear ribonucleoprotein complex is a critical step for P-TEFb to activate transcription elongation. However, no good method exists to analyze this P-TEFb equilibrium in living cells. Only inaccurate and labor-intensive cell-free biochemical assays are currently available. In this study, we present the first experimental system to monitor P-TEFb activation in living cells. We created a bimolecular fluorescence complementation assay to detect interactions between P-TEFb and its substrate, the C-terminal domain of RNA polymerase II. When cells were treated with suberoylanilide hydroxamic acid, which releases P-TEFb from the 7SK small nuclear ribonucleoprotein, they turned green. Other known P-TEFb-releasing agents, including histone deacetylase inhibitors, bromodomain and extraterminal bromodomain inhibitors, and protein kinase C agonists, also scored positive in this assay. Finally, we identified 5′-azacytidine as a new P-TEFb-releasing agent. This release of P-TEFb correlated directly with activation of human HIV and HEXIM1 transcription. Thus, our visualization of P-TEFb activation by fluorescent complementation assay could be used to find new P-TEFb-releasing agents, compare different classes of agents, and assess their efficacy singly and/or in combination.
Introduction
By phosphorylating the C-terminal domain (CTD)2 of RNA polymerase II (RNAPII) and other transcription elongation factors, the positive transcription elongation factor b (P-TEFb) plays a critical role in eukaryotic transcription elongation (1, 2). In cells, P-TEFb, composed of CDK9 (cyclin-dependent kinase 9) and cyclin T1 or T2, exists in two major forms (3). The catalytically active P-TEFb (free P-TEFb) binds BRD4 (bromodomain-containing protein 4), subunits of the super elongation complex, or other DNA- or RNA-bound activators (4–6). In contrast, P-TEFb bound to the 7SK small nuclear ribonucleoprotein (snRNP) is inactive. Other than P-TEFb, 7SK snRNP also incorporates HEXIM1 (hexamethylene bisacetamide-inducible protein 1) or HEXIM2, LaRP7 (La-related protein 7), methyl phosphate-capping enzyme, and 7SK snRNA (7SK) (7–9). In the 7SK snRNP, HEXIM proteins inhibit the kinase activity of CDK9. Depending on the cell type, 50–90% of P-TEFb is found in the 7SK snRNP (3, 10). This P-TEFb equilibrium determines the state of cell activation, proliferation, and differentiation. Many stresses (such as UV light; heat; inhibition of transcription by actinomycin D, 5,6-dichloro-1-β-d-ribofuranosylbenzimidazole, or flavopiridol; histone deacetylase (HDAC) inhibitors, including trichostatin and suberoylanilide hydroxamic acid (SAHA); PKC agonists; and bromodomain and extraterminal (BET) bromodomain inhibitors) and specific intracellular signaling cascades release P-TEFb from the 7SK snRNP (3, 10, 11). Once released from 7SK snRNP, P-TEFb is recruited to the transcription machinery, where P-TEFb phosphorylates 5,6-dichloro-1-β-d-ribofuranosylbenzimidazole sensitivity-inducing factor, negative elongation factor, and the CTD of RNAPII, leading to transcription elongation. The C-terminal histidine-rich domain of P-TEFb interacts directly with the CTD to facilitate its phosphorylation, which represents a mechanism by which DNA-bound activators, such as NF-κB and c-Myc, increase their target gene expression (12, 13). Finally, the P-TEFb equilibrium also regulates HIV transcription in cells. Indeed, all known HDAC inhibitors that activate HIV transcription also release P-TEFb from 7SK snRNP (14). Thus, it is important to identify and analyze compounds that release P-TEFb from the 7SK snRNP to develop therapeutic agents for highly active anti-latency therapy.
Because P-TEFb release affects cellular and viral transcription, it is critical to measure this step accurately. To date, free P-TEFb and 7SK snRNP can be separated only biochemically in cell lysates. Methods include glycerol gradient centrifugation, co-immunoprecipitation between 7SK snRNP subunits, gel filtration, RNA immunoprecipitation between P-TEFb and 7SK, and differential salt extractions (3, 15–19). These approaches are labor-intensive and inaccurate. A real-time analysis of P-TEFb release in living cells would contribute greatly to any investigation relating to transcription and cell fate.
To develop such a cell-based assay to monitor this P-TEFb release in living cells, we developed a bimolecular fluorescence complementation (BiFC) assay using complementary fragments of fluorescent proteins, such as an N-terminal region (amino acids 1–154; termed YN) and a C-terminal region (amino acids 155–238; termed YC) of YFP (20). Because released and activated P-TEFb interacts with and phosphorylates its substrates, we employed P-TEFb and the CTD as fusion partners of YC and YN, respectively (12, 18). Conventional biochemical assays confirmed that the exogenously expressed chimeric P-TEFb proteins fused with YC (YC.P-TEFb) were incorporated into the 7SK snRNP and released upon stimulation. When YC.P-TEFb was coexpressed with the CTD fused with YN (YN.CTD) in unstimulated cells, weak BiFC signals were detected. When these cells were treated with P-TEFb-releasing stimuli, BiFC signals increased in a time-dependent manner, which was monitored by time-lapse image capture on a fluorescence microscope. Other known P-TEFb-releasing agents (HDAC inhibitors, BET inhibitors, PKC agonists, etc.) all scored positive in this assay, which we have named visualization of P-TEFb activation by fluorescent complementation (V-PAC). Importantly, using the same methodology, we identified 5-azacytidine (AzaC) as a potent P-TEFb-releasing agent. This P-TEFb release activated HIV and HEXIM1 transcription. We conclude that V-PAC is the first method capable of monitoring P-TEFb activation quantitatively in living cells. It can measure the activity of known P-TEFb-releasing agents and be used to screen for yet unknown P-TEFb activators. Therefore, it may prove invaluable in the development therapeutic approaches for diseases such as AIDS and cancer, in which the activity of P-TEFb plays a major role.
EXPERIMENTAL PROCEDURES
Cell Lines, Antibodies, and Chemicals
HeLa, NH1, or HEK293 cells were grown in DMEM containing 10% FCS at 37 °C with 5% CO2. Rabbit anti-c-Myc (ab9106) and anti-phosphorylated CTD (ab5095) antibodies were purchased from Abcam. Rabbit anti-cyclin T1 (CycT1; sc-10750), anti-RNAPII (N20, sc-899), and mouse anti-HEXIM1 (sc-81285) antibodies were purchased from Santa Cruz Biotechnology. Rabbit anti-GFP antibody (20R-GR011) was purchased from Fitzgerald. SAHA (S1047) and tubastatin A (S2627) were purchased from Selleck Chemicals, and hexamethylene bisacetamide (HMBA; H4663) and AzaC (A2385) were purchased from Sigma. JQ1 was obtained from Dr. James Bradner (Dana-Farber Cancer Institute) and via the Martin Delaney Collaboratory. ST80 was a kind gift from Dr. Manfred Jung (University of Freiburg). To make stock solutions, SAHA, tubastatin A, ST80, JQ1, phorbol 12-myristate 13-acetate, and bryostatin-1 were dissolved in dimethyl sulfoxide, and HMBA was dissolved in H2O.
Plasmids
Sequences encoding amino acids 1–154 (YN) and 155–238 (YC) of YFP were amplified and cloned in pEF-Bos mammalian expression plasmids (pEF.YN, and pEF.YC, respectively). The YN.CTD chimera was constructed by inserting DNA fragments amplified from pGST.CTD (12) with a linker sequence encoding a nuclear localization signal (NLS; KRPAATKKAGQAKKKK) (21) from nucleoplasmin on its N terminus into the BamHI and EcoRI sites of pEF.YN. The YC.P-TEFb chimera was constructed by inserting DNA fragments corresponding to P-TEFb (11, 22) into the BamHI and EcoRI sites of pEF.YC. All proteins contained an anti-c-Myc antibody epitope tag at the N termini, and their expression in cells was confirmed by Western blotting using an anti-c-Myc antibody (see Fig. 1).
FIGURE 1.

YC.P-TEFb can be incorporated into the 7SK snRNP and released by SAHA. A, expressed proteins used in this study. Half-ovals represent the N-terminal (amino acids 1–154; YN) and C-terminal (amino acids 155–238; YC) portions of YFP. YC alone was used as the negative control. Black circles represent heptapeptide repeats (YSPTSPS) of the RNAPII CTD. The black rectangle represents the NLS from nucleoplasmin. m, c-Myc epitope tag. B, expression of YC.P-TEFb and YN.CTD in HEK293 cells. The expression of these proteins was detected by Western blotting (WB) using anti-c-Myc, anti-GFP, and anti-phosphorylated CTD (αP-CTD) antibodies. CTDo and CTDa represent hyper- and hypophosphorylated forms of the CTD. The estimated sizes of expressed proteins are indicated. C, YC.P-TEFb is incorporated into the 7SK snRNP and released upon SAHA stimulation. HEK293 cells expressing YC.P-TEFb were left untreated or were treated with 5 μm SAHA for 1 h before cell lysis. Cell lysates were subjected to 10–30% glycerol gradient centrifugation, and YC.P-TEFb and the endogenous CycT1 (eCycT1) protein in each fraction (indicated by arrows) were detected by Western blotting using anti-c-Myc and anti-CycT1 antibodies, respectively. D, after SAHA administration, the association between YC.P-TEFb and HEXIM1 is reduced, whereas it is increased between YC.P-TEFb and RNAPII. HEK293 cells expressing YC.P-TEFb were left untreated (lanes 1, 3, 5, 7, and 8) or were treated with SAHA at 5 μm for 1 h before cell lysis (lanes 2, 4, and 6). YC.P-TEFb (lanes 1 and 2) and endogenous RNAPII (lanes 5 and 6) were immunoprecipitated (IP) from cell lysates with anti-c-Myc and anti-RNAPII antibodies, respectively. HEXIM1 (lanes 1 and 2) and YC.P-TEFb (lanes 5 and 6) associated with the immunoprecipitates were detected by Western blotting using anti-HEXIM1 and anti-c-Myc antibodies, respectively. HEXIM1 (lanes 3 and 4) and YC.P-TEFb (lane 8) proteins in 5% of input lysate were also detected.
Fluorescence Microscopic Analysis
HeLa or HEK293 cells (1 × 10⁶) growing in log phase on 6-well plates were transfected with 0.2 μg of plasmid DNA encoding YC fusion proteins and 2 μg of plasmid DNA encoding YN fusion proteins, respectively, using X-tremeGENE transfection reagent (Roche Applied Science). Twenty-four hours after transfection, the cells were split into 6–8 wells on 24-well plates and kept in 5% FCS for an additional 24–48 h. The cells were then incubated with the indicated compounds for varying times. Fluorescent signals were detected by microscopic analysis using an Olympus IX70 bright-field fluorescence microscope. The fluorescent images were analyzed using MetaMorph software, and YFP-positive cells were manually counted and averaged from three randomly chosen fields of each sample.
Time-lapse Microscopic Analysis
A time-dependent increase in BiFC signals was monitored by time-lapse fluorescence microscopic analysis. HEK293 cells expressing YC.P-TEFb and YN.CTD were cultured on a collagen-coated 22-mm diameter coverslip (BD Biosciences). The coverslip was placed in a single-well sample chamber attached to a thermal controller (Brooks Instrument) that maintained the cells at 37 °C on a fluorescence microscope. The cells were stimulated with SAHA at 5 μm, and fluorescent images were taken every 3 min. Images were analyzed, and video clips were created using MetaMorph software.
Glycerol Gradient
Glycerol gradients (10–30%) were established by pipetting 2 ml of each glycerol fraction (10, 15, 20, 25, and 30% (v/v)) in buffer A (20 mm HEPES-KOH (pH 7.8), 0.2 m KCl, 0.2 mm EDTA, and 0.5% Nonidet P-40) into centrifugation tubes (Beckman 331372). Gradients were formed by standing for 6 h at 4 °C. HEK293 cells (2 × 10⁶) were transfected with YC.P-TEFb plasmid DNA (2 μg) using Lipofectamine 2000 (Invitrogen). Forty-eight hours after transfection, the cells were left untreated or were treated with 5 μm SAHA for 1 h and lysed in 0.6 ml of buffer A for 30 min at 4 °C. Lysates were centrifuged at 14,000 rpm for 10 min, and supernatants were loaded into tubes with preformed glycerol gradients. Protein complexes were then fractionated by centrifugation in a Beckman SW 40 Ti rotor at 38,000 rpm for 21 h. Ten fractions (1 ml) were collected, precipitated with trichloroacetic acid, and analyzed with the indicated antibodies by Western blotting.
Co-immunoprecipitation
HEK293 cells (5 × 10⁶) were transfected with YC.P-TEFb plasmid DNA (2 μg) using Lipofectamine 2000. Twenty-four hours after transfection, the cells were left untreated or were treated with 5 μm SAHA for 1 h and lysed on ice (10 min) in buffer A. The cell lysates were centrifuged at 14,000 rpm for 10 min at 4 °C, and the supernatants were collected. Supernatants were then precleared with protein A-Sepharose beads (Invitrogen) for 1 h at 4 °C. Precleared lysates were incubated with 1 μg of the appropriate antibodies overnight at 4 °C. The lysates were then centrifuged at 14,000 rpm for 5 min at 4 °C, and supernatants were incubated with protein A-Sepharose beads for 1 h at 4 °C. Beads were washed five times with 800 μl of buffer A, and immunoprecipitated complexes were boiled in SDS sample buffer and analyzed by Western blotting.
RESULTS
Hybrid YC.P-TEFb Proteins Are Incorporated into the 7SK snRNP and Released by SAHA
Originally described by Kerppola (20), BiFC is based on the formation of active fluorophore by complementary fragments of a fluorescent protein. In this assay, YN and YC are fused with proteins or protein fragments to test their interactions. When YN and YC are brought to close proximity via association between the fusion partners, they form an active fluorophore, allowing protein-protein interactions to be visualized in living cells (20). This process occurs within a few minutes to 1 h (23). To detect active P-TEFb by BiFC, we employed P-TEFb and the RNAPII CTD, which were fused with YC and YN, respectively (Fig. 1A). Previously, we demonstrated that the chimeric CDK9.CycT1 protein is folded into a biologically functional P-TEFb complex (22, 24). P-TEFb interacts with the CTD via its CycT1 subunit (12). Unfused YC was used as the negative control (Fig. 1A). A c-Myc epitope tag was added for detection. Because phosphorylation of the CTD by P-TEFb occurs in the nucleus, a NLS from nucleoplasmin was included in the hybrid YN.CTD protein (21). CycT1 already contains a strong NLS (25). Fig. 1A illustrates our plasmid constructions. These chimeric proteins were expressed in HEK293 cells by transient transfection and detected by Western blotting (Fig. 1B).
As expected, because the CTD can be phosphorylated in cells, YN.CTD was found in two major bands detected by anti-GFP and anti-phosphorylated CTD antibodies, corresponding to the hyperphosphorylated (Fig. 1B, lane 2, upper band) and hypophosphorylated (lower band) forms of the CTD. These antibodies detect both forms of the CTD (26). Next, we examined whether YC.P-TEFb can be incorporated into the 7SK snRNP. YC.P-TEFb was expressed in HEK293 cells by transient transfection. Forty-eight hours after transfection, cells were left untreated or were treated with SAHA at 5 μm for 1 h, and cell lysates were subjected to glycerol gradient analysis. YC.P-TEFb and the endogenous CycT1 protein were detected with anti-c-Myc and anti-CycT1 antibodies, respectively. As shown in Fig. 1C, the ectopically expressed YC.P-TEFb protein was detected in 7SK snRNP fractions (upper panels, lanes 8–10), just like the endogenous CycT1 protein (lower panels, lanes 8–10). SAHA treatment reduced the amounts of YC.P-TEFb and endogenous CycT1 proteins in 7SK snRNP fractions and increased the levels of free P-TEFb (Fig. 1C, lanes 4–6). To further confirm that ectopically expressed YC.P-TEFb can be incorporated into the 7SK snRNP and released from it by P-TEFb-stimulating stimuli, interactions between YC.P-TEFb and the endogenous HEXIM1 protein or RNAPII were examined by co-immunoprecipitation (Fig. 1D). YC.P-TEFb was immunoprecipitated by anti-c-Myc antibodies from untreated cells or cells stimulated with 5 μm SAHA for 1 h. HEXIM1 associated with YC.P-TEFb was detected with anti-HEXIM1 antibodies by Western blotting. Similarly, RNAPII was immunoprecipitated with anti-RNAPII antibodies, and the associated YC.P-TEFb was detected with anti-c-Myc antibodies. Interactions between YC.P-TEFb and the endogenous HEXIM1 protein were also decreased when cells were treated with SAHA (Fig. 1D, compare lanes 1 and 2), confirming our glycerol gradient data. Concomitantly, interactions between YC.P-TEFb and endogenous RNAPII were increased by SAHA (Fig. 1D, compare lanes 5 and 6). Therefore, exogenous YC.P-TEFb and endogenous P-TEFb proteins can be incorporated into the 7SK snRNP and released by P-TEFb-releasing stimuli.
Establishment of BiFC Assays to Monitor P-TEFb Activation in Cells
When cells are treated with P-TEFb-releasing agents, P-TEFb dissociates rapidly from the 7SK snRNP, which liberates its kinase activity (3, 27). Depending on the stimulus, this process occurs within a few minutes to 1 h. As shown in Fig. 2A, we created the BiFC assay to detect interactions between released free P-TEFb and its natural substrate, the CTD. When YC.P-TEFb was coexpressed with YN.CTD in HEK293 cells under normal culture conditions, very few weakly YFP-positive cells were detected (Fig. 2B). Surprisingly, when cells were stimulated with known P-TEFb-releasing agents, such as HMBA and SAHA (28, 29), the number of YFP-positive increased significantly (Fig. 2B). Because the emission peak of YFP (527 nm) is similar to that of GFP (509 nm), the BiFC-positive cells appeared green (Fig. 2B). In sharp contrast, when cells were treated with tubastatin A, a potent selective HDAC inhibitor that has no effect on P-TEFb release (14), the number of YFP-positive cells did not increase (Fig. 2B). In addition, YN.CTD did not produce any fluorescence when coexpressed with YC as the negative control (Fig. 2B), confirming the specificity of the BiFC signal. Therefore, we employed YC.P-TEFb to monitor P-TEFb activation by BiFC in cells. An observation of YFP-positive cells at a higher magnification revealed that our fluorescent signals accumulated in punctate nuclear structures in a speckle pattern (Fig. 2C), which is consistent with previous observations of P-TEFb nuclear localization (30, 31).
FIGURE 2.

BiFC signal between YC. P-TEFb and YN.CTD increases upon P-TEFb release. A, schematic representation of monitoring P-TEFb activation by BiFC. YC.P-TEFb incorporated into the 7SK snRNP is released upon treatment with a P-TEFb-releasing agent and binds to its substrate YN.CTD to form active YFP via BiFC. MePCE, methyl phosphate-capping enzyme. B, BiFC signal between YC.P-TEFb and YN.CTD increases with known P-TEFb-releasing stimuli. Cells expressing YC and YN.CTD (left panels) or YC.P-TEFb and YN.CTD (right panels) were left untreated or were treated with HMBA (10 mm), SAHA (5 μm), or tubastatin A (TBSA; 5 μm) for 1 h. YFP-positive cells were detected under a fluorescence microscope. Bright-field images were also taken to show the shape of the cells. C, a higher magnitude image of a YFP-positive cell indicated that the BiFC between YC.P-TEFb and YN.CTD occurs in nuclear speckles.
Time-lapse Analysis of P-TEFb Activation by V-PAC
A time-dependent increase in BiFC signals was monitored by time-lapse fluorescence microscopic analysis. HEK293 cells expressing YC.P-TEFb and YN.CTD were treated with 5 μm SAHA, and fluorescent images were taken every 3 min. As shown in Fig. 3, the BiFC signals were detected by 30 min after the addition of SAHA and reached a peak at a time point between 75 and 90 min. At later times, more intense and punctate nuclear staining reflected the accumulation of active P-TEFb in nuclear speckles (Fig. 2C) (30, 31). This finding is consistent with our previous observations of P-TEFb release by SAHA with a consideration of the time required for maturation of the fluorophore (23). Similar results were obtained with other P-TEFb-releasing agents, such as HMBA and JQ1 (data not shown).
FIGURE 3.
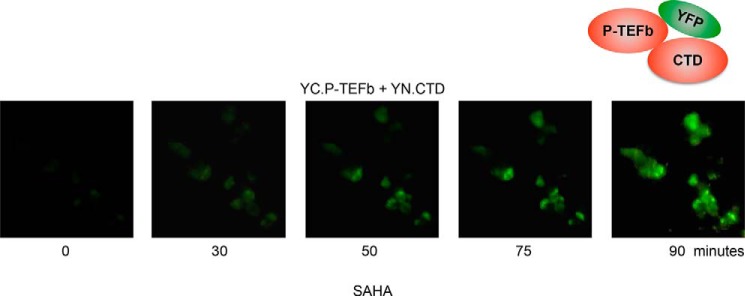
Time course analysis of V-PAC. HEK293 cells expressing YC.P-TEFb and YN.CTD were treated with 5 μm SAHA. Time-dependent changes in BiFC were monitored by fluorescence microscopy, and fluorescent images were taken every 3 min.
Other Known P-TEFb-releasing Stimuli Also Score Positive in Our V-PAC Assays
Besides SAHA, JQ1, and HMBA, P-TEFb release had been observed with other HDAC inhibitors, such as ST80, as well as PKC agonists, such as phorbol 12-myristate 13-acetate and bryostatin-1 (14, 32). We also examined AzaC, which was previously thought to inhibit only cytidine methylation during DNA replication (33). However, many effects of AzaC had been observed prior to cell division. Importantly, AzaC was thought to have no effect on P-TEFb release.
Equivalent numbers of HEK293 cells expressing YC.P-TEFb and YN.CTD from the same transfection were split into individual wells, to which a different test compound was administered. Cells were treated for 1 h, and YFP-positive cells were counted manually and averaged from three randomly chosen areas. At least 100 cells were counted in each area. Next, the total number of YFP-positive cells from each treatment was divided by the number of YFP-positive cells in untreated cells and plotted as relative P-TEFb activation. Thus, given the constant transfection efficiency in all samples, the ratio of positive cells represents a rough estimate of the relative potency of each compound. As shown in Fig. 4A (bars 2–4 and 6–8), all known P-TEFb-releasing agents examined scored positive in this assay. Again, tubastatin A stimulation did not increase the number of YFP-positive cells (Fig. 4A, bar 5). Interestingly, AzaC also scored in this assay (Fig. 4A, bar 9). To further confirm that the compounds scored in the V-PAC assay also stimulated P-TEFb activity, the same set of the compounds was tested in a reporter assay using NH1 cells, which are HeLa cells that stably express the luciferase reporter gene under the control of the HIV long terminal repeat. We demonstrated previously that compounds that release P-TEFb also activate HIV transcription (14, 32). As shown Fig. 4B, whereas compounds that scored in the V-PAC assay (HMBA, SAHA, ST80, JQ1, PKC, bryostatin-1, and AcaZ) also activated this reporter gene expression (Fig. 4B, bars 2–4 and 6–8), tubastatin A failed to do so (bar 5). We concluded that our V-PAC assay is a useful tool for measuring P-TEFb activation in living cells.
FIGURE 4.
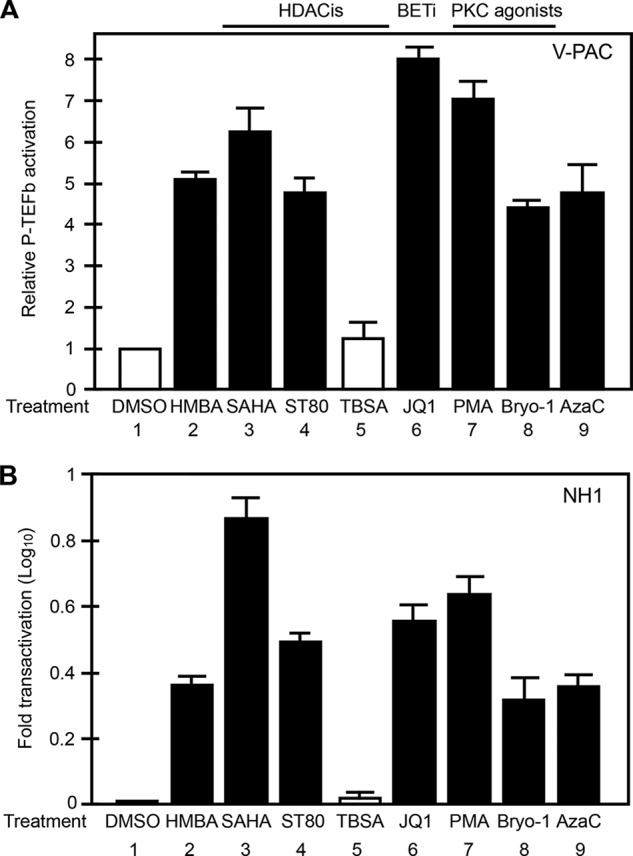
Other known P-TEFb-releasing stimuli all score in our V-PAC assay. A, HEK293 cells expressing YC.P-TEFb and YN.CTD were left untreated (bar 1) or were treated with the compounds indicated below the graph for 1 h. YFP-positive cells were counted and averaged from three different areas. After each treatment, the number of YFP-positive cells was divided by that in untreated cells and plotted as relative P-TEFb activation. Classes of P-TEFb-releasing agents are indicated above the graph. HDACis, HDAC inhibitors; BETi, BET inhibitor; DMSO, dimethyl sulfoxide; TBSA, tubastatin A; PMA, phorbol 12-myristate 13-acetate; Bryo-1, bryostatin-1. Error bars represent differences between counts of YFP-positive cells from three randomly chosen fields under the microscope. B, NH1 cells were left untreated or were treated with the compounds indicated below the graph for 24 h, and reporter gene expression was measured by luciferase assays. Results are presented as -fold activation over levels obtained with untreated cells. Error bars represent S.E. of experiments performed in triplicate.
Confirmation of AzaC as a New P-TEFb-releasing Agent
AzaC is an analog of cytidine, and it inhibits cell proliferation via incorporation into DNA (33). It has also demonstrated that AzaC activates HIV transcription potently in latently infected cells (34–36). Of note, we demonstrated previously that many agents that activate HIV transcription in latently infected cells also release P-TEFb from the 7SK snRNP (11, 14). Therefore, it was not very surprising that AzaC also released P-TEFb from the 7SK snRNP (Fig. 4A, bar 9), although the precise molecular mechanism of P-TEFb release is currently unknown. The effect of AzaC on P-TEFb release was further confirmed by conventional glycerol gradient assays. HeLa cells were left untreated or were treated with 10 μm AzaC for 1 h, and cell lysates were subjected to glycerol gradient analysis. As shown Fig. 5 (A and B), AzaC released P-TEFb from the 7SK snRNP. The effects of AzaC on P-TEFb-dependent transcription were tested further by reporter assays. Previously, we demonstrated that the HEXIM1 promoter is most responsive to active free P-TEFb; the P-TEFb-responsive region contains 104 nucleotides upstream of the transcription start site (37). This HEXIM1 promoter, HexP(104) was linked to the luciferase reporter gene and introduced stably into HeLa cells to establish HeLa/HexP.Luc cells. These HeLa/HexP.Luc cells were left untreated or were treated with 10 μm AzaC for 24 h, and their luciferase activity was measured. As shown Fig. 5C, AzaC stimulated luciferase activity by 5-fold, which is similar to levels achieved by HMBA (37). These results were consistent with AzaC-increased BiFC signals in the V-PAC assay (Fig. 5D). We conclude that AzaC is a new P-TEFb-releasing agent.
FIGURE 5.

AzaC is a P-TEFb-releasing agent. A, P-TEFb release by glycerol gradient centrifugation. HeLa cells were left untreated (upper panel) or were treated with 10 μm AzaC for 1 h (lower panel), and cell lysates were subjected to 10–30% glycerol gradient centrifugation. CycT1 from each fraction was detected by Western blotting using anti-CycT1 antibodies. B, band intensities of free (active) CycT1 (lanes 3–6) and CycT1 in the 7SK snRNP (lanes 7–10) were quantified and combined. Ratios between free CycT1 and CycT1 in 7SK snRNP were calculated and plotted. C, increased expression from the HEXIM1 promoter accompanies P-TEFb release by AzaC. HeLa cells stably expressing the HexP(104)-Luc reporter gene were left untreated or were treated with 10 μm AzaC for 24 h, and reporter gene expression was measured by luciferase assays. Results are presented as -fold activation over levels obtained with untreated cells. Error bars represent S.E. of experiments performed in triplicate. D, V-PAC assay of AzaC-treated cells. HEK293 cells expressing YC.P-TEFb and YN.CTD were left untreated (upper panels) or were treated with 10 μm AzaC for 1 h (lower panels). YFP-positive cells were detected by fluorescence microscopy (left panels). Bright-field images were also taken (right panels).
DISCUSSION
In this study, we established the first experimental system to monitor P-TEFb activation in living cells. This assay (V-PAC) employs BiFC between P-TEFb and its CTD substrate. First, by using conventional cell-free assays, we demonstrated that YC.P-TEFb was incorporated into the 7SK snRNP and released upon cell stimulation. When YC.P-TEFb was coexpressed with YN.CTD in cells under normal culture conditions, very few YFP-positive cells were detected. In sharp contrast, when cells were treated with SAHA, a potent P-TEFb-releasing agent, the number of YFP-positive cells increased rapidly. Moreover, other known P-TEFb-releasing agents all scored positively in this assay. Finally, using this assay, we identified AzaC as a new P-TEFb-releasing agent.
To establish BiFC assays between P-TEFb and CTD, we also examined whether YC fused with each component (CDK9 or CycT1) of P-TEFb produced BiFC signals with YN.CTD. Indeed, both produced BiFC signals, but they were less efficient than those observed with YC.P-TEFb and YN.CTD (data not shown). Therefore, we employed YC.P-TEFb to monitor P-TEFb activation in living cells. After careful titrations in different cell lines, 1:5 to 1:10 ratios between plasmids encoding YC.P-TEFb and YN.CTD gave the best stimulation-dependent BiFC signals versus background fluorescence (data not shown). One way to avoid such titrations in different cell lines would be to establish cells stably expressing our chimeric YC.P-TEFb and YN.CTD proteins, which is ongoing. Nevertheless, the transient expression of these proteins is sufficient to detect P-TEFb activation upon cell stimulation. Another possible approach to improve the system would be to use a more potent fluorescent protein. For instance, the fluorescent signal can be potentiated up to 1000-fold by introducing four point mutations into YFP, which creates the Venus fluorescent protein, which has also been used for BiFC assays (38). The one caveat with Venus is that it often results in higher background fluorescence due to nonspecific interactions (23). Nevertheless, Venus could become useful for detecting P-TEFb activation in cells with lower transfection efficiencies, such as T cells or other peripheral blood mononuclear cells.
Because interactions between kinases and their substrate are considered to be transient and because kinases dissociate upon phosphorylating their substrates, it is somewhat surprising that a kinase (P-TEFb) and its substrate (CTD) produce such a strong BiFC signal. Nevertheless, we demonstrated previously that P-TEFb does form a stable complex with the CTD (12). This finding could be due to the large number of substrate residues, i.e. serines at position 2 in the CTD (39, 40). In addition, once the BiFC fluorophore is formed, it stabilizes itself, resulting in a much slower dissociation rate (23). Therefore, once YC.P-TEFb binds to YN.CTD, it produces sustainable BiFC signals.
The release of P-TEFb from the 7SK snRNP is a necessary step to activate HIV transcription from latently infected cells (5, 41, 42). Successful HDAC inhibitors, BET inhibitors, and PKC agonists all accomplish this feat. Indeed, HDAC inhibitors that fail to do so (e.g. tubastatin A) do not induce HIV transcription (Fig. 4B) (14). BET inhibitors and PKC agonists release P-TEFb as well (11, 15, 32). In this study, we added AzaC to the list of known P-TEFb-releasing agents. These increased levels of free P-TEFb represent the cellular response to different forms of DNA and/or chromatin stress. Because their effects on DNA and/or chromatin vary, they could also act synergistically to activate HIV transcription from latently infected cells. Our V-PAC assay is ideally suited to monitor single agents and combinations of compounds and measure their impact on P-TEFb release in living cells.
Cellular transcriptional programs in which P-TEFb is a master switch regulate cell growth, proliferation, and differentiation. Components of the 7SK snRNP also play critical roles in gene expression during stem cell differentiation and in cancer (43–49). Moreover, increased P-TEFb activity and the subsequent synthesis of its inhibitor HEXIM1 represent critical common steps for many anti-cancer and anti-inflammatory drugs (27, 37, 50). Importantly, it is this reassembly of the 7SK snRNP following the increased synthesis of HEXIM1 that causes proliferating cells to differentiate and rapidly dividing cells to arrest and undergo apoptosis. Thus, the V-PAC assay will reveal compounds that can be used against inflammation and cancer and for HIV reactivation. It could be adapted to high-throughput screening systems to identify new P-TEFb-releasing agents. Importantly, this system can be adapted to all cells, including primary patients' cells, which will also allow for the screening of compounds that arrest, kill, and/or terminally differentiate these cells. By using more potent fluorescent proteins such as Venus, the V-PAC assay could also be introduced into model animals to monitor P-TEFb release in specific tissues during different developmental steps or disease stages. Moreover, the V-PAC system could also be established in primary cells derived from individual patients to measure the efficacy of various drugs in different patients, which would optimize personalized medicine.
Acknowledgments
We thank Drs. Manfred Jung and James Bradner for reagents. We also thank members of the Peterlin laboratory for helpful discussions.
This work was supported, in whole or in part, by National Institutes of Health CARE Center Grant U19 AI096113 and HARC Center Grants P50 GM082250 and AI1049104 (to B. M. P.). This work was also supported by American Foundation of AIDS Research Grant 108241-51-RGRL and California HIV/AIDS Research Program Grant ID13-SF-558 (to K. F.).
- CTD
- C-terminal domain
- RNAPII
- RNA polymerase II
- P-TEFb
- positive transcription elongation factor b
- snRNP
- small nuclear ribonucleoprotein
- HDAC
- histone deacetylase
- SAHA
- suberoylanilide hydroxamic acid
- BET
- bromodomain and extraterminal
- BiFC
- bimolecular fluorescence complementation
- V-PAC
- visualization of P-TEFb activation by fluorescent complementation
- AzaC
- 5-azacytidine
- CycT1
- cyclin T1
- HMBA
- hexamethylene bisacetamide
- NLS
- nuclear localization signal.
REFERENCES
- 1. Peterlin B. M. (2010) Transcription elongation takes central stage: the P-TEFb connection. Cell Cycle 9, 2933–2934 [DOI] [PubMed] [Google Scholar]
- 2. Price D. H. (2008) Poised polymerases: on your mark … get set … go! Mol. Cell 30, 7–10 [DOI] [PubMed] [Google Scholar]
- 3. Zhou Q., Yik J. H. (2006) The Yin and Yang of P-TEFb regulation: implications for human immunodeficiency virus gene expression and global control of cell growth and differentiation. Microbiol. Mol. Biol. Rev. 70, 646–659 [DOI] [PMC free article] [PubMed] [Google Scholar]
- 4. Brès V., Yoh S. M., Jones K. A. (2008) The multi-tasking P-TEFb complex. Curr. Opin. Cell Biol. 20, 334–340 [DOI] [PMC free article] [PubMed] [Google Scholar]
- 5. Ott M., Geyer M., Zhou Q. (2011) The control of HIV transcription: keeping RNA polymerase II on track. Cell Host Microbe 10, 426–435 [DOI] [PMC free article] [PubMed] [Google Scholar]
- 6. He N., Liu M., Hsu J., Xue Y., Chou S., Burlingame A., Krogan N. J., Alber T., Zhou Q. (2010) HIV-1 Tat and host AFF4 recruit two transcription elongation factors into a bifunctional complex for coordinated activation of HIV-1 transcription. Mol. Cell 38, 428–438 [DOI] [PMC free article] [PubMed] [Google Scholar]
- 7. Yik J. H., Chen R., Nishimura R., Jennings J. L., Link A. J., Zhou Q. (2003) Inhibition of P-TEFb (CDK9/cyclin T) kinase and RNA polymerase II transcription by the coordinated actions of HEXIM1 and 7SK snRNA. Mol. Cell 12, 971–982 [DOI] [PubMed] [Google Scholar]
- 8. Michels A. A., Nguyen V. T., Fraldi A., Labas V., Edwards M., Bonnet F., Lania L., Bensaude O. (2003) MAQ1 and 7SK RNA interact with CDK9/cyclin T complexes in a transcription-dependent manner. Mol. Cell. Biol. 23, 4859–4869 [DOI] [PMC free article] [PubMed] [Google Scholar]
- 9. Krueger B. J., Jeronimo C., Roy B. B., Bouchard A., Barrandon C., Byers S. A., Searcey C. E., Cooper J. J., Bensaude O., Cohen E. A., Coulombe B., Price D. H. (2008) LARP7 is a stable component of the 7SK snRNP while P-TEFb, HEXIM1 and hnRNP A1 are reversibly associated. Nucleic Acids Res. 36, 2219–2229 [DOI] [PMC free article] [PubMed] [Google Scholar]
- 10. Peterlin B. M., Brogie J. E., Price D. H. (2012) 7SK snRNA: a noncoding RNA that plays a major role in regulating eukaryotic transcription. Wiley Interdiscip. Rev. RNA 3, 92–103 [DOI] [PMC free article] [PubMed] [Google Scholar]
- 11. Bartholomeeusen K., Xiang Y., Fujinaga K., Peterlin B. M. (2012) BET bromodomain inhibition activates transcription via a transient release of P-TEFb from 7SK snRNP. J. Biol. Chem. 287, 36609–36616 [DOI] [PMC free article] [PubMed] [Google Scholar]
- 12. Taube R., Lin X., Irwin D., Fujinaga K., Peterlin B. M. (2002) Interaction between P-TEFb and the C-terminal domain of RNA polymerase II activates transcriptional elongation from sites upstream or downstream of target genes. Mol. Cell. Biol. 22, 321–331 [DOI] [PMC free article] [PubMed] [Google Scholar]
- 13. Peterlin B. M., Price D. H. (2006) Controlling the elongation phase of transcription with P-TEFb. Mol. Cell 23, 297–305 [DOI] [PubMed] [Google Scholar]
- 14. Bartholomeeusen K., Fujinaga K., Xiang Y., Peterlin B. M. (2013) HDAC inhibitors that release positive transcription elongation factor b (P-TEFb) from its inhibitory complex also activate HIV transcription. J. Biol. Chem. 288, 14400–14407 [DOI] [PMC free article] [PubMed] [Google Scholar]
- 15. Kim Y. K., Mbonye U., Hokello J., Karn J. (2011) T-cell receptor signaling enhances transcriptional elongation from latent HIV proviruses by activating P-TEFb through an ERK-dependent pathway. J. Mol. Biol. 410, 896–916 [DOI] [PMC free article] [PubMed] [Google Scholar]
- 16. Biglione S., Byers S. A., Price J. P., Nguyen V. T., Bensaude O., Price D. H., Maury W. (2007) Inhibition of HIV-1 replication by P-TEFb inhibitors DRB, seliciclib, and flavopiridol correlates with release of free P-TEFb from the large, inactive form of the complex. Retrovirology 4, 47. [DOI] [PMC free article] [PubMed] [Google Scholar]
- 17. Michels A. A., Fraldi A., Li Q., Adamson T. E., Bonnet F., Nguyen V. T., Sedore S. C., Price J. P., Price D. H., Lania L., Bensaude O. (2004) Binding of the 7SK snRNA turns the HEXIM1 protein into a P-TEFb (CDK9/cyclin T) inhibitor. EMBO J. 23, 2608–2619 [DOI] [PMC free article] [PubMed] [Google Scholar]
- 18. Nguyen V. T., Kiss T., Michels A. A., Bensaude O. (2001) 7SK small nuclear RNA binds to and inhibits the activity of CDK9/cyclin T complexes. Nature 414, 322–325 [DOI] [PubMed] [Google Scholar]
- 19. Yang Z., Zhu Q., Luo K., Zhou Q. (2001) The 7SK small nuclear RNA inhibits the CDK9/cyclin T1 kinase to control transcription. Nature 414, 317–322 [DOI] [PubMed] [Google Scholar]
- 20. Kerppola T. K. (2009) Visualization of molecular interactions using bimolecular fluorescence complementation analysis: characteristics of protein fragment complementation. Chem. Soc. Rev. 38, 2876–2886 [DOI] [PMC free article] [PubMed] [Google Scholar]
- 21. Fanara P., Hodel M. R., Corbett A. H., Hodel A. E. (2000) Quantitative analysis of nuclear localization signal (NLS)-importin α interaction through fluorescence depolarization. Evidence for auto-inhibitory regulation of NLS binding. J. Biol. Chem. 275, 21218–21223 [DOI] [PubMed] [Google Scholar]
- 22. Fujinaga K., Irwin D., Geyer M., Peterlin B. M. (2002) Optimized chimeras between kinase-inactive mutant Cdk9 and truncated cyclin T1 proteins efficiently inhibit Tat transactivation and human immunodeficiency virus gene expression. J. Virol. 76, 10873–10881 [DOI] [PMC free article] [PubMed] [Google Scholar]
- 23. Robida A. M., Kerppola T. K. (2009) Bimolecular fluorescence complementation analysis of inducible protein interactions: effects of factors affecting protein folding on fluorescent protein fragment association. J. Mol. Biol. 394, 391–409 [DOI] [PMC free article] [PubMed] [Google Scholar]
- 24. Fujinaga K., Luo Z., Peterlin B. M. (2014) Genetic analysis of the structure and function of 7SK small nuclear ribonucleoprotein (snRNP) in cells. J. Biol. Chem. 289, 21181–21190 [DOI] [PMC free article] [PubMed] [Google Scholar]
- 25. Wei P., Garber M. E., Fang S. M., Fischer W. H., Jones K. A. (1998) A novel CDK9-associated C-type cyclin interacts directly with HIV-1 Tat and mediates its high-affinity, loop-specific binding to TAR RNA. Cell 92, 451–462 [DOI] [PubMed] [Google Scholar]
- 26. Aune G. J., Takagi K., Sordet O., Guirouilh-Barbat J., Antony S., Bohr V. A., Pommier Y. (2008) Von Hippel-Lindau-coupled and transcription-coupled nucleotide excision repair-dependent degradation of RNA polymerase II in response to trabectedin. Clin. Cancer Res. 14, 6449–6455 [DOI] [PMC free article] [PubMed] [Google Scholar]
- 27. He N., Pezda A. C., Zhou Q. (2006) Modulation of a P-TEFb functional equilibrium for the global control of cell growth and differentiation. Mol. Cell. Biol. 26, 7068–7076 [DOI] [PMC free article] [PubMed] [Google Scholar]
- 28. Contreras X., Barboric M., Lenasi T., Peterlin B. M. (2007) HMBA releases P-TEFb from HEXIM1 and 7SK snRNA via PI3K/Akt and activates HIV transcription. PLoS Pathog. 3, 1459–1469 [DOI] [PMC free article] [PubMed] [Google Scholar]
- 29. Contreras X., Schweneker M., Chen C. S., McCune J. M., Deeks S. G., Martin J., Peterlin B. M. (2009) Suberoylanilide hydroxamic acid reactivates HIV from latently infected cells. J. Biol. Chem. 284, 6782–6789 [DOI] [PMC free article] [PubMed] [Google Scholar]
- 30. Napolitano G., Licciardo P., Carbone R., Majello B., Lania L. (2002) CDK9 has the intrinsic property to shuttle between nucleus and cytoplasm, and enhanced expression of cyclin T1 promotes its nuclear localization. J. Cell. Physiol. 192, 209–215 [DOI] [PubMed] [Google Scholar]
- 31. Izeddin I., Récamier V., Bosanac L., Cissé II, Boudarene L., Dugast-Darzacq C., Proux F., Bénichou O., Voituriez R., Bensaude O., Dahan M., Darzacq X. (2014) Single-molecule tracking in live cells reveals distinct target-search strategies of transcription factors in the nucleus. eLife 3, e02230. [DOI] [PMC free article] [PubMed] [Google Scholar]
- 32. Fujinaga K., Barboric M., Li Q., Luo Z., Price D. H., Peterlin B. M. (2012) PKC phosphorylates HEXIM1 and regulates P-TEFb activity. Nucleic Acids Res. 40, 9160–9170 [DOI] [PMC free article] [PubMed] [Google Scholar]
- 33. Christman J. K. (2002) 5-Azacytidine and 5-aza-2′-deoxycytidine as inhibitors of DNA methylation: mechanistic studies and their implications for cancer therapy. Oncogene 21, 5483–5495 [DOI] [PubMed] [Google Scholar]
- 34. Fernandez G., Zeichner S. L. (2010) Cell line-dependent variability in HIV activation employing DNMT inhibitors. Virol. J. 7, 266. [DOI] [PMC free article] [PubMed] [Google Scholar]
- 35. Kauder S. E., Bosque A., Lindqvist A., Planelles V., Verdin E. (2009) Epigenetic regulation of HIV-1 latency by cytosine methylation. PLoS Pathog. 5, e1000495. [DOI] [PMC free article] [PubMed] [Google Scholar]
- 36. Jeeninga R. E., Westerhout E. M., van Gerven M. L., Berkhout B. (2008) HIV-1 latency in actively dividing human T cell lines. Retrovirology 5, 37. [DOI] [PMC free article] [PubMed] [Google Scholar]
- 37. Liu P., Xiang Y., Fujinaga K., Bartholomeeusen K., Nilson K. A., Price D. H., Peterlin B. M. (2014) Release of positive transcription elongation factor b (P-TEFb) from 7SK small nuclear ribonucleoprotein (snRNP) activates hexamethylene bisacetamide-inducible protein (HEXIM1) transcription. J. Biol. Chem. 289, 9918–9925 [DOI] [PMC free article] [PubMed] [Google Scholar]
- 38. Hu C. D., Grinberg A. V., Kerppola T. K. (2006) Visualization of protein interactions in living cells using bimolecular fluorescence complementation (BiFC) analysis. Curr. Protoc. Cell Biol. Chapter 21, Unit 21.3 [DOI] [PubMed] [Google Scholar]
- 39. Hsin J. P., Xiang K., Manley J. L. (2014) Function and control of RNA polymerase II C-terminal domain phosphorylation in vertebrate transcription and RNA processing. Mol. Cell. Biol. 34, 2488–2498 [DOI] [PMC free article] [PubMed] [Google Scholar]
- 40. Czudnochowski N., Bösken C. A., Geyer M. (2012) Serine-7 but not serine-5 phosphorylation primes RNA polymerase II CTD for P-TEFb recognition. Nat. Commun. 3, 842. [DOI] [PubMed] [Google Scholar]
- 41. Cho S., Schroeder S., Ott M. (2010) CYCLINg through transcription: posttranslational modifications of P-TEFb regulate transcription elongation. Cell Cycle 9, 1697–1705 [DOI] [PMC free article] [PubMed] [Google Scholar]
- 42. Ramakrishnan R., Chiang K., Liu H., Budhiraja S., Donahue H., Rice A. P. (2012) Making a short story long: regulation of P-TEFb and HIV-1 transcriptional elongation in CD4+ T lymphocytes and macrophages. Biology 1, 94–115 [DOI] [PMC free article] [PubMed] [Google Scholar]
- 43. Cheng Y., Jin Z., Agarwal R., Ma K., Yang J., Ibrahim S., Olaru A. V., David S., Ashktorab H., Smoot D. T., Duncan M. D., Hutcheon D. F., Abraham J. M., Meltzer S. J., Mori Y. (2012) LARP7 is a potential tumor suppressor gene in gastric cancer. Lab. Invest. 92, 1013–1019 [DOI] [PMC free article] [PubMed] [Google Scholar]
- 44. Alazami A. M., Al-Owain M., Alzahrani F., Shuaib T., Al-Shamrani H., Al-Falki Y. H., Al-Qahtani S. M., Alsheddi T., Colak D., Alkuraya F. S. (2012) Loss of function mutation in LARP7, chaperone of 7SK ncRNA, causes a syndrome of facial dysmorphism, intellectual disability, and primordial dwarfism. Hum. Mutat. 33, 1429–1434 [DOI] [PubMed] [Google Scholar]
- 45. Biewenga P., Buist M. R., Moerland P. D., Ver Loren van Themaat E., van Kampen A. H., ten Kate F. J., Baas F. (2008) Gene expression in early stage cervical cancer. Gynecol. Oncol. 108, 520–526 [DOI] [PubMed] [Google Scholar]
- 46. Dai Q., Luan G., Deng L., Lei T., Kang H., Song X., Zhang Y., Xiao Z. X., Li Q. (2014) Primordial dwarfism gene maintains Lin28 expression to safeguard embryonic stem cells from premature differentiation. Cell Rep. 7, 735–746 [DOI] [PubMed] [Google Scholar]
- 47. Wittmann B. M., Fujinaga K., Deng H., Ogba N., Montano M. M. (2005) The breast cell growth inhibitor, estrogen down regulated gene 1, modulates a novel functional interaction between estrogen receptor α and transcriptional elongation factor cyclin T1. Oncogene 24, 5576–5588 [DOI] [PubMed] [Google Scholar]
- 48. Castelo-Branco G., Amaral P. P., Engström P. G., Robson S. C., Marques S. C., Bertone P., Kouzarides T. (2013) The non-coding snRNA 7SK controls transcriptional termination, poising, and bidirectionality in embryonic stem cells. Genome Biol. 14, R98. [DOI] [PMC free article] [PubMed] [Google Scholar]
- 49. Okamura D., Maeda I., Taniguchi H., Tokitake Y., Ikeda M., Ozato K., Mise N., Abe K., Noce T., Izpisua Belmonte J. C., Matsui Y. (2012) Cell cycle gene-specific control of transcription has a critical role in proliferation of primordial germ cells. Genes Dev. 26, 2477–2482 [DOI] [PMC free article] [PubMed] [Google Scholar]
- 50. Dawson M. A., Prinjha R. K., Dittmann A., Giotopoulos G., Bantscheff M., Chan W. I., Robson S. C., Chung C. W., Hopf C., Savitski M. M., Huthmacher C., Gudgin E., Lugo D., Beinke S., Chapman T. D., Roberts E. J., Soden P. E., Auger K. R., Mirguet O., Doehner K., Delwel R., Burnett A. K., Jeffrey P., Drewes G., Lee K., Huntly B. J., Kouzarides T. (2011) Inhibition of BET recruitment to chromatin as an effective treatment for MLL-fusion leukaemia. Nature 478, 529–533 [DOI] [PMC free article] [PubMed] [Google Scholar]