

Abstract
Purpose
To develop a method for targeted volumetric, three directional cine phase contrast imaging with high spatial resolution in clinically feasible scan times.
Materials and Methods
A hybrid radial-Cartesian k-space trajectory is used for cardiac gated, volumetric imaging with three directional velocity encoding. Imaging times are reduced by radial undersampling and temporal viewsharing. Phase contrast angiograms are displayed in a new approach that addresses the concern of signal drop out in regions of slow flow. The feasibility of the PC stack of stars (SOS) trajectory was demonstrated with an in-vivo study capturing 12 small intracranial aneurysms (2-10mm). Aneurysm measures from six aneurysms also imaged with DSA were compared with linear regression to those from the PC SOS images.
Results
All aneurysms were identified on the phase contrast angiograms. The geometric measures from PC SOS and DSA were in good agreement (linear regression: slope = 0.89, intercept = 0.35, R^2 = 0.88).
Conclusion
PC SOS is a promising method for obtaining volumetric angiograms and cine phase contrast velocity measurements in three dimensions. Acquired spatial resolutions of 0.4 × 0.4 × (0.7-1.0)mm make this method especially promising for studying flow in small intracranial aneurysms.
Keywords: Phase Contrast, Flow, Aneurysms, Radial, High Resolution
Introduction
Currently, risk assessment of intracranial aneurysms (ICAs) is determined by geometric parameters such as location and anatomical features such as size and the neck-dome ratio. However, some aneurysms deemed to be low risk still rupture, and some high risk aneurysms do not (1). While anatomical risk factors alone might not be sufficient for conclusive risk assessment, vascular models of aneurysms and their host vessels can identify hemodynamic features including flow, pressure gradients, and wall shear stresses. These parameters may serve useful as indicators of aneurysm growth and rupture (2, 3), thereby reducing unnecessary surgical treatment. With fewer patients treated, safe methods suitable for long-term evaluation of ICAs will also be needed. However, current diagnostic imaging approaches have their shortcomings for hemodynamic assessment and long-term evaluation.
Digital subtraction angiography (DSA) and intra-venous computed tomography both provide high spatial resolution morphological images for aneurysm detection but provide limited hemodynamic information. Furthermore, the risks from ionizing radiation and catheterization are not desirable for long term monitoring of aneurysms. Magnetic resonance angiography (MRA) is non-invasive and is well suited for long term monitoring of vascular diseases such as intracranial aneurysms. The high spatial resolution of Time-of-flight (TOF) MRA (4) has made it the standard technique for MRA of the head at many institutions.
Phase contrast (PC) (5) MRA provides both an angiogram depicting vascular territories as well as the averaged velocity of all MR spins within each image voxel. This information can then be used for the visualization and quantification of derived parameters such as flow, pathlines, pressure gradients and wall shear stress. Therefore, PC MRA has the potential to provide patient specific hemodynamic information in addition to anatomical visualization. However, some challenges remain before PC MRA becomes a robust tool for the assessment of intracranial aneurysms.
Disturbed flow conditions commonly exist in intracranial aneurysms, resulting in vortical or helical flow features (6). Since phase contrast imaging is only capable of resolving the spatial average velocity within a voxel, accuracy is reduced with intravoxel dispersion (7). Insufficient spatial resolution may even result in incomplete and inaccurate characterization of complex flow. High spatial resolution is a necessity when imaging small aneurysms.
Scan times are inherently long in PC due to the required multiple velocity encodings for three directional flow information and low acquisition efficiency due to flow encoding gradients (5). This makes the total scan time in PC imaging about 6-8 × those of typical fast imaging sequences. Since spatial resolution is proportional to the number of phase encodes, and thus, scan time, high resolution volumetric PC with Cartesian acquisitions is challenging (8-11). For example, in one work (8), 33.6 mm of slab coverage with total voxel volume 0.84mm3 and temporal resolution of 44.8ms took 25.5 to 30 minutes to acquire. Parallel imaging has since been used in (9) to lower the imaging time to 10 minutes for 48mm of coverage, but at the expense of slightly lower resolutions. As a result, most clinical applications of PC MR have been limited to single slice acquisitions.
Alternatively, the spatial resolution in radial k-space acquisitions is determined by the readout length, not the total scan time. Even though radial trajectories require approximately 50% more acquisitions to satisfy the Nyquist sampling criterion, under certain imaging conditions, sampling 4-10 × below the Nyquist criterion may still produce acceptable images, albeit at the expense of streak artifact. In general, the aliasing artifact becomes more acceptable as more projections are acquired and fewer image pixels contain signal. Since the subtraction of stationary tissues in phase contrast imaging results in sparse images with few non-zero pixels, radial trajectories are well suited for PC imaging with high spatial resolution and reduced scan times.
The first application of radial readouts to PC MR, termed Phase contrast with Interleaved undersampled PRojections (PIPR), (12) used a two-dimensional, multi-slice approach. This method allowed high in-plane spatial resolution with reduced scan times, but failed to offer a true volumetric acquisition. A true volumetric approach with a three dimensional radial k-space acquisition, termed Phase Contrast with Vastly Undersampled PRojections (PC VIPR), (13) was introduced as an alternative. This method efficiently samples large spherical fields of view with isotropic resolution, allowing flow analysis across the entire field of view and at any orientation without loss of spatial resolution. However, the sampling efficiency is reduced when slab thickness to in-plane field of view and in-plane to through plane resolutions are reduced.
The hybrid radial-Cartesian k-space trajectory introduced in this paper combines the strengths of both the PIPR and the PC VIPR approach. In the Phase Contrast Stack of Stars ( PC SOS ) approach the radial acquisition in kx/ky acquires high in-plane resolution, while the Cartesian partition encoding in kz allows volumetric acquisitions. In the limit that the slab thickness is equal to the in-plane FOV and isotropic spatial resolution is acquired, the sampling requirements of PC SOS and PC VIPR are identical. However, as fewer partitions are needed, either by reducing the (partition encoded) slab-thickness or resolution, sampling becomes more favorable in PC SOS. This is true also of the PIPR approach, with the number of slices and slice thickness in PIPR substituted for number of partitions and slab thickness in PC SOS. However, a volumetric acquisition with Nz partition encodes offers an SNR advantage of compared to multi-slice acquisitions of Nz slices, although the combination of inflow effects and higher flip angles in two-dimensional imaging could overcome this loss. See, for example, (14). Since PC SOS samples k-space more evenly than the PC VIPR approach, it too has an inherent SNR advantage over PC VIPR.
In this work, the sampling strategy of PC SOS is introduced. Its feasibility is demonstrated with a phantom flow pump study and an in-vivo study of 14 small intracranial aneurysms within the Circle of Willis. Six patients also received a clinical DSA exam and were used in a quantitative comparison of geometrical measures obtained from PC SOS and a DSA. Hemodynamic assessment, including measurements of flow, pulsatility and resistance indices were measured for all aneurysms located within the internal carotid arterys (N=10) and visualization of complex flow patterns are demonstrated using time limited pathlines.
Materials and Methods
Image Acquisition
The pulse sequence diagram and sampling strategy for the PC SOS acquisition are shown in Fig.(1) and Fig.(2) respectively. In this approach, k-space is sampled with a hybrid Radial-Cartesian trajectory that combines an in-plane radial readout with conventional Cartesian partition encoding in the kz direction. For improved SNR and/or extended dynamic range of velocity encoding, five point balanced velocity encoding (15), which uses an extra flow compensated measurement in addition to the traditional balanced four-point approach, is performed for each projection angle before incrementing it by 137.51°,“the Golden Angle”. A similar angular distribution was presented in (16). Scan time is reduced by collecting fewer projection angles than required by the Nyquist criterion and temporal viewsharing.
Figure 1.
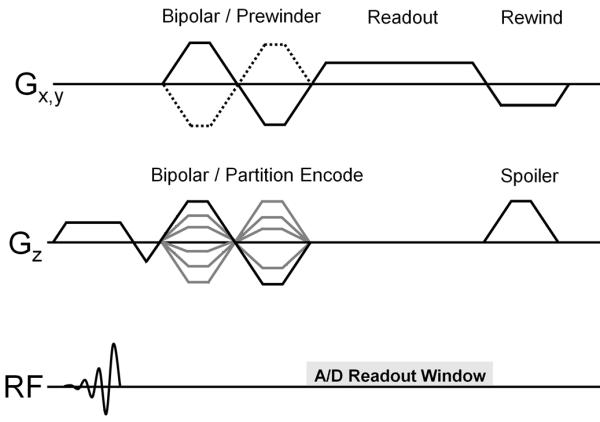
Pulse sequence diagram for PC SOS, consisting of a combined bipolar/prewinder for the readout directions and bipolar/partition encode for the through plane direction, with gradient rewinders on Gx, Gy and spoiling gradient on Gz.
Figure 2.
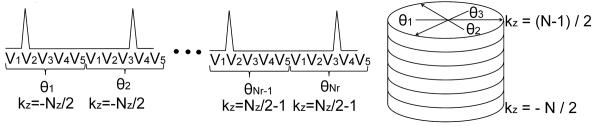
The sampling strategy for cardiac gated PC SOS acquisition with five point velocity encoding. Retrospective cardiac gating acquires data continuously throughout the cardiac cycle. The Vi, with I = 1…5 represent the five velocity encoding directions sampled for each k-space angle θj . θj, j = 1…Nr Each partition encode from to samples the same projection angles θj.
ECG triggers are recorded and cardiac gating is performed retrospectively with temporal filtering (17, 18). In order that each phase encode contains an approximately uniform number of projection angles across the full spectrum of cardiac phases, radial sampling is completed in each partition encode before advancing to the next. Furthermore, this also allows the golden angle sampling approach to create a pseudo-random sampling pattern within each partition encode, resulting in incoherent aliasing artifact when angular undersampling is performed. Variability in the patient’s heart rate also results in a different set of projection angles per partition encode per cardiac phase. After temporal filtering, this creates a random sampling pattern in the kz-direction, which helps to make the undersampling artifact even more incoherent. While it is possible to increment the partition encoding rather than the radial angle during a heartbeat, this may produce partition encodes favoring certain cardiac phases, while minimally sampling, or evenly completely missing other phases.
Image Display
Complex difference (CD) images are produced by multiplying the magnitude image M by a function
| (1) |
where ν is the velocity determined by phase processing and νt is an arbitrary thresh-holding velocity, usually chosen to coincide with the prescribed velocity encoding value (VENC). This approach is equivalent to complex difference processing (19) but allows the use of balanced five point encoding (15) and phase processing.
To increase contrast between the background and slow flowing vessels that may not be fully visualized in the complex difference images but visible in the magnitude image, the following algorithm was introduced to produce phase contrast angiograms (PCAs)
| (2) |
Here, w provides weights to the conventional magnitude and complex-difference images and p is usually chosen to be 2. A weight of w = 0 reproduces the CD image and w = 1the magnitude image.
Flow Pump & Sampling Study
To investigate the effects of radial undersampling on the calculated velocity values, a realistic neurovascular angiography phantom (Shelly Medical Imaging, London, Canada) with a small aneurysm at the end of the left middle cerebral artery Fig 3a was imaged with PC SOS and a fully sampled 3D Cartesian sequence. The phantom was connected to a flow pump (Shelly Medical Imaging, London, Canada) with constant flow rate of 10 ml/s for the entire cerebral vasculature. A single channel birdcage coil was used for both transmit and receive. A PC SOS exam with five point velocity encoding (15) was acquired with the following parameters: VENC=80cm/s, FOV 220 × 220 × 40 mm, acquired resolution 0.43 × 0.43 × 1.0mm, 0.75 fractional echo, TE/TR = 3.7 ms/8.0 ms, tip angle = 10° ,BW = 83.3 kHz, scan time ≈ 9 minutes. The PC SOS exam, already angularly undersampled by a factor of 2.4, was further decimated by additional factors of two, four, six, and eight to simulate typical undersampling factors common of the view-shared cardiac resolved images obtained in the in-vivo studies. For comparison, a fully sampled three dimensional Cartesian acquisition with three directional velocity encoding and matching parameters to the PC SOS exam was acquired. Parameters that differed for the Cartesian acquisition were: Fractional field of view = 0.75 and scantime 11:01.
Figure 3.
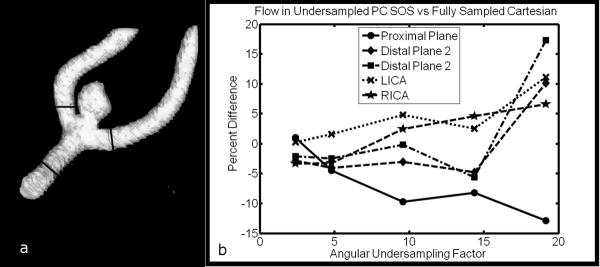
(a) A neurovascular flow phantom with aneurysm at the junction of the M1 and M2, with measurement planes marked. (b) Relative differences between flow measurements using undersampled PC SOS and fully sampled Cartesian acquisition. %Difference=(FlowPCSOS−FlowCART)/FlowCART×100.
All images were reconstructed to isotropic voxel size (0.43 × 0.43 × 0.43 mm) by zero-filling in the slice direction and analyzed with a dedicated software package (EnSight, CEI Inc., Apex, NC). Planes were placed proximal (M1) and distal to the aneurysm ( two branches of M2 ), as well as at the left and right internal carotid arteries (LICA and RICA). Measured flow in the undersampled PC SOS images were calculated and compared the values obtained in the fully sampled Cartesian images by calculating the percent difference: %Difference= (FlowPCSOS − FlowCART)/FlowCART × 100.
Pilot Clinical Study
A series of thirteen patients with 14 previously confirmed aneurysms were examined after obtaining institutional board approval and written informed patient consent. The PC SOS exams begin approximately 8 minutes after administration of contrast agent (Multihance 0.01mmol/kg) and ended approximately 17 minutes afterwards. The PC SOS exam used five point velocity encoding (15) with the following parameters: VENC=80cm/s, FOV 220 × 220 × 40 mm, acquired resolution 0.43 × 0.43 × 1.0mm, 0.75 fractional echo, TE/TR = 3.7 ms/8.0 ms, tip angle = 20° ,BW = 83.3 kHz, scan time ≈ 9 minutes. All acquisitions took place on a clinical 3.0T ( Discovery MR 750, GE Healthcare, Waukesha, WI ) scanner with a standard 8 channel receive head coil.
All images were reconstructed to isotropic voxel size (0.43 × 0.43 × 0.43 mm) by zero-filling in the slice direction. Coil sensitivity maps were estimated with low resolution reconstructions of the reference acquisition from the 5 point velocity encoding scheme. Individual complex coil images were normalized by the sum of squares images to form the sensitivity map estimates. Individual high resolution coil images were then combined according to (20) for improved SNR and artifact reduction. PC derived angiograms using all acquired projections were used for aneurysm visualization and to construct surface renderings using Mimics (Materialise NV, Leuren, Belgium).
Dynamic velocity fields were reconstructed after retrospective ECG gating and radial view sharing (17, 18) with 40ms update rate, 40ms temporal resolution at the center of k-space and 160ms for higher spatial frequencies. For heart rates between 80 and 50 beats per minute, this results in 18 to 30 cardiac frames, with corresponding undersampilng factors of approximately 9-15. Dynamic velocity fields were used for hemodynamic analysis and visualization with a dedicated software package (EnSight, CEI Inc., Apex, NC). After segmentation of the aneurysm and parent vessel, planes were placed proximally and distally to each aneurysm at a distance of approximately two to three times the diameter of the parent vessel. The flow and spatially averaged velocity magnitude was calculated in each plane for all cardiac phases. Similarly, after segementation of all vasculature except the aneurysm, the spatially averaged velocity magnitude within each aneurysm was measured for each cardiac frame. After calculating , , and , the maximum, minimum, and the temporal mean of the spatially averaged velocities, the averaged pulsatility (PI) and resistance (RI) indices were calculated according to and .
Six of the 13 patients had received a clinical DSA exam within 30 days of their PC MRI exam. These cases were used for a quantitative comparison study between DSA, and the magnitude (MAG), complex difference (CD), and phase contrast angiograms (PCA) derived from PC SOS examinations. Phase contrast angiograms used weight w=0.4 and p=2. This weight was empirically determined to enhance the aneurysm without dramatically increasing signal from the background. Two independent readers, a neuroradiologist with 30 years experience and research technician with 25 years of experience working with 3D cranial image analysis independently reformatted the PC SOS images to approximately the same projection angles as the DSA exams. Limited maximum intensity projection (MIP) 10mm thick were taken of the PCSOS MAG, CD, and MIP images every 2.5 mm, according to the standard clinical protocol for cranial image analysis at our institution. Each reader then measured the neck, width, and height of these aneurysms using the PC SOS and DSA images. The readers were not blinded a priori to the aneurysm location. Linear regression was used to compare the measurements from DSA and PC SOS. Mixed effects models were used in the regression to account for correlation between the three measurements (neck, width, and height) taken in each aneurysm and were tested separately whether the attribute being measured affected the slope and intercept of the calibration equation. Each observer was calibrated separately and Bland-Altman limits of agreement analysis were used to characterize expected discrepancies between the two observers.
Results
The percent difference between the undersampled PC SOS images and the fully sampled Cartesian acquisition are shown in Fig. 3b as a function of total angular undersampling factor. Relative differences are less than 8.2 percent for all planes up through an undersampling factor of 15, the maximum factor used in this work. In four of the five cases, PC SOS tended to over-estimate flow as undersampling increased.
All 14 known aneurysms were detected using PC SOS. Eleven of the 14 aneurysms were detected in the complex difference images, while all were visualized in the PCA images. Two larger aneurysms (>7mm) had particularly slow flow and were not visualized in the conventional CD image, but were clearly identifiable in the mixed PCA and magnitude images, as shown in Fig. (4).
Figure 4.

Bilateral vertebral aneurysms with slow flow. a: complex difference (PCA with w = 0) and b: PCA with w=0.2 do not fully visualize aneurysm due to slow flow. c: PCA with w=0.4 fully depicts aneurysm without excessive background enhancement as in d: magnitude image (PCA with w=1). Weights greater than 0.4 produced images very similar to the magnitude.
In this case, the flow is slow enough such that incomplete visualization of the aneurysm occurs in the CD image, regardless of window leveling. The PCA with w=0.2 visualizes more of the aneurysm. Meanwhile the PCA with w=0.4 results continues to visualize more of the aneurysm but also shows more background signal. Phase contrast angiograms with w > 0.4 appeared similar to the magnitude images. Each subfigure was window leveled individually to best depict the vasculature and aneurysm.
The geometric measurements and made by both observers from of aneurysm sizes using DSA and PC SOS as well as the resulting regression models are presented in Fig.(5). For one case, the aneurysm was not visualized in the complex difference images due to lack of signal, while in a different case venous overlap prevented each observer from making a confident measurement. In both cases, the aneurysm was visible in the PCAs. It was determined that slope was not dimension dependent ( p ≥ 0.071 ). Intercept was dependent on dimensional for PCA for one reader ( p = 0.03 ), but not for the other measurements ( p ≥ 0.142 ). In every case the 95% confidence intervals for slope and intercept contain 1 and 0, respectively, consistent with perfect agreement. The panel for observer 1 PCA contains three parallel lines because the intercepts depended on the aneurysm attribute being measured (p=0.011). The Bland-Altman 95% limits of agreement were 0.1 mm ± 0.637mm, −0.04 mm ± 0.46 mm, 0.04 mm ± 0.71 mm, and 0.04 mm ± 0.75 mm for the CD, DSA, MAG, and PCA respectively, which each type having one measurement outside the confidence interval.
Figure 5.
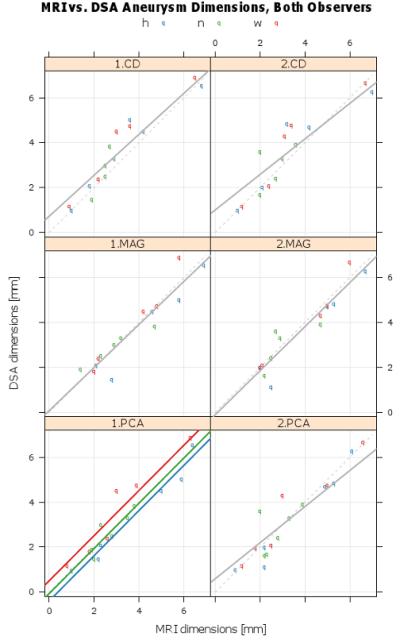
Calibration plots of DSA and MRI, by observer (column) and PC SOS image type. Raw aneurysm measurement data (colored dots), fitted mixed effect final calibration model (solid gray line), and line of perfect agreement (dashed line). Each panel contains the parameter estimates and 95% confidence intervals. In every case the 95% confidence intervals for slope and intercept contain 1 and 0, respectively, consistent with perfect agreement. The panel for observer 1 PCA contains three parallel lines because the intercepts depended on the aneurysm attribute being measured (p=0.011).
Figures 6-8 shows typical results obtained from PC SOS exams of a carotid artery aneurysm. Anatomical visualization is demonstrated with maximum intensity projections (MIP) of the time-averaged CD images in Fig. 6 (a-c) and compared to the DSA exam Fig 6(d) and surface rendering from PC SOS in Fig. 6e. The high spatial resolution and background suppression of stationary tissue typical of PC SOS aids in visualization and segmentation of the aneurysm as well as demonstrating the relationship to the parent artery. Hemodynamic assessment is demonstrated by measuring flow through planes proximal and distal to the aneurysm, shown in Fig. 7a. The spatially averaged speeds in planes proximal and distal to the aneurysm, as well as the aneurysm itself are shown in Fig. 7b. In this case, the pulsatility and resistance indices were measured to be 0.81,0.87,0.87 and 0.54,0.60,0.59 for the proximal plane, the aneurysm, and the distal plane. Hemodynamic visualization was performed by integrating the velocity vector fields over time to create pathlines and are shown in Fig. 8 for a case when the particle is just enters the aneurysm at 45ms after the ECG trigger. The pathlines demonstrates a double vortex.
Figure 6.

Example of a 3.8 mm aneurysm (arrow) in the right carotid artery demonstrating the fine vessel conspicuity, high spatial resolution, and background suppression of PC SOS. Shown are axial (a), limited and enlarged axial (b) and coronal (c) maximum intensity projections of the complex difference images. For comparison, (d) shows an approximately coronal DSA image and (e) is the surface rendered image from PC SOS.
Figure 8.
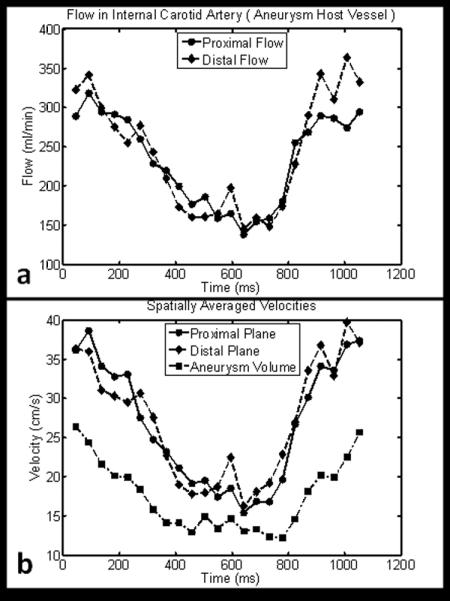
(a) Flow measured proximally and distally to the aneurysm shown in Fig. 6 and Fig. 7. (b). The spatially averaged velocities for planes proximally and distally to the aneurysm as well as within the aneurysm itself.
Figure 7.
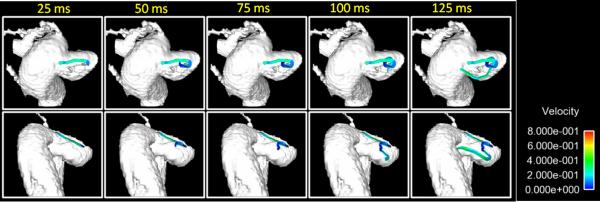
Pathlines corresponding to various amounts of transit time upon entering the aneurysm shown in Fig. 6 display a complicated vertical flow pattern.
Figure 9 shows results from an aneurysm located at the tip of the basiliar artery. The axial MIP image of the CD shown in Fig. 8a depict near total background suppression and fine branching segmental vessels ( approximately 0.9mm full width half maximum) of the posterior cerebral (PCA) and superior cerebellar (SCA) arteries (green arrow). The coronal and sagittal reformats in Fig. 9 b,c depict the coverage typically obtained in a 9:03 PC SOS exam. Color coded pathlines, shown in Fig. 9 (d-k), were initialized in the right PCA and SCA (green and blue respectively) and the left PCA and SCA (red and yellow respectively ) and traced backwards in time. Some pathlines in the right PCA and left PCA and SCA were seen to originate directly from the basiliar artery, while those in left SCA came only after traversing through the aneurysm. Similar results were obtained when the planes were placed closer to the aneurysm. A central circulation zone is visualized with contributions from left and right PCA and SCA, while a second circulation zone alone the wall is visualized with contributions from only the left PCA and SCA.
Figure 9.

Maximum intensity projections of complex differences images clearly depict a basiliar tip aneurysm (yellow arrow) as well as branching distal vessels of the PCA and SCA (green arrow) that are less than 1mm wide. The sagittal reformat ( b ) shows a bright region corresponding to an inflow jet. Pathlines (d-k) emitted downstream of the aneurysm. These are integrated backwards in time to help visualize the distribution of blood within the aneurysm.
The mean of the hemodynamic measurements from the ten aneurysms located in the internal carotid artery are shown in Table 1. Both the pulsatility and resistance indices increase in the aneurysm compared to the proximal measurement. The PI and RI then decrease slightly distally compared to the aneurysm, but remain elevated compared to the proximal measurements. A student t-test was performed to compare the likelihood of equivalent means between the PI and RI of the measurements taken at the different positions. When comparing the PI and RI proximally to distally, the p-value was p=0.10 and p=0.11 respectively. The p-values were p=0.04 and p=0.09 when the proximal plane was compared to the aneurysm volume, and were p=0.71 and p=0.90 when the distal plane was compared to the aneurysm volume.
Table 1.
Blood velocity measurements ( Meas. ±SEM ) in 10 Patients with Aneurysms in ICA
| Minimum Avg Velocity (mm/s) |
Maximum Avg Velocity (mm/s) |
Mean Avg Velocity (mm/s) |
Pulsatility Index PI |
Resistance Index RI |
Mean flow (ml/min) |
|
|---|---|---|---|---|---|---|
| Proximal Plane | 266 ± 22 | 529 ±60 | 384 ± 38 | 0.67 ± 0.05 | 0.48 ±0.03 | 188 ±27 |
| Distal Plane | 231 ± 25 | 520 ±42 | 359 ± 30 | 0.83 ± 0.08 | 0.56 ±0.03 | 209 ±20 |
| Aneurysm (volume) | 150 ± 15 | 343 ±25 | 230 ± 20 | 0.87 ± 0.07 | 0.56 ±0.03 |
PI = (Vmax−Vmin)/Vmean, RI = (Vmax−Vmin)/Vmax
Discussion
This work demonstrates the clinical feasibility for volumetric, phase contrast velocimetry with three-directional flow encoding for dynamic imaging of intracranial aneurysms by addressing several of the current limitations of PC, mainly scan time, spatial resolution and vessel conspicuity. Our hybrid radial-Cartesian approach, PC SOS, increasing spatial resolution and simultaneously reduces scan time through angular undersampling. Compared to some of the initial works on volumetric, three directional PC with Cartesian trajectory (8-11), we have reduced imaging times by about a factor of three to ten for scans of comparable resolutions and coverage. In addition, radial sampling schemes have beneficial properties that aid in reducing flow and motion artifacts (22-24) and can be combined with retrospective ECG gating so that the reconstructed dynamic data represent the complete cardiac cycle. As shown in Fig. 8, the peak flow occurred just before the trigger occurred, in a period that would typically be missed in prospective sequences acquiring only cardiac cycle ( 1 RR ).
The aneurysm measures obtained using PC SOS are shown to correlate well with those obtained with DSA. Our measurements were taken on PC SOS images that were manually reformatted to approximately the same angle as the DSA images based on visual inspection. However, the level of error reported is within the spatial resolution of PC SOS and may simply be due to the partial volume effects of PC SOS.
Our approach to pulsatility and resistance index differs from (8) in that we use the spatially averaged speeds in each cardiac frame, as opposed to TCD which can focus the beam to a small spot and search the vessel or aneurysm for the location with the maximum speed. Since flow conditions can vary within the aneurysm, measuring speeds at different spots in the aneurysm could result in different PIs and RIs. The method of spatial averaging presented in this work attempts to assign an overall PI and RI to the aneurysm. Nonetheless, the averaged RIs and PIs obtained proximally to the aneurysm in the 10 carotid cases match those presented in (8). Further study is warranted with to see if the increase of RI and PI distally to the aneurysm is a function of the aneurysm itself.
The current PC SOS imaging approach does have several limitations. The protocol presented in this work was arrived at by limiting the scan time at 9:00. Previous studies (24,25) investigated the undersampling aspects of this k-space trajectory and temporal filter designs (17,18) of 5TRs, or approximately 40ms at the base of k-space and 160ms at the top requires about 350 total projections per phase encode. Fewer projections result in increased artifact that may corrupt flow measurements. This allows for approximately 40 slice encodings and thereby limits the slab thickness to 40 × ΔZ. As a result, slab coverage is the current primary limitation of the PC SOS acquisition. Furthermore, a better understanding of the influence of radial aliasing and temporal view sharing on quantitative flow measures in radial PC imaging is warranted and will be studied in future works. Preliminary results (26) using an increased number of coil elements has shown promising results for acquisitions with increased slab thickness.
The sparseness provided by the subtraction of stationary tissue, combined with the strong spatio-temporal correlation between the vasculature of neighboring cardiac phases makes phase contrast imaging well suited for many constrained reconstruction techniques. Furthermore, the pseudo-random sampling pattern is ideally suited for compressed sensing applications (28,29). We suspect that the implementation of these algorithms will help relax the limitations discussed above. For instance, these reconstruction techniques could be used to increase slab coverage and improve flow measurements by reducing undersampling artifacts and/or reducing the amount of temporal viewsharing.
The hemodynamic analysis, including flow measurements and pathlines presented in this case are derived from cardiac phases, each radially undersampled by factors of approximately 9-15. However, since each coil has a limited region of sensitivity, its actual undersampling factor is reduced by the ratio of its effective FOV to that of the total prescribed FOV since we account for coil sensitivities in the reconstruction (20). Nonetheless, we should still take great care when interpreting velocity measurements and visualization, as noise and artifact are still be present. Furthermore, partial volume effects at the vessel edges create a blurred boundary to restrict blood flow. As a result, some pathlines are shown to hit the wall and terminate, which is an unrealistic result. In the case of the basiliar tip aneurysm of Fig. 9, in which pathlines are integrated backwards in time, some lines termite on the walls of the aneurysm. Thus, lines seem to begin at the wall and end in the vessel, which again, is an unrealistic result. However, this result could be explained by aggressive thresholding which resulted in vessel and aneurysm boundaries within the actual ones. These are problems common to analysis of 4D PC data derived from all methods.
A new scheme to generate PC angiograms was introduced by combining the conventional complex difference and magnitude images, resulting in visualization of slow flow arterial regions not seen in the complex difference image. Future studies are warranted to optimize the weighting parameters for this approach and to demonstrate efficacy in a larger patient population. Since our protocol consisted of moderate slab thickness, flow compensated readouts, and relatively long TRs, our magnitude images already provided strong contrast between the vessels and background. The use of Eq.[2] on larger slabs that will not experience as much in-flow effect still also needs to be studied in more detail.
The ability to measure cardiac resolved, three directional velocities with high spatial resolution over volumetric datasets could prove useful for other hemodynamic analysis, such as the derivation of hemodynamic parameters such as pressure gradients (29), wall shear stress, and others. In addition, they can be use as input parameters or boundary conditions for computational fluid dynamics (CFD) calculations designed to develop a better understanding of vascular disease processes or to evaluate options for therapeutic procedures (30,31).
In conclusion we have introduced PC SOS, a novel MR acquisition approach to obtain high spatial resolution, dynamic phase contrast velocimetry data that is particularly useful when the imaging volume has a small slab thickness in comparison to the in-plane FOV requirements. Benefits of the technique have been demonstrated in a clinical study investigating small aneurysms in the circle of Willis. The geometric measures obtained with this PC SOS correlated well with DSA measures. Pulsaility and resistance indices were measured in the intracranial artery and shown to agree with previous findings. Finally, we demonstrated the benefits of using a novel scheme for the derivation of PC angiograms by combining the complex difference image and the magnitude image so that slow flow areas including whole aneurysms could be identified which were otherwise not seen in conventional complex difference images.
Acknowledgments
Grant Support: NIH/NIBIB R21 EB009441, NIH/NHLBI R01HL072260
References
- 1.Wardlaw JM, White PM. The detection and management of unruptured intracranial aneurysms. Brain. 2000;123(Pt 2):205–221. doi: 10.1093/brain/123.2.205. [DOI] [PubMed] [Google Scholar]
- 2.Boussel L, Rayz V, McCulloch C, et al. Aneurysm growth occurs at region of low wall shear stress: patient-specific correlation of hemodynamics and growth in a longitudinal study. Stroke. 2008;39:2997–3002. doi: 10.1161/STROKEAHA.108.521617. [DOI] [PMC free article] [PubMed] [Google Scholar]
- 3.Cebral JR, Mut F, Weir J, Putman CM. Association of hemodynamic characteristics and cerebral aneurysm rupture. Am J Neuroradiol. 2011;32:264–270. doi: 10.3174/ajnr.A2274. [DOI] [PMC free article] [PubMed] [Google Scholar]
- 4.Dumoulin CL, Cline HE, Souza SP, Wagle WA, Walker MF. Three-dimensional time-of-flight magnetic resonance angiography using spin saturation. Magn Reson Med. 1989;11:35–46. doi: 10.1002/mrm.1910110104. [DOI] [PubMed] [Google Scholar]
- 5.Dumoulin CL, Souza SP, Walker MF, Wagle W. Three-dimensional phase contrast angiography. Magn Reson Med. 1989;9:139–149. doi: 10.1002/mrm.1910090117. [DOI] [PubMed] [Google Scholar]
- 6.Vega C, Kwoon JV, Lavine SD. Intracranial aneurysms: current evidence and clinical practice. Am Fam Physician. 2002;66:601–608. [PubMed] [Google Scholar]
- 7.Petersson S, Dyverfeldt P, Gardhagen R, Karlsson M, Ebbers T. Simulation of Phase-Contrast MRI Intravoxel Velocity Standard Deviation (IVSD) Mapping. Magn Reson Med. 2010;64:1039–1046. doi: 10.1002/mrm.22494. [DOI] [PubMed] [Google Scholar]
- 8.Bammer R, Hope TA, Aksoy M, et al. Time-Resolved 3D Quantitative Flow MRI of the Major Intracranial Vessels: Initial Experience and Comparative Evaluation at 1.5T and 3.0T in Combination With Parallel Imaging. Magn Reson Med. 2007;57:127–140. doi: 10.1002/mrm.21109. [DOI] [PMC free article] [PubMed] [Google Scholar]
- 9.Meckel, Stalder, Santini, et al. In vivo visualization and analysis of 3-D hemodynamics in cerebral aneurysms with flow-sensitized 4-D MR imaging at 3T. Diagnostic Neuroradiology. 2008;50:473–484. doi: 10.1007/s00234-008-0367-9. [DOI] [PubMed] [Google Scholar]
- 10.Boussel L, Rayz V, Martin A, et al. Phase-Contrast Magnetic Resonance Imaging Measurements in Intracranial Aneurysms In Vivo of Flow Patterns, Velocity Fields, and Wall Shear Stress: Comparisons with Computational Fluid Dynamics. Magn Reson Med. 2009;61:409–417. doi: 10.1002/mrm.21861. [DOI] [PMC free article] [PubMed] [Google Scholar]
- 11.Yamashita S, Isoda H, Hirano M, et al. Visualization of Hemodynamics in Intracranial Arteries Using Time-Resolved Three-Dimensional Phase-Contrast MRI. J Magn Reson Imag. 2007;25:473–478. doi: 10.1002/jmri.20828. [DOI] [PubMed] [Google Scholar]
- 12.Barger AV, Peters DC, Block WF, et al. Phase-contrast with interleaved undersampled projections. Magn Reson Med. 2000;43:503–509. doi: 10.1002/(sici)1522-2594(200004)43:4<503::aid-mrm3>3.0.co;2-0. [DOI] [PubMed] [Google Scholar]
- 13.Johnson KM, Lum DP, Turski PA, Block WF, Mistretta CA, Wieben O. Improved 3D phase contrast MRI with off-resonance corrected dual echo VIPR. Magn Reson Med. 2008;60:1329–1336. doi: 10.1002/mrm.21763. [DOI] [PMC free article] [PubMed] [Google Scholar]
- 14.Haacke EM, Brown RW, Thompson MR, Venkatesan R. Magnetic Resonance Imaging: Physical Principles and Sequence Design. Wiley-Liss; New York: 1999. p. 347,710. [Google Scholar]
- 15.Johnson KM, Markl M. Improved SNR in phase contrast velocimetry with five-point balanced flow encoding. Magn Reson Med. 2010;63:349–355. doi: 10.1002/mrm.22202. [DOI] [PMC free article] [PubMed] [Google Scholar]
- 16.Winkelmann S, Schaeffter T, Koehler T, Eggers H, Doessel O. An optimal radial profile order based on the Golden Ratio for time-resolved MRI. IEEE Trans Med Imaging. 2007;26:68–76. doi: 10.1109/TMI.2006.885337. [DOI] [PubMed] [Google Scholar]
- 17.Barger AV, Block WF, Toropov Y, Grist TM, Mistretta CA. Time-resolved contrast-enhanced imaging with isotropic resolution and broad coverage using an undersampled 3D projection trajectory. Magn Reson Med. 2002;48:297–305. doi: 10.1002/mrm.10212. [DOI] [PubMed] [Google Scholar]
- 18.Song HK, Dougherty L. Dynamic MRI with projection reconstruction and KWIC processing for simultaneous high spatial and temporal resolution. Magn Reson Med. 2004;52:815–824. doi: 10.1002/mrm.20237. [DOI] [PubMed] [Google Scholar]
- 19.Bernstein MA, Ikezaki Y. Comparison of phase-difference and complex-difference processing in phase-contrast MR angiography. J Magn Reson Imaging. 1991;1:725–729. doi: 10.1002/jmri.1880010620. [DOI] [PubMed] [Google Scholar]
- 20.Roemer PB, Edelstein WA, Hayes CE, Souza SP, Mueller OM. The NMR phased array. Magn Reson Med. 1990;16:192–225. doi: 10.1002/mrm.1910160203. [DOI] [PubMed] [Google Scholar]
- 21.Nishimura DG, Irarrazabel P, Meyer CH. A Velocity k-Space Analysis of Flow Effects in Echo-Planar and Spiral Imaging. Magn Reson Med. 1995;33:549–556. doi: 10.1002/mrm.1910330414. [DOI] [PubMed] [Google Scholar]
- 22.Nishimura DG, Jackson JI, Pauly JM. ON the nature and reduction of the displacement artifact in flow images. Magn Reson. Med. 1991;22:481–492. doi: 10.1002/mrm.1910220255. [DOI] [PubMed] [Google Scholar]
- 23.Glover CH, Pauly JM. Projection reconstruction techniques for reduction of motion effects in MRI. Magn Reson Med. 1992;28:275–289. doi: 10.1002/mrm.1910280209. [DOI] [PubMed] [Google Scholar]
- 24.Kecskemeti S, Johnson K, Wieben O, Mistretta C. Phase Contrast Stack of Stars Imaging. Sixteenth Annual Meeting of the Society of Magnetic Resonance in Medicine.2008. [Google Scholar]
- 25.Kecskemeti S, Johnson K, Landgraf B, Wieben O. Volumetric, 3D Velocity Encoded Valve Imaging with Radial Undersampling. Eighteenth Annual Meeting of the Society of Magnetic Resonance in Medicine.2010. [Google Scholar]
- 26.Kecskemeti S, Johnson K, Wu Y, Turski P, Wieben O. Accelerated, 4D Phase Contrast Velocimetry of Intracranial Aneurysms. Twenty-second Annual MR Angiography Conference.2010. [Google Scholar]
- 27.Candes EJ, Romberg J, Tao T. Robust uncertainty principles: exact signal reconstruction from highly incomplete frequency information. IEEE Trans. Info. Theory. 2006;52:489–509. [Google Scholar]
- 28.Donoho DL. Compressed sensing. IEEE Trans. Info. Theory. 2006;52:1289–1306. [Google Scholar]
- 29.Lum DP, Johnson KM, Paul RK, Turk AS, Consigny DW, Grinde JR, Mistretta CA, Grist TM. Transstenotic pressure gradients: measurement in swine–retrospectively ECG-gated 3D phase- contrast MR angiography versus endovascular pressure-sensing guidewires. Radiology. 2007;245:751–760. doi: 10.1148/radiol.2453061946. [DOI] [PubMed] [Google Scholar]
- 30.Kulcsar Z, Houdart E, Bonafe, et al. Intra-Aneurysmal Thrombosis as a Possible Cause of Delayed Aneurysm Rupture after Flow-Diversion Treatment. 2011;32:20–25. doi: 10.3174/ajnr.A2370. [DOI] [PMC free article] [PubMed] [Google Scholar]
- 31.Cebral JR, Mut F, Raschi, et al. Aneurysm Rupture Following Treatment with Flow-Diverting Stents: Computational Hemodynamics Analysis of Treatment. 2011;32:27–33. doi: 10.3174/ajnr.A2398. [DOI] [PMC free article] [PubMed] [Google Scholar]