

Abstract
ExoQuick-TCTM (EQ), a chemical-based agent designed to precipitate exosomes, was calibrated for use on saliva collected from healthy individuals. The morphological and molecular features of the precipitations were compared with those obtained using the classical, physical-based method of ultracentrifugation (UC). Electron microscopy and immunoelectron microscopy with anti-CD63 showed vesicular nanoparticles surrounded by bi-layered membrane, compatible with exosomes in EQ, similar to that observed with UC. Atomic force microscopy highlighted larger, irregularly shaped/aggregated EQ nanoparticles that contrasted with the single, round-shaped UC nanoparticles. ELISA (performed on 0.5 ml of saliva) revealed a tendency for a higher expression of the specific exosomal markers (CD63, CD9, CD81) in EQ than in UC (p>0.05). ELISA for epithelial growth factor receptor, a non-exosomal-related marker, showed a significantly higher concentration in EQ than in UC (p=0.04). Western blotting of equal total-protein concentrations revealed bands of CD63, CD9 and CD81 in both types of preparations, although they were less pronounced in EQ compared with UC. This may be related to a higher fraction of non-exosomal proteins in EQ. In conclusion, EQ is suitable and efficient for precipitation of salivary exosomes from small volumes of saliva; however, EQ tends to be associated with considerably more biological impurities (non-exosomal-related proteins/microvesicles) as compared with UC.
Keywords: saliva, extracellular vesicles, exosomes, ultracentrifugation, ExoQuick, isolation
Introduction
Exosomes are nano-scale, cell-derived vesicles (30–100 nm in diameter) generated by the endosomal pathway and released through exocytosis of multivesicular bodies (MVBs) to the extracellular space and circulation (Vlassov et al. 2012; Mathivanan et al. 2010). Consequently, exosomes naturally contain components that take part in membrane transport and fusion processes (i.e., flotillin) and MVB generation (i.e., Alix and TSG101). They also contain lipid-related proteins, phospholipases, heat shock proteins (HSP70, HSP90), integrins and tetraspanins (i.e., CD63, CD9 and CD81) (Simons and Raposo 2009; Mathivanan et al. 2010). Some of these components are frequently utilized as exosomal markers. Exosomes also encompass more specific proteins that reflect the cytosol content of their cellular origin as well as large amounts of mRNAs and microRNAs (Valadi et al. 2007; Mathivanan et al. 2012). Many types of cells have been demonstrated to secrete exosomes (Pant et al. 2012; Schageman et al. 2013) that function as regulators of coagulation and stimulation of the immune system. Recent studies have suggested that they play a major role in intercellular communication (Simons and Raposo 2009; Mathivanan et al. 2010). Upon uptake by neighboring and distant recipient cells, exosomes apparently induce significant genotypic and phenotypic changes. This is of great relevance to tumor-derived exosomes, which can promote dramatic pre-cancerous events in the tumor microenvironment (Kharaziha et al. 2012). Therefore, exosomes have been emerging as potential diagnostic and therapeutic tools for several systemic diseases, particularly cancer (Lakhal and Wood 2011; Suntres et al. 2013).
Exosomes are found in abundance in different body fluids, such as blood, urine, breast milk, cerebrospinal fluid and ascetic fluid (Vlassov et al. 2012), as well as in saliva (Ogawa et al. 2008; Michael et al. 2010; Palanisamy et al. 2010; Lässer et al. 2011). Studies on the definitions of the nanostructural features of exosomes in saliva (Palanisamy et al. 2010; Sharma et al. 2010; Sharma et al. 2011), their transcriptomics (Palanisamy et al. 2010), and their proteomics (Ogawa et al. 2011) are ongoing. Due to its easy accessibility, saliva has become a potential source for exosomal biomarkers for diagnostic and prognostic assessments (Lau et al. 2013).
The most accepted method for isolation of exosomes in general and of salivary exosomes in particular is based on ultracentrifugation (UC) (Théry et al. 2006). Although this technique is believed to obtain minimally contaminated pellets of exosomes, it demands a very complicated and prolonged process that utilizes specialized equipment. System Biosciences (www.systembio.com) has recently developed a proprietary reagent named ExoQuick (EQ) that is claimed to be an adequate methodology for the precipitation of exosomes when added to several types of biological fluids. EQ is currently being evaluated, and reports have already indicated it efficiency in several experimental settings (Fabbri et al. 2012; Caradec et al. 2014; Quackenbush et al. 2014; Taylor et al. 2011); however, it has yet to be used for saliva. In this study, saliva collected from healthy individuals was submitted to exosome isolation using two different strategies: using the chemical-based agent, EQ, and via the classical, physical-based method of UC. The morphological and molecular features of the isolated exosomes were compared.
Materials & Methods
The study was approved by the IRB of the Chaim Sheba Medical Center, Tel Hashomer, Israel and the subjects provided informed consent to participate.
Sample Collection
Whole saliva from ten healthy individuals (six females, four males) with a mean age of 56 ± 11 years (range, 40–68 years) was collected into sterile tubes according to the widely used protocol for the collection of saliva (Davidovich et al. 2010). Subjects with any conditions/lesions that affect the oral cavity (i.e., infectious, autoimmune, pre-malignant and malignant) were excluded following a thorough examination by a specialist in oral medicine (AZH). The tubes were immediately centrifuged at 3000 × g for 20 min at 4C to remove cells and debris. The supernatant was pooled and kept at -70C until further use.
Exosome Isolation from Saliva
ExoQuick
The exosomal fraction from pooled saliva was isolated using ExoQuick-TC™ (EQ, System Biosciences Inc.; Mountain View, CA) according to the manufacturer’s recommendations, with some modifications aimed to adjust the kit for use with saliva. Saliva volumes of 5 ml, 2 ml, 1 ml, 0.5 ml and 0.25 ml were admixed with the EQ precipitation solution at 1:1, 1:2, and 1:5 ratios. We concluded that 0.5 ml of saliva was the minimal sample volume required to receive an efficient and manageable pellet when a 2:1 saliva-to-EQ volume ratio was used. Incubation periods ranging from 6 hr to 24 hr revealed that at least 12 hr at 4C was appropriate. At the end of the incubation time, the samples were centrifuged at 1500 × g for 30 min, the supernatant was removed, and the samples then underwent a second round of centrifugation at 1500 × g for 5 min. The pellet was processed for further analysis.
Ultracentrifugation
The pooled saliva was centrifuged at 12,000 × g for 20 min to remove residual organelles and cell fragments. Following this, 0.5 ml supernatant was diluted 1:1 with phosphate-buffered saline (PBS) and transferred to 1.0 ml polycarbonate tubes for ultracentrifugation at 120,000 × g for 3 hr at 4C (Beckman Coulter Optima TLX, TLA 120.2 rotor; Beckman Coulter; Brea, CA) (Palanisamy et al. 2010). The final pellet was resuspended in 100 µl PBS and then kept at -70C until further analysis.
Morphological Analysis
Transmission Electron Microscopy (TEM)
The purified exosome pellet was fixed in 500 µl of 2.5% glutaraldehyde in 5% sucrose and 0.1 M sodium cacodylate, pH 7.4, for 30 min at room temperature. After rinsing three times with cacodylate buffer, 1% osmium tetroxide was added to the pellet for 90 min, and the sample was then washed with cacodylate buffer. Following dehydration, the pellets were fixed with epoxy resin and sliced into ultrathin sections that were placed on nickel grids and further stained with uranyl acetate and lead citrate, 15 min each. Finally, the sections were examined using TEM (JEOL TEM JEM 1200EX, Peabody, MA).
Immuno Electron Microscopy (immunoEM)
Isolated exosomes were deposited on Formvar carbon-coated, glow-discharged grids (Van Deun et al. 2014). The grids were incubated in a blocking serum containing 1% bovine serum albumin (BSA) in PBS. Antibodies and gold conjugates were diluted in 1% BSA in PBS. The grids were exposed to the primary antibody against CD63 (1:50, BD Pharmingen; San Diego, CA) for 20 min, followed by gold-conjugated goat anti-mouse IgG (size, 10 nm; 1:25, BBI Solutions; Cardiff, UK) for 20 min at room temperature. The negative control was prepared by omitting the primary antibody. The grids were stained with neutral uranyl acetate and embedded in methylcellulose/uranyl acetate and examined in a Tecnai Spirit TEM (FEI; Eindhoven, The Netherlands). Images were captured by Quemesa CCD camera (Olympus Soft Imaging Solutions GMBH; Munster, Germany).
Atomic Force Microscopy (AFM)
Pellets yielded by both isolation methods were disassembled by gentle pipetting and the suspension diluted 1:50 in deionized water and adsorbed to freshly cleaved mica sheets (Bruker; Camarillo, CA) for 2 min and dried under a gentle stream of nitrogen. Samples were analyzed by NanoWizardIII AFM (JPK; Berlin, Germany) in tapping mode using silicon probes (Mikro Mash NSC15/AL BS). Topographic height and phase images were recorded at 512×512 pixels at a scan rate of 1 Hz. Image processing was performed with JPK Data Processing software.
Molecular Analysis
ELISA
The three exosomal markers chosen in the present study belong to the tetraspanin web, and are known to act as regulators of molecular pathways in physiological and cancerous conditions (Hemler 2003; Chernousov et al. 2013). Kits were used for the detection of the exosomal protein markers CD63, CD9 and CD81 using ExoELISA-63, ExoELISA-9, ExoELISA-81, respectively (all from System Biosciences Inc.). Exosomal pellets were processed according to the manufacturer’s instructions. First, 200 µl of exosome-binding buffer (System Biosciences Inc.) was added to both types of pellets followed by a gentle vortex for 15 sec to produce a homogenous solution. The EQ pellets were further incubated at 37C for 20 min, centrifuged at 1500 × g for 5 min to remove residual precipitation solution, and the supernatant transferred to a new tube. The UC pellets were only incubated at room temperature for 10 min. Following this, 50 µl of each type of preparation for each marker was transferred to pre-coated wells of the microtiter plate. The plate was incubated overnight at 37C. After washes with working buffer (System Biosciences Inc.), 50 µl of anti-CD63, anti-CD9 and anti-CD81 (1:100) were added to the wells, and incubated for 1 hr at 37C. The plate was again washed and then incubated with 50 µl of horseradish peroxidase (HRP) enzyme-linked secondary antibody (goat anti-rabbit, 1:5000) for 1 hr at room temperature. Colorimetric substrate (extra-sensitive tetramethylbenzidine) and stop solution provided in the kit were added to end the reaction. Protein amount was determined by reading the optical density on a VersaMax microplate reader (Molecular Devices; Sunnyvale, CA) at 450 nm. Exosomal protein amount was plotted against the standard curve created with the kit. Intra- and inter-test variabilities were calculated on duplicates of the same preparation on at least three different plates and were allowed to reach a maximum of 30% and 25%, respectively (Logozzi et al. 2009). The results are expressed as the mean ± SD for each concentration (pg/ml) of the three investigated proteins for each method of exosome isolation.
In addition, an ELISA kit for the detection of epithelial growth factor receptor (EGFR, human EGFR/ErbB1 ELISA Kit cat# RAB0160, Sigma-Aldrich) was used to demonstrate that the isolated salivary exosomes had originated from human epithelial tissues and not from oral cavity microflora (Yarden 2001; Singh and Coffey 2014). Experiments were carried out on 0.5 ml of whole saliva taken from the same pool used for the exosomal markers. Exosomal pellets were processed according to the manufacturer’s instructions. Samples were run five times in duplicates.
Western Blotting (WB)
Preliminary studies using exosomal pellets derived from a constant volume of 0.5 ml of saliva yielded bands only for those produced by EQ (data not shown, WB protocol is detailed below). Using Bradford assay, we converted our results to equivalent protein concentrations rather than a constant volume of saliva. Because we found a 2–3-fold higher protein concentration in EQ compared with UC pellets, a saliva volume ratio of 1:3 was used for the pellets submitted for WB analysis.
Western blotting procedures were performed according to the manufacturer’s instructions. Purified exosomal pellets (EQ and UC) were treated with 1×RIPA buffer and protease inhibitors (Sigma-Aldrich). Protein concentrations were determined using a Bradford microassay (Bio-Rad Laboratories, Hercules, CA). Samples were combined with 4× Laemmli loading buffer, comprising 2-mercaptoethanol (AMRESCO, Solon, OH) and heated at 95C for 5 min. Approximately 60 µg total protein were separated by SDS-PAGE at constant 90 V at room temperature for 1.5 hr using 12% gels. Separated proteins were then blotted onto nitrocellulose membranes (Whatman, Sigma-Aldrich) at constant 260 mA for 1 hr. Membranes were stained with Ponceau dye (AppliChem, Darmstadt, Germany) prior to blotting to verify equal loading of proteins. Membranes were blocked with 5% non-fat dry milk (Santa Cruz Biotechnology) diluted in 1× Tris-buffered saline (TBS) with Tween (SctTek Laboratories, Logan, UT) for 1 hr, then incubated with primary antibodies diluted 1:1000 (Cat# EXOAB-CD63A-1, EXOAB-CD9A-1, and EXOAB-CD81A-1; System Biosciences Inc.) at 4C overnight. After washing, the membranes were then incubated with HRP-labeled goat anti-rabbit IgG (1:20,000, System Biosciences Inc.) at room temperature for 1 hr. Finally, membranes were visualized using the enhanced chemiluminescence (ECL) detection system (GE Healthcare Buckinghamshire, UK). Equal protein loading was confirmed with β-actin (1:500, Clone AC-15; Sigma-Aldrich) performed on the same membranes after stripping.
Statistical Analysis
The results are presented as the mean ± SD. Significance was calculated using a Student’s t-test or using ANOVA with Bonferroni correction. Analyses were performed using SPSS software (IBM; Chicago, IL). For all comparisons, a value of p<0.05 was considered to indicate a significant difference.
Results
Exosomal Pellets
In general, the EQ methodology was simple to learn and easy to perform and did not necessitate any special equipment; in contrast, the classical UC method required appropriate facilities. Pellets obtained by EQ were large, readily discernable, and able to be detached easily from the tube walls (Fig. 1A). Although the same volume of saliva was used for the UC method, the pellets derived using this method were remarkably smaller and were tightly adhered to the tube wall, thus requiring meticulous preparations for further use (Fig. 1B); this became a matter of concern when the UC pellets were processed for further analysis.
Figure 1.

Exosomal pellets. (A) Pellet obtained using the ExoQuick-TCTM (EQ) method from 0.5 ml of saliva is shown at the bottom of a 15 ml tube. (B) Pellet obtained using the ultracentrifugation (UC) method from 0.5 ml of saliva is shown in a close-up view of the bottom of a 1-ml ultracentrifugation tube. It was in the form of a very thin, barely visible grayish film (in between the arrows).
Morphological Characteristics of Salivary Exosomes
EM and immunoEM
Both the EQ and UC pellets similarly revealed nanoparticles that were ultrastructurally consistent with exosomes. This included round-shaped vesicles surrounded by bi-layered membranes with diameters ranging between 30 nm to 120 nm (Fig. 2A, 2B).
Figure 2.

Characterization of salivary exosomes isolated by two methods. Electron micrographs of exosomes isolated from saliva by ExoQuick-TCTM (EQ) (A) and the classical ultracentrifugation (UC) method (B) demonstrating small vesicles of different sizes (ranging between 30–120 nm) with lipid bilayer membranes. Electron micrographs stained with 10-nm gold-conjugated anti-CD63 antibody and uranyl acetate counterstaining in EQ (C–E) and UC (F–H) preparations. Aggregate formation was a feature of the EQ preparations. With the UC method, exosomes were usually isolated as individual structures. (G) Note that the gold-stain method distinguished between a positively stained exosome (~50 nm) and a large (~250 nm), non-stained vesicular structure that was incompatible with an exosome.
The immunoEM micrographs of exosomes stained with 10-nm gold-conjugated anti-CD63 antibody showed aggregate formation and the presence of larger exosomes in EQ preparations (Fig. 2C–2E) as compared with those in UC preparations (Fig. 2F–2H). The negative control showed no labels in the exosomes (data not shown).
AFM
AFM used in a tapping mode enabled us to clearly demonstrate differences in the features of the pelleted nanoparticles isolated by each method. The most prominent finding was the heterogeneous organization of the pelleted nanoparticles isolated by EQ precipitation, in terms of the wide variation in shape and size of the nanoparticles demonstrated in both 2-dimensional (2D) and 3D topographic AFM images (Fig. 3A, 3B). This pattern can be attributed to the presence of large particles (>100 nm) and/or the formation of aggregates. In contrast, the UC preparation demonstrated separated nanoparticles. Although some variation in size was observed, they shared a fairly homogeneous circular morphology (Fig. 3C, 3D).
Figure 3.

Topography of salivary exosomes from healthy individuals observed under tapping mode atomic force microscopy (AFM). Exosomes on a mica surface precipitated by ExoQuick-TCTM (EQ) revealed heterogeneity in size and shape in both 2-dimensional (2D) (A) and 3D (B) images. In contrast, 2D (C) and 3D (D) images of the ultracentrifugation (UC) pellets showed individual, regular, fairly rounded structures.
Molecular Characteristics of Salivary Exosomes
ELISA
Using a 0.5 ml volume of saliva, proteins corresponding to CD63, CD9 and CD81 were identified in samples from both methods of exosome isolation (Fig. 4). In EQ preparations, a trend of a higher mean concentration was observed in all three exosomal markers compared to UC, but it did not reach statistical significance (p>0.05).
Figure 4.
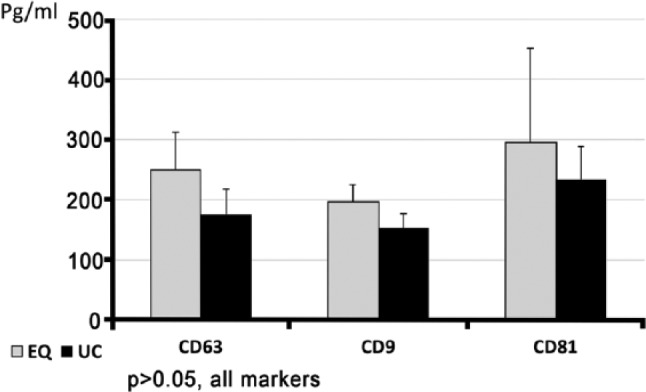
Exosomal marker identification, as analyzed by ELISA. Equal volumes of 0.5 ml of whole saliva showed a trend toward higher concentrations in the expression of exosomal markers in pellets obtained using ExoQuick-TCTM (EQ) method as compared with that obtained using ultracentrifugation (UC).
EGFR was detected in all of the examined pellets, as determined using ELISA, which ensured a human epithelium source of the pellets. EGFR protein had a significantly higher mean concentration in samples obtained using the EQ method as compared with that using UC (548.4 ± 20.5 pg/ml versus 412.3 ± 79 pg/ml, respectively, p=0.004).
WB
Loading ~60 µg of total protein per well derived by both methods was found to be adequate to show the expression of the three exosomal markers. The patterns of expression of these markers in terms of band distribution have been previously described by others (Radford et al. 1996; Tominaga et al. 2014). As depicted in Figure 5, there was a fairly similar expression for CD63, CD9 and CD81 for both isolation methods; however the bands in the EQ sample were less intense than the corresponding UC sample bands. The predicted molecular weight of CD63 is 25 kDa and, accordingly, both samples had a prominent band at around 25 kDa. Glycosylation of CD63 impairs antibody binding leading to more non-specific binding of a 35-kDa low-glycosylated form that is present in both EQ and UC samples, as well as a 53-kDa higher-glycosylated form that is visible mainly in the UC samples together with additional smears (Schröder et al. 2009; Tominaga et al. 2014). The antibody against CD9 found a 28 kDa band for CD9 protein in both samples, but the intensity was again higher in the UC sample. In the UC sample, the antibody against CD81 identified a thick single band in the area of the expected 26 kDa. In the EQ sample, two separate thin and weak bands were seen at the 26 kDa and 24 kDa areas. Additional higher molecular weight bands, representing non-specific bindings or aggregate formations of CD81 with other tetraspanins, were detected in both samples, as previously shown by Radford et al. (1996).
Figure 5.
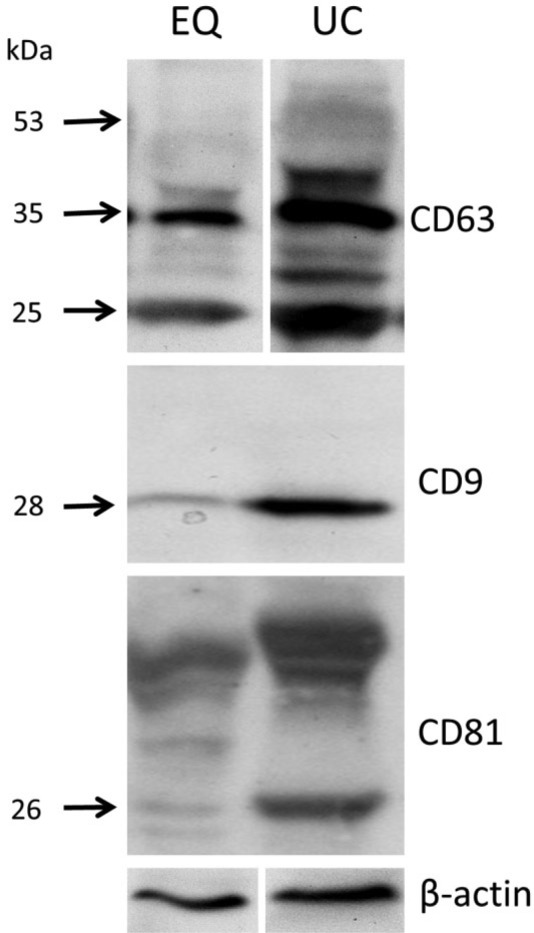
Identification of exosomal markers by western blotting. Sixty µg of total protein derived from salivary exosomal pellet lysates isolated using ExoQuick-TCTM (EQ) or ultracentrifugation (UC) were separated by 12% SDS-PAGE (under reducing conditions), electro-transferred and incubated with antibodies against exosomal markers (CD63, CD9, CD81, 1:1000 each) and β-actin (1:500). The molecular weight standards (kDa) are marked on the left. The three markers were identified (arrows) in the exosomal pellets isolated by both methods. UC bands of the isolated proteins had consistently more intense and specific signals as compared to the EQ bands.
Discussion
The demonstration of exosomes existing in human saliva (Ogawa et al. 2008; Gonzalez-Begne et al. 2009) has stirred considerable interest in examining their characteristics, with researchers relying upon UC as the basic methodology for isolation (Michael et al. 2010; Palanisamy et al. 2010; Lässer et al. 2011). The current study is the first to isolate human saliva-derived exosomes using a chemical-based agent (EQ, ExoQuick-TC™). We found that the morphological and molecular features of the nanoparticles precipitated by EQ were similar to those isolated by UC, and therefore they were consistent with exosomes. In spite of our finding that both methods can be used for isolation of salivary exosomes, there were some differences in the exosomes produced by each method that have to be taken into consideration.
Morphologically, TEM generally showed exosomes that appeared as round-shaped structures ranging between 30–120 nm in diameter in precipitates from both methods. ImmunoEM staining with anti-CD63 confirmed the exosomal nature of the nanoparticles. In regard to AFM, while the images of EQ exosomal pellets showed a wide variability in the size and shape of the nanoparticles, including the formation of clusters and the presence of considerably large particles (> 120 nm), exosomes in the UC pellets could clearly be observed as separated single and uniformly round-shaped structures (<120 nm). These results were in line with previous AFM studies performed on salivary exosomes (Palanisamy et al. 2010; Sharma et al. 2011).
Molecular characterization of specific exosomal markers (e.g., CD63, CD9 and CD81) by ELISA showed that both methods had the capability to precipitate exosomes from a given small volume of saliva (0.5 ml). However, the expression of the exosomal markers tended to be higher in the EQ samples compared to UC; albeit significance was not attained. This can be explained, in part, by the observation that the chemical-based technique of EQ tends to precipitate larger exosomes (Burns et al. 2014; Caradec et al. 2014) compared to the physical-based method of UC. Furthermore, it can be assumed that, when using UC, the larger exosomes are eliminated with a net outcome of decreasing the concentration of the exosomal markers within the resulting pellet. These assumptions were supported by our AFM findings. In addition to larger exosomes, we suggest that EQ also co-precipitated soluble proteins and various types of microvesicles, as had been reported by others as well (Burns et al. 2014; Quackenbush et al. 2014; Van Deun et al. 2014; Zubiri et al. 2014). This was shown in the present study by a higher concentration of EGFR protein (a non-exosomal marker of epithelial cell membrane origin) in the EQ preparations as compared to the UC preparations. Moreover, the total-protein content per pellet in EQ was about three-fold higher than that attained using UC. Similarly, in a recent study in which EQ was used for the precipitation of exosomes from media of trophoblast cells, the total protein content in the EQ pellets was 10-fold higher than that in the UC pellets (Salomon et al. 2013). By performing WB analysis against CD63, CD9 and CD81 on pre-equilibrated samples for the amount of total protein content, we showed less pronounced bands in EQ preparations compared to UC for all examined markers. Thus, this further supports the suggestion that non-exosomal proteins constituted a higher proportion in the EQ preparations than in UC. Similar results were recently shown in the study of Van Deun et al. (2014), which compared EQ and UC among other methods for exosome isolation from media of a human breast cancer cell line.
In conclusion, we found that the EQ methodology was adequate and efficient for the isolation of salivary exosomes, similar to UC. However, there were some important differences in the methodology and the final exosomal product. The main advantage of EQ lies in its technical simplicity, and the possibility to use small volumes of bio-fluids with resulting efficient and manageable pellets. Presumably, EQ pellets contain larger exosomes as well as a higher content of biological impurities (e.g., membranous debris and microvesicles other than exosomes) in comparison to that achieved with UC. The classical UC method had the major benefit of isolating a more purified exosomal pellet that enables single nanoparticle examination, but its main weakness lies in its demanding procedural requirements and considerably smaller-sized pellets with assumedly reduced exosomal molecular contents. The advantages and limitations of each method should, therefore, be taken into consideration, and chosen according to the research aims and requirements.
Acknowledgments
The authors would like to thank Mrs. Ronit Galron, Department of Neurobiology, Faculty of Life Sciences, Tel Aviv University for her valuable technical assistance and Dr. Artium Khatchtouriants, The Center for Nanoscience and Nanotechnology, Tel Aviv University, for his AFM analysis. The authors also want to thank Ms. Esther Eshkol for editorial assistance.
Footnotes
Declaration of Conflicting Interests: The authors declared no potential conflicts of interest with respect to the research, authorship, and/or publication of this article.
Funding: The authors received no financial support for the research, authorship, and/or publication of this article.
References
- Burns G, Brooks K, Wildung M, Navakanitworakul R, Christenson LK, Spencer TE. (2014). Extracellular vesicles in luminal fluid of the ovine uterus. PLoS One 9:e90913. [DOI] [PMC free article] [PubMed] [Google Scholar]
- Caradec J, Kharmate G, Hosseini-Beheshti E, Adomat H, Gleave M, Guns E. (2014). Reproducibility and efficiency of serum-derived exosome extraction methods. Clin Biochem pii:S0009-9120(14)00405-6. [DOI] [PubMed] [Google Scholar]
- Chernousov MA, Stahl RC, Carey DJ. (2013). Tetraspanins are involved in Schwann cell-axon interaction. J Neurosci Res 91:1419-1428. [DOI] [PubMed] [Google Scholar]
- Davidovich E, Aframian DJ, Shapira J, Peretz B. (2010). A comparison of the sialochemistry, oral pH, and oral health status of Down syndrome children to healthy children. Int J Paediatr Dent 20:235-241. [DOI] [PubMed] [Google Scholar]
- Fabbri M, Paone A, Calore F, Galli R, Gaudio E, Santhanam R, Lovat F, Fadda P, Mao C, Nuovo GJ, Zanesi N, Crawford M, Ozer GH, Wernicke D, Alder H, Caligiuri MA, Nana-Sinkam P, Perrotti D, Croce CM. (2012). MicroRNAs bind to Toll-like receptors to induce prometastatic inflammatory response. Proc Natl Acad Sci U S A 31:E2110-E2116. [DOI] [PMC free article] [PubMed] [Google Scholar]
- Gonzalez-Begne M, Lu B, Han X, Hagen FK, Hand AR, Melvin JE, Yates JR. (2009). Proteomic analysis of human parotid gland exosomes by multidimensional protein identification technology (MudPIT). J Proteome Res 8:1304-1314. [DOI] [PMC free article] [PubMed] [Google Scholar]
- Hemler ME. (2003).Tetraspanin proteins mediate cellular penetration, invasion, and fusion events and define a novel type of membrane microdomain. Annu Rev Cell Dev Biol 19:397-422. [DOI] [PubMed] [Google Scholar]
- Kharaziha P, Ceder S, Li Q, Panaretakis T. (2012). Tumor cell-derived exosomes: a message in a bottle. Biochim Biophys Acta 1826:103-111. [DOI] [PubMed] [Google Scholar]
- Lakhal S, Wood MJ. (2011). Exosome nanotechnology: an emerging paradigm shift in drug delivery: exploitation of exosome nanovesicles for systemic in vivo delivery of RNAi heralds new horizons for drug delivery across biological barriers. Bioessays 33:737-741. [DOI] [PubMed] [Google Scholar]
- Lässer C, Alikhani VS, Ekström K, Eldh M, Paredes PT, Bossios A, Sjöstrand M, Gabrielsson S, Lötvall J, Valadi H. (2011). Human saliva, plasma and breast milk exosomes contain RNA: uptake by macrophages. J Transl Med 9:9. [DOI] [PMC free article] [PubMed] [Google Scholar]
- Lau CS, Wong DT. (2012). Breast cancer exosome-like microvesicles and salivary gland cells interplay alters salivary gland cell-derived exosome-like microvesicles in vitro. PLoS One 7:e33037. [DOI] [PMC free article] [PubMed] [Google Scholar]
- Lau C, Kim Y, Chia D, Spielmann N, Eibl G, Elashoff D, Wei F, Lin YL, Moro A, Grogan T, Chiang S, Feinstein E, Schafer C, Farrell J, Wong DT. (2013). Role of pancreatic cancer-derived exosomes in salivary biomarker development. J Biol Chem 288:26888-26897. [DOI] [PMC free article] [PubMed] [Google Scholar]
- Logozzi M, De Milito A, Lugini L, Borghi M, Calabrò L, Spada M, Perdicchio M, Marino ML, Federici C, Iessi E, Brambilla D, Venturi G, Lozupone F, Santinami M, Huber V, Maio M, Rivoltini L, Fais S. (2009). High levels of exosomes expressing CD63 and caveolin-1 in plasma of melanoma patients. PLoS One 4:e5219. [DOI] [PMC free article] [PubMed] [Google Scholar]
- Mathivanan S, Ji H, Simpson RJ. (2010). Exosomes: extracellular organelles important in intercellular communication. J Proteomics 73:1907-1920. [DOI] [PubMed] [Google Scholar]
- Mathivanan S, Fahner CJ, Reid GE, Simpson RJ. (2012). ExoCarta 2012: database of exosomal proteins, RNA and lipids. Nucleic Acids Res 40:D1241-D1244. [DOI] [PMC free article] [PubMed] [Google Scholar]
- Michael A, Bajracharya SD, Yuen PS, Zhou H, Star RA, Illei GG, Alevizos I. (2010). Exosomes from human saliva as a source of microRNA biomarkers. Oral Dis 16:34-38. [DOI] [PMC free article] [PubMed] [Google Scholar]
- Ogawa Y, Kanai-Azuma M, Akimoto Y, Kawakami H, Yanoshita R. (2008). Exosome-like vesicles with dipeptidyl peptidase IV in human saliva. Biol Pharm Bull 31:1059-1062. [DOI] [PubMed] [Google Scholar]
- Ogawa Y, Miura Y, Harazano A, Kanai-Azuma M, Akimoto Y, Kawakami H, Yamaguchi T, Toda T, Endo T, Tsubuki M, Yanoshita R. (2011). Proteomic analysis of two types of exosomes in human whole saliva. Biol Pharm Bull 34:13-23. [DOI] [PubMed] [Google Scholar]
- Palanisamy V, Sharma S, Deshpande A, Zhou H, Gimzewski JK, Wong DT. (2010). Nanostructural and transcriptomic analyses of human saliva derived exosomes. PLoS One 5:e8577. [DOI] [PMC free article] [PubMed] [Google Scholar]
- Pant S, Hilton H, Burczynski ME. (2012). The multifaceted exosome: biogenesis, role in normal and aberrant cellular function, and frontiers for pharmacological and biomarker opportunities. Biochem Pharmacol 83:1484-1494. [DOI] [PMC free article] [PubMed] [Google Scholar]
- Quackenbush JF, Cassidy PB, Pfeffer LM, Boucher KM, Hawkes JE, Pfeffer SR, Kopelovich L, Leachman SA. (2014). Isolation of circulating microRNAs from microvesicles found in human plasma. Methods Mol Biol 1102:641-653. [DOI] [PubMed] [Google Scholar]
- Radford KJ, Thorne RF, Hersey P. (1996). CD63 associates with transmembrane 4 superfamily members, CD9 and CD81, and with beta 1 integrins in human melanoma. Biochem Biophys Res Commun 222:13-18. [DOI] [PubMed] [Google Scholar]
- Salomon C, Sobrevia L, Ashman K, Illanes SE, Mitchell MD, Rice GE. (2013). ‘The role of placental exosomes in gestational diabetes mellitus’ in Sobrevia L. (ed.) Gestational Diabetes - Causes, Diagnosis and Treatment. ISBN 978-953-51-1077-4, pp. 29-47. [Google Scholar]
- Schageman J, Zeringer E, Li M, Barta T, Lea K, Gu J, Magdaleno S, Setterquist R, Vlassov AV. (2013). The complete exosome workflow solution: from isolation to characterization of RNA cargo. Biomed Res Int 2013:253957. [DOI] [PMC free article] [PubMed] [Google Scholar]
- Schröder J, Lüllmann-Rauch R, Himmerkus N, Pleines I, Nieswandt B, Orinska Z, Koch-Nolte F, Schröder B, Bleich M, Saftig P. (2009). Deficiency of the tetraspanin CD63 associated with kidney pathology but normal lysosomal function. Mol Cell Biol 29:1083-1094. [DOI] [PMC free article] [PubMed] [Google Scholar]
- Sharma S, Gillespie BM, Palanisamy V, Gimzewski JK. (2011). Quantitative nanostructural and single-molecule force spectroscopy biomolecular analysis of human-saliva-derived exosomes Langmuir 27:14394-14400. [DOI] [PMC free article] [PubMed] [Google Scholar]
- Sharma S, Rasool HI, Palanisamy V, Mathisen C, Schmidt M, Wong DT, Gimzewski JK. (2010). Structural-mechanical characterization of nanoparticle exosomes in human saliva, using correlative AFM, FESEM, and force spectroscopy. ACS Nano 4:1921-1926. [DOI] [PMC free article] [PubMed] [Google Scholar]
- Simons M, Raposo G. (2009). Exosomes–vesicular carriers for intercellular communication. Curr Opin Cell Biol 21:575-581. [DOI] [PubMed] [Google Scholar]
- Singh B, Coffey RJ. (2014). Trafficking of epidermal growth factor receptor ligands in polarized epithelial cells. Annu Rev Physiol 76:275-300. [DOI] [PMC free article] [PubMed] [Google Scholar]
- Suntres ZE, Smith MG, Momen-Heravi F, Hu J, Zhang X, Wu Y, Zhu H, Wang J, Zhou J, Kuo WP. (2013). Therapeutic uses of exosomes. Intech Open Access Article, available at: http://cdn.intechopen.com/pdfs-wm/44129.pdf.
- Taylor DD, Zacharias W, Gercel-Taylor C. (2011). ‘Exosome isolation for proteomic analyses and RNA profiling’ in Simpson RJ, Greening DW. (eds.) Serum/Plasma Proteomics: Methods and Protocols. Methods in Molecular Biology, 728, DOI 10.1007/978-1-61779-068-3_15, New York, NY: Springer Science+Business Media, LLC. [DOI] [PubMed] [Google Scholar]
- Théry C, Amigorena S, Raposo G, Clayton A. (2006). Isolation and characterization of exosomes from cell culture supernatants and biological fluids. Curr Protoc Cell Biol 30:3.22.1–3.22.29. [DOI] [PubMed] [Google Scholar]
- Tominaga N, Hagiwara K, Kosaka N, Honma K, Nakagama H, Ochiya T. (2014). RPN2-mediated glycosylation of tetraspanin CD63 regulates breast cancer cell malignancy. Mol Cancer 31:134. [DOI] [PMC free article] [PubMed] [Google Scholar]
- Valadi H, Ekström K, Bossios A, Sjöstrand M, Lee JJ, Lötvall JO. (2007). Exosome-mediated transfer of mRNAs and microRNAs is a novel mechanism of genetic exchange between cells. Nat Cell Biol 9:654-659. [DOI] [PubMed] [Google Scholar]
- Van Deun J, Mestdagh P, Sormunen R, Cocquyt V, Vermaelen K, Vandesompele J, Bracke M, De Wever O, Hendrix A. (2014). The impact of disparate isolation methods for extracellular vesicles on downstream RNA profiling. J Extracell Vesicles 3:24858. [DOI] [PMC free article] [PubMed] [Google Scholar]
- Vlassov AV, Magdaleno S, Setterquist R, Conrad R. (2012). Exosomes: current knowledge of their composition, biological functions, and diagnostic and therapeutic potentials. Biochim Biophys Acta 1820:940-948. [DOI] [PubMed] [Google Scholar]
- Yarden Y. (2001). The EGFR family and its ligands in human cancer: signaling mechanism and therapeutic opportunities. Eur J Cancer 37:S3-S8. [DOI] [PubMed] [Google Scholar]
- Zubiri I, Posada-Ayala M, Sanz-Maroto A, Calvo E, Martin-Lorenzo M, Gonzalez-Calero L, de la Cuesta F, Lopez JA, Fernandez-Fernandez B, Ortiz A, Vivanco F, Alvarez-Llamas G. (2014). Diabetic nephropathy induces changes in the proteome of human urinary exosomes as revealed by label-free comparative analysis. J Proteomics 96:92-102. [DOI] [PubMed] [Google Scholar]