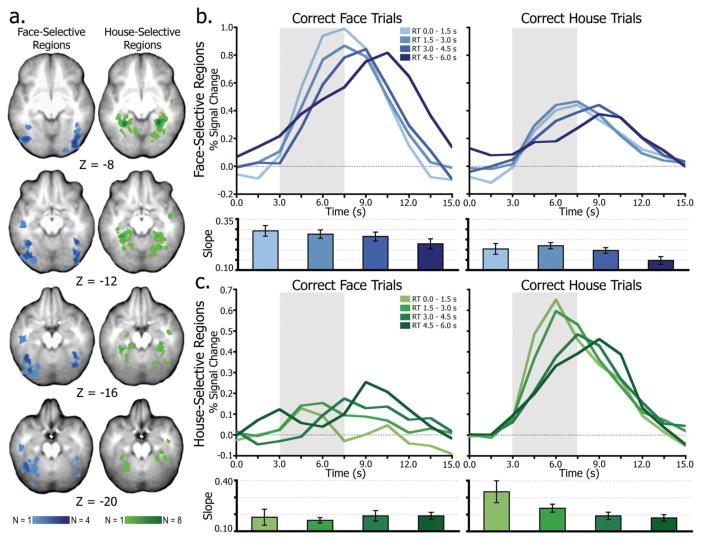
Figure 2.
Accumulation in IT regions. (a), Composite map of individual subject ROIs indicating face-selective (blue) and house-selective (green) regions. Darker colors indicate more overlap of region loci across subjects. (b), Average time series from all face-selective regions separated by time of subject’s behavioral response. The slope (percent signal change over time) of the leading edge of these time series is plotted below for each condition. The gray box highlights the leading edge of the time series, illustrating the differential rates of accumulation leading up to decision time. (c), results from house-selective regions.

