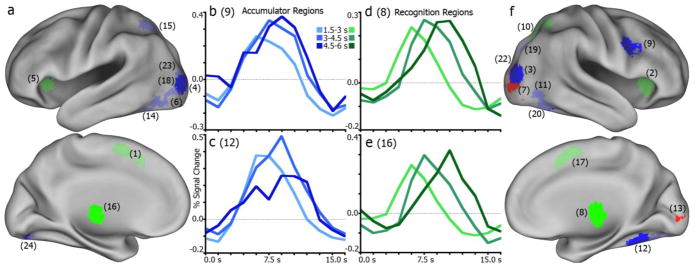
Figure 9.

Categorization of regions for correct face trials. (a), left hemisphere regions categorized as accumulator (blue), moment-of-decision (green), or sensory (red) regions. Bright shades indicate consistency in classification with comparable regions in Ploran et al., 2007. Lighter shades indicate inconsistent region function. Numbers in parenthesis designate region index in Tables 2–4. (b), example region (R9, right inferior frontal gyrus) time series for four RT conditions illustrating a consistent accumulator. (c), another consistent accumulator (R12, right fusiform gyrus). (d), example region (R8, right thalamus) time series of a consistent moment-of-decision region. (e), another consistent moment-of-decision region (R16, left thalamus). (f), illustration of right hemisphere regions and functional categorization consistency.
